

Jackson Hole came in hawkish, Nvidia beat its straddle, and the market’s answer to both was to sell volatility everywhere. Implied vol fell across the board over the five sessions to Monday.
Quick note before we delve in, all the analytics are from Tradingriot.com, you can sign up and get deep historical data for equities, commodities, rates, FX & digital assets which are distilled into daily signals and actionable strategies.
The repricing landed in rates instead. The two-year yield went 4.20% on Friday to 4.34% on Monday and the 10s2s curve flattened from 46 to 41 basis points, which is what a market pulling forward the odds of a hike looks like. Gold gave back 4.28%, the biggest move on the board. Everything that had been paid for over the previous fortnight got marked down.
Macro
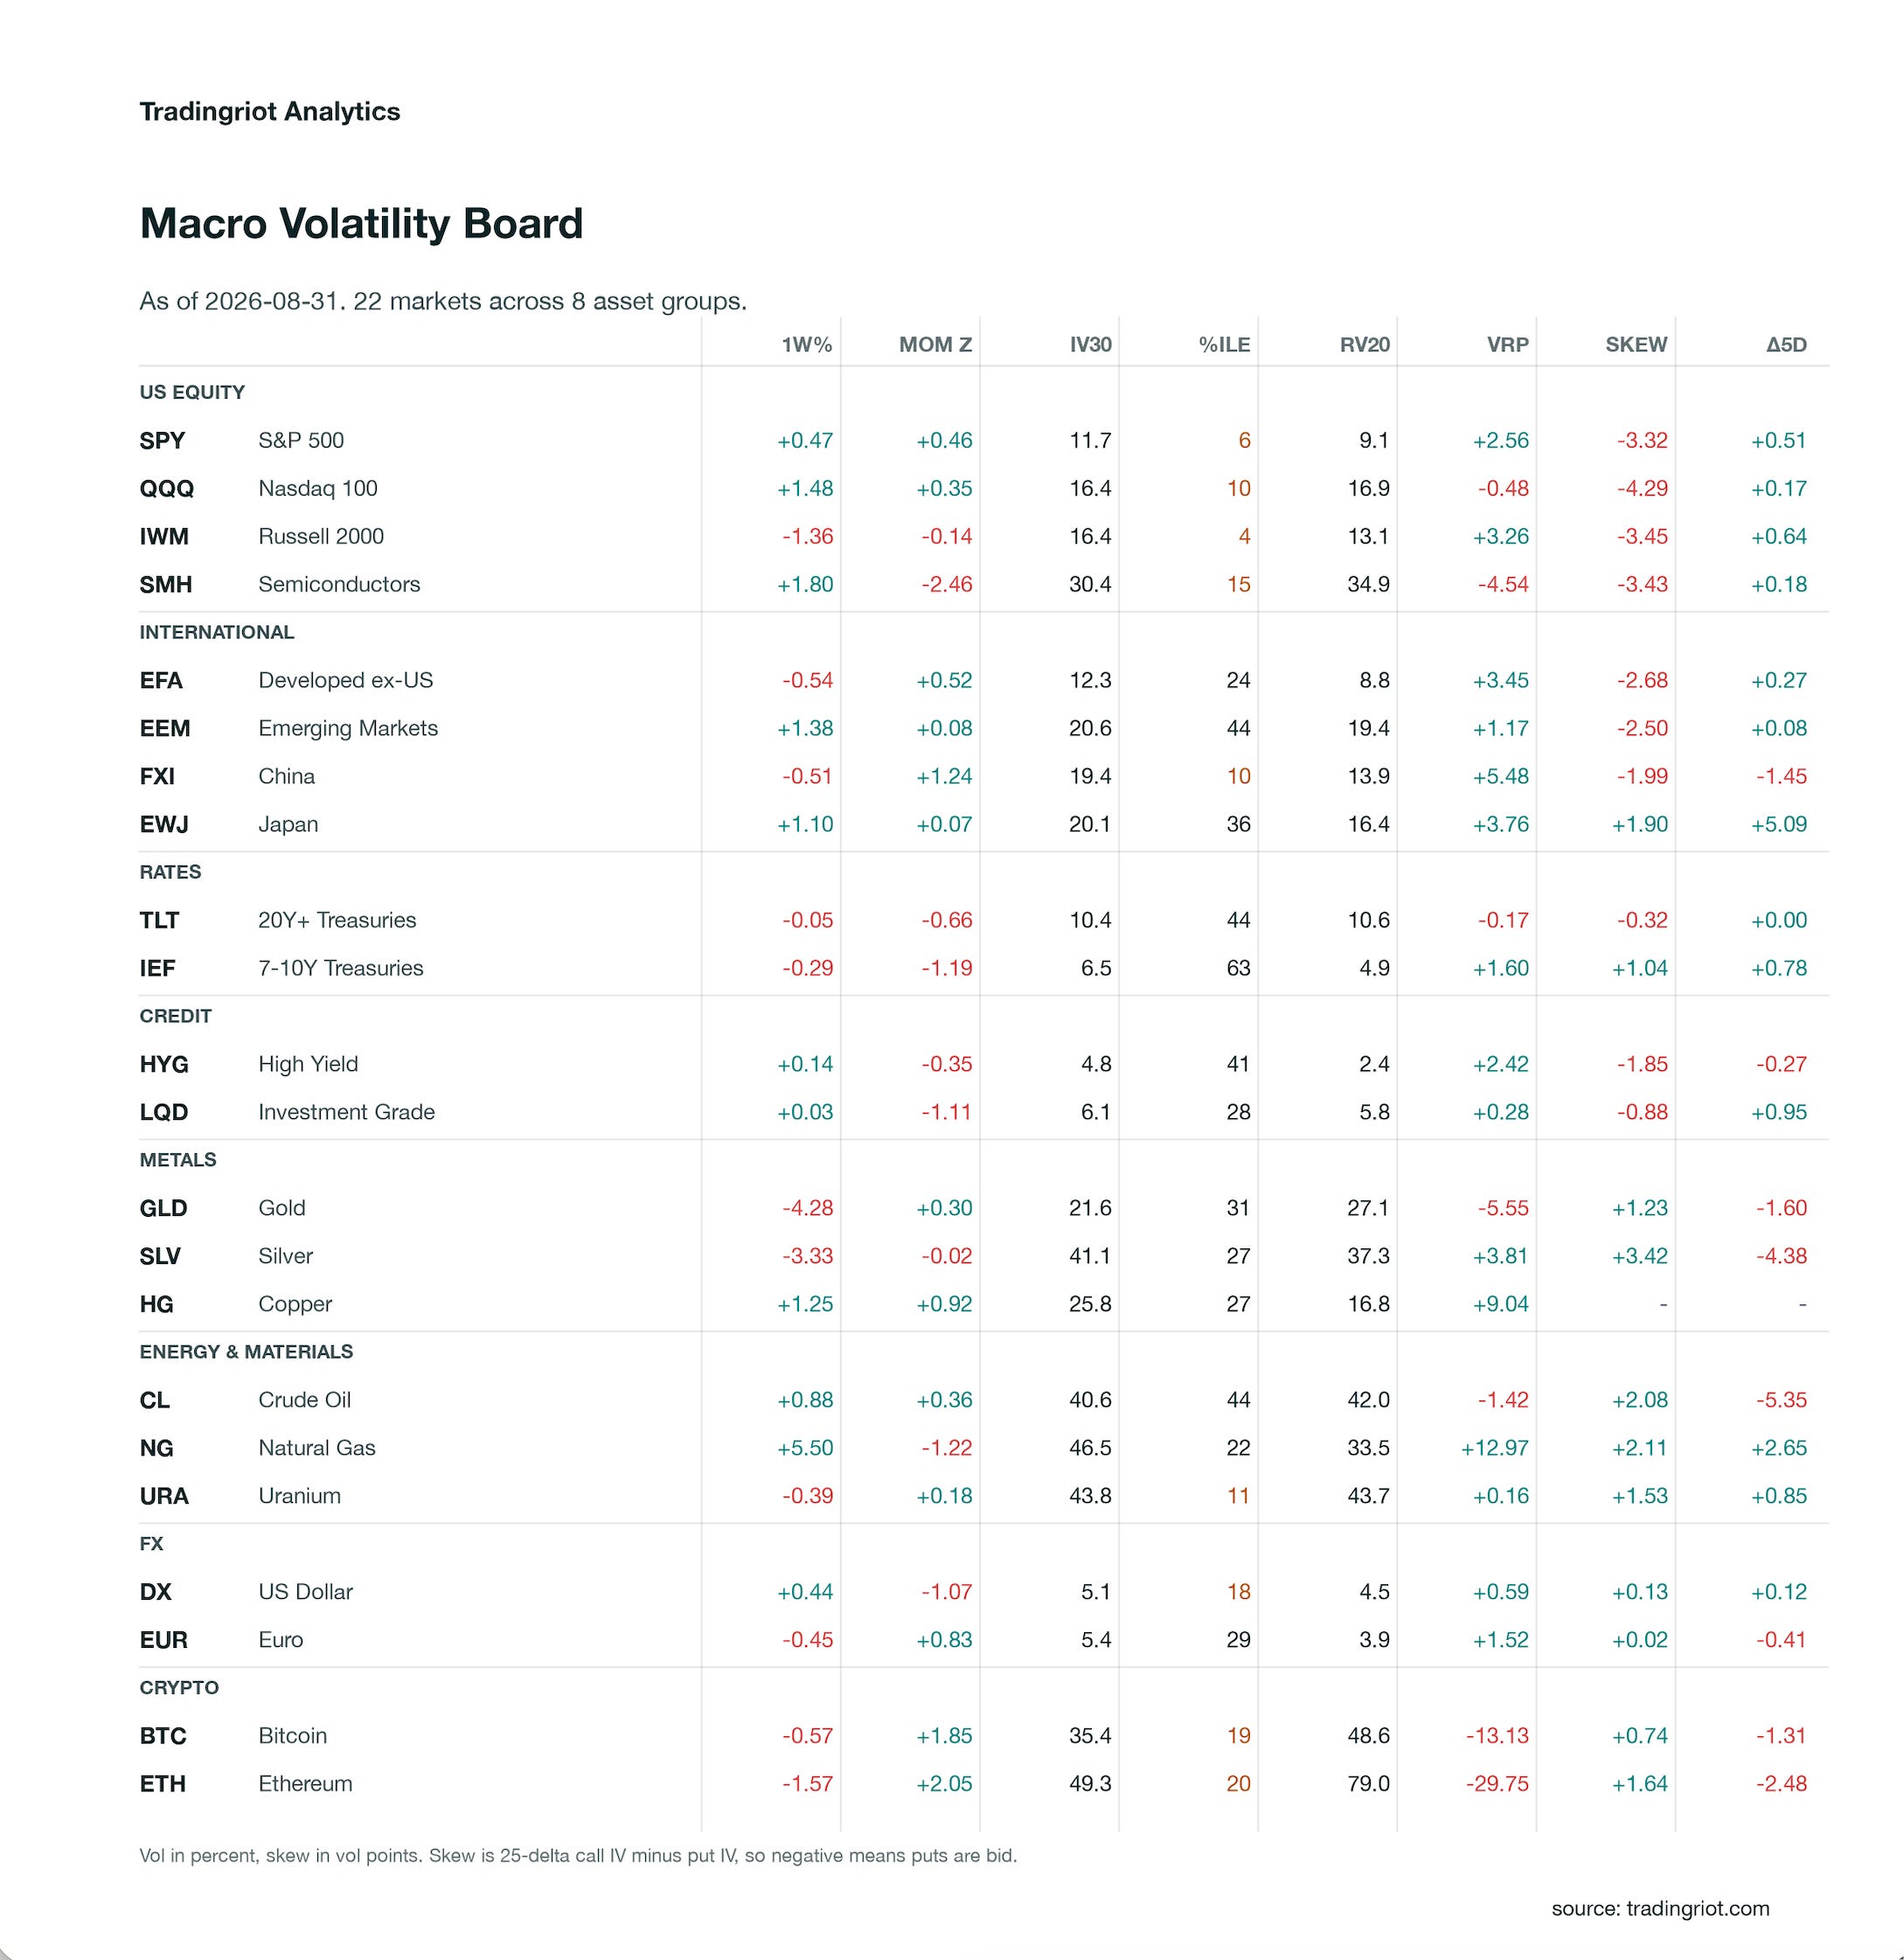
The four largest implied vol declines were semiconductors at 6.33 vol points, crude at 5.22, silver at 4.61 and gold at 4.47. Four markets saw implied vol rise: natural gas 1.76, uranium 0.52, high yield 0.43 and the dollar 0.08. The bottom of the percentile table is US equity, with IWM at the 4th percentile of its year, SPY at the 6th, and QQQ and FXI both at the 10th.
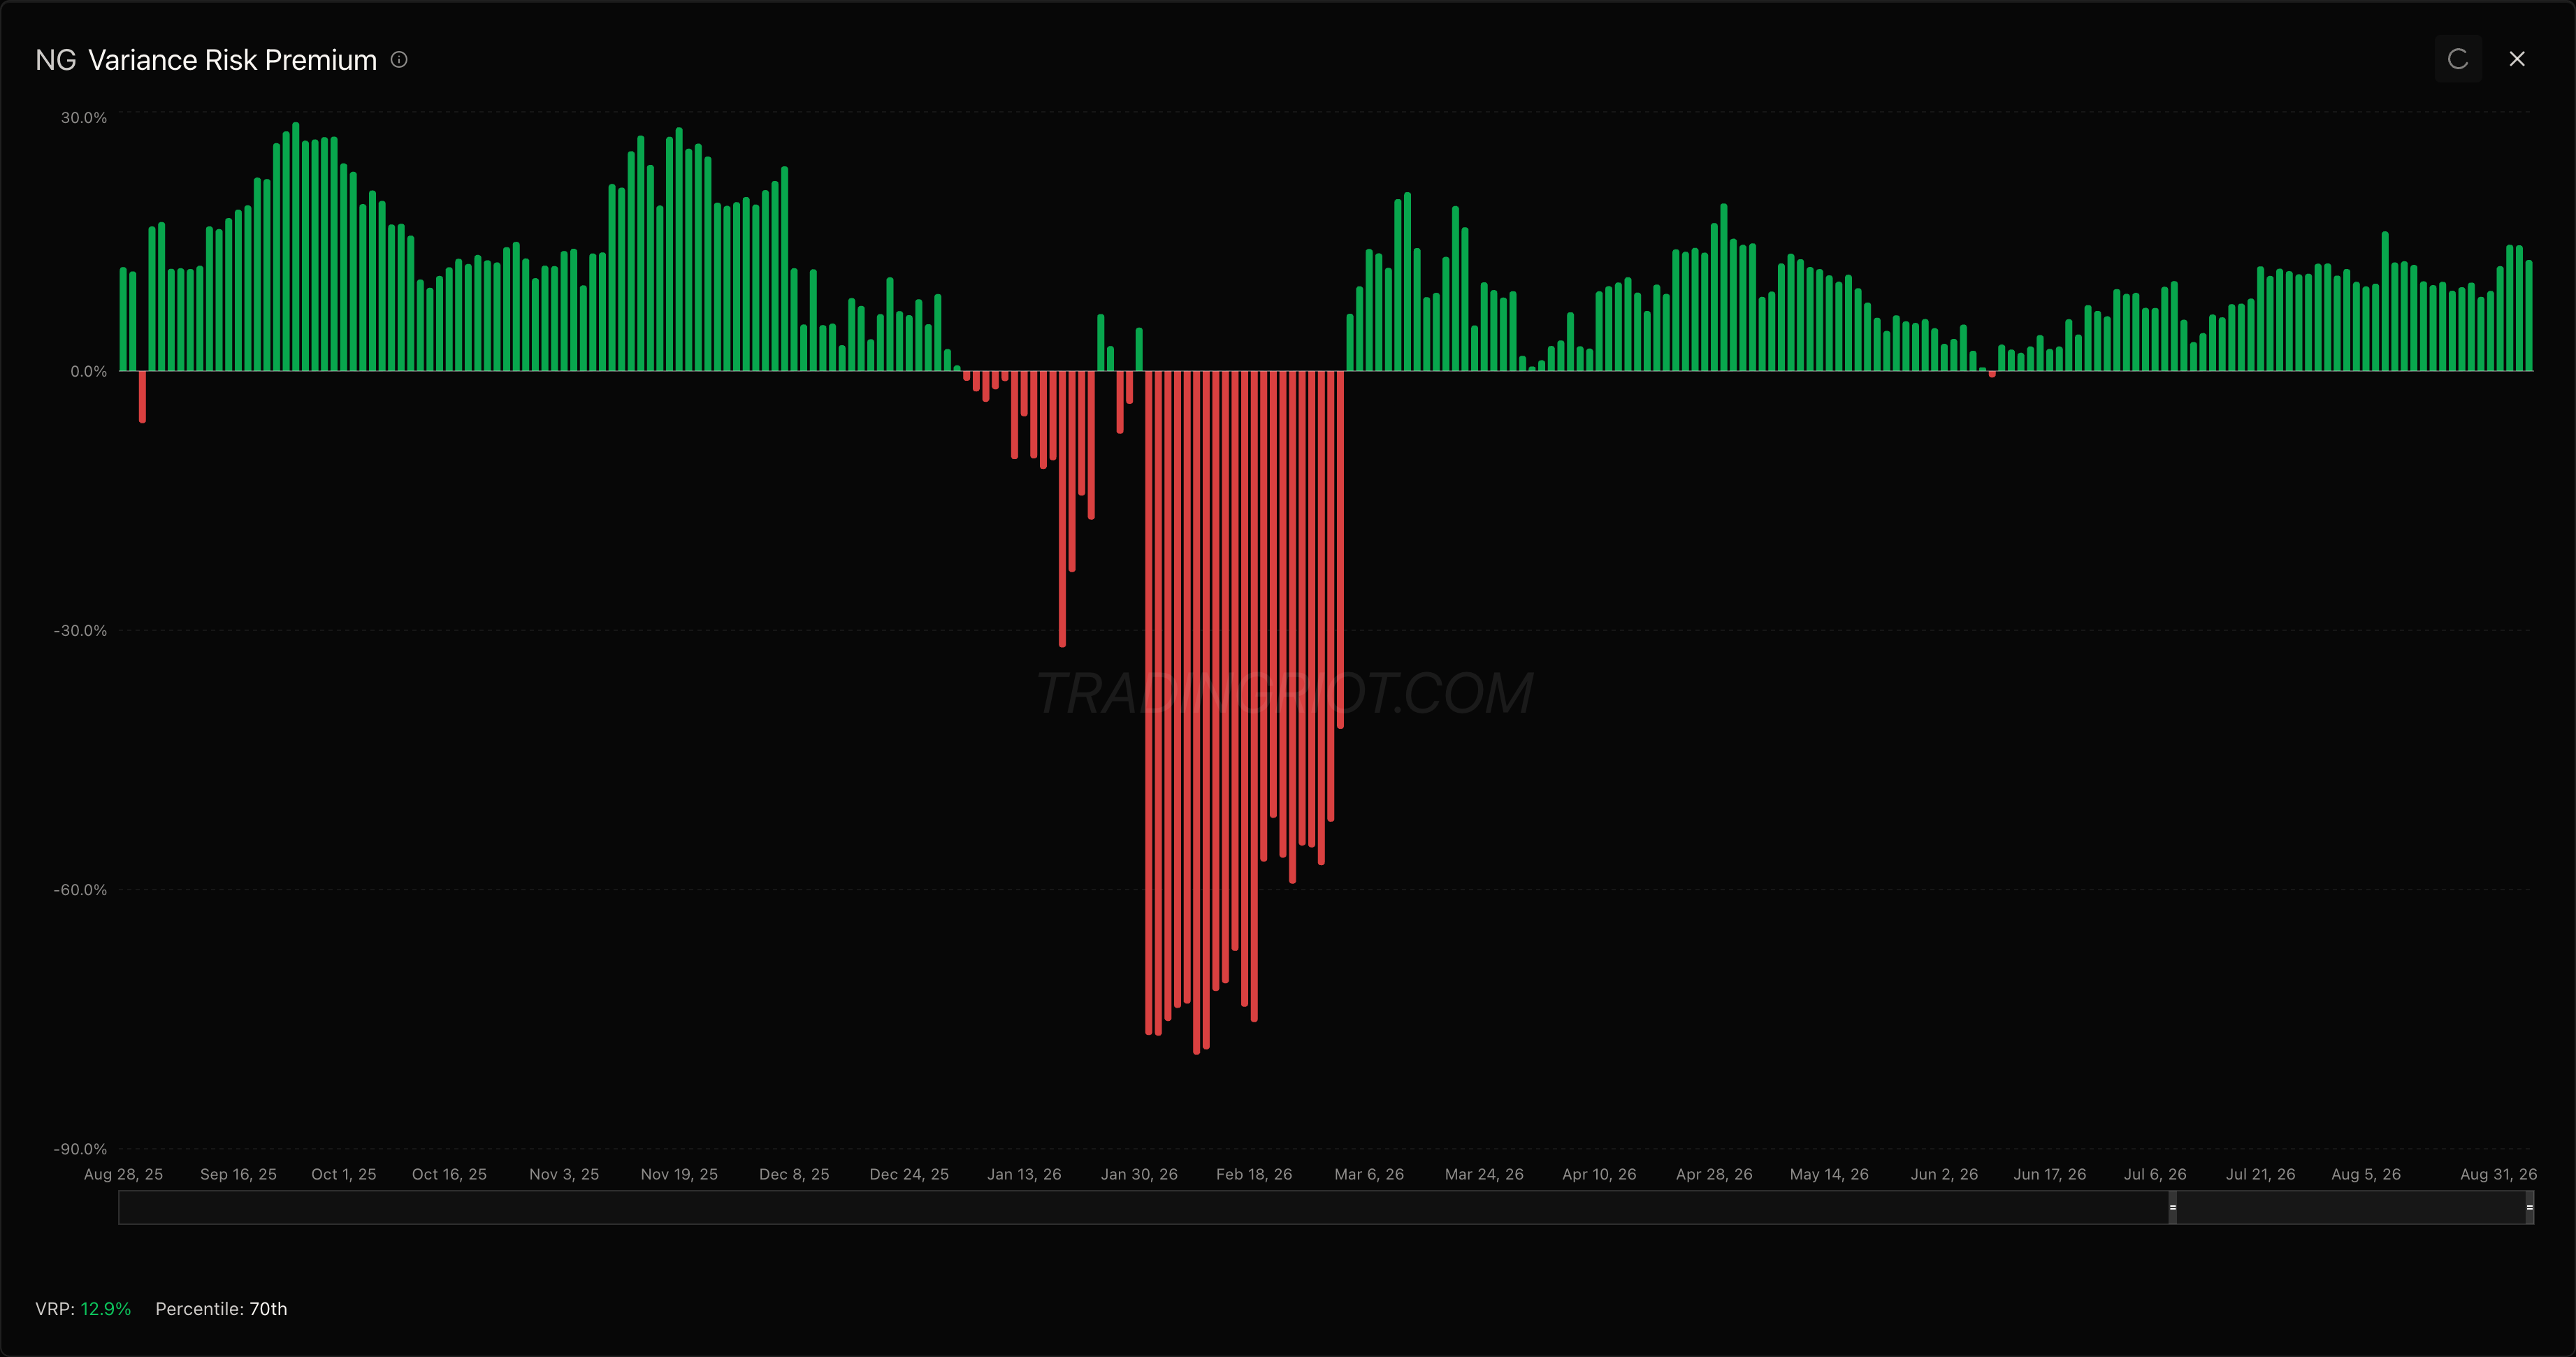
The two widest variance risk premiums sit in commodities. Natural gas prices 46.5 implied against 33.5 realized, and copper 25.8 against 16.8, a gap of 9.04 vol points that ranks at the 97th percentile of copper’s own year. Both are options markets charging for a move the underlying is not making.
At the other end, Ethereum sits at -29.75 and Bitcoin at -13.13, both an artifact of a 20-day realized window that still holds last month’s rally.
Equities
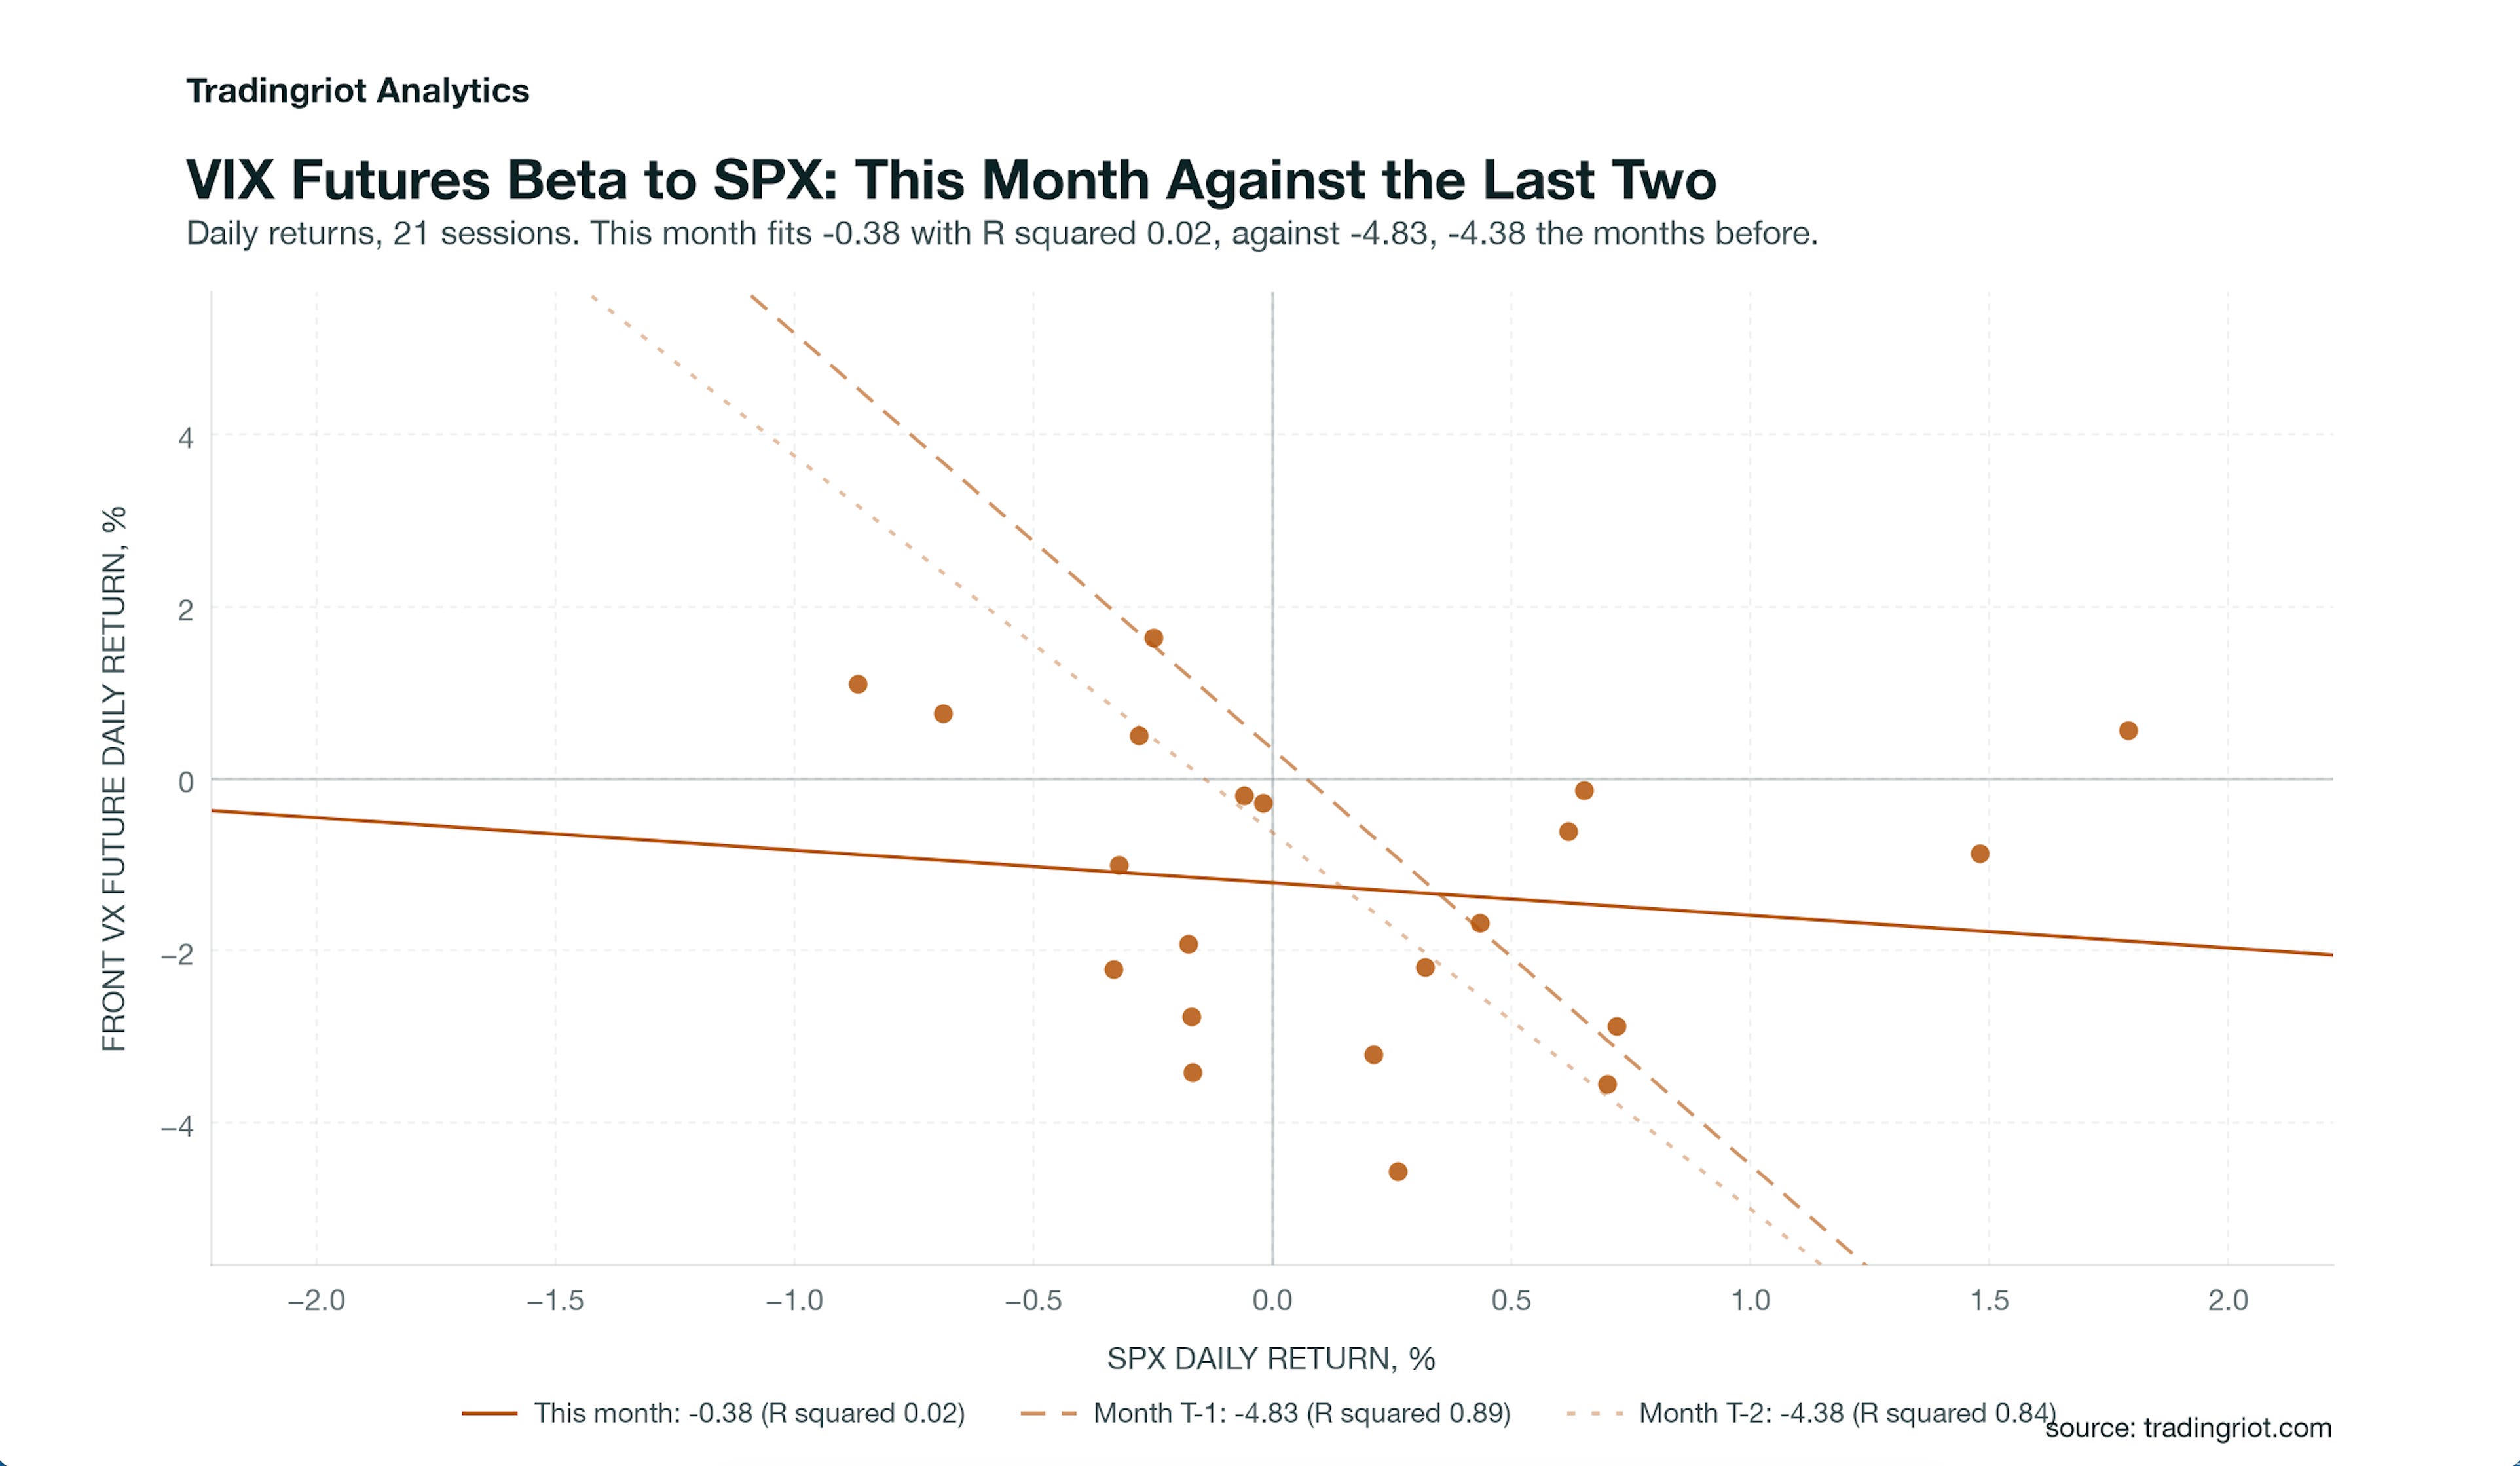
The VIX curve was quiet all week and the front VIX future came loose from SPX entirely.
VIX ran 15.85 on the 24th to 14.43 on Friday, the 2.7th percentile of its year, and back to 14.92 on Monday. No leg of the curve inverted at any point. The only leg carrying anything is 6M to 3M at 2.64 vol points, the 94th percentile with a z of +1.16, so the back end is steep while the front sits mid-range. Cboe puts the SPX 1-year against 1-month spread at the 96th percentile high, the same observation two tenors further out.
The front VX future’s 21-session beta to SPX is now -0.38, with an R squared of 0.02. Last month it fit -4.83 at an R squared of 0.89, and the month before -4.38 at 0.84. In plain terms, SPX down 1% moved the front future about 0.4% this month against roughly 4.8% a month ago, and the fit now explains 2% of the variance where it explained 89%. The beta level is at the 100th percentile of its own year, the least negative it has been. The hedge relationship stopped working.
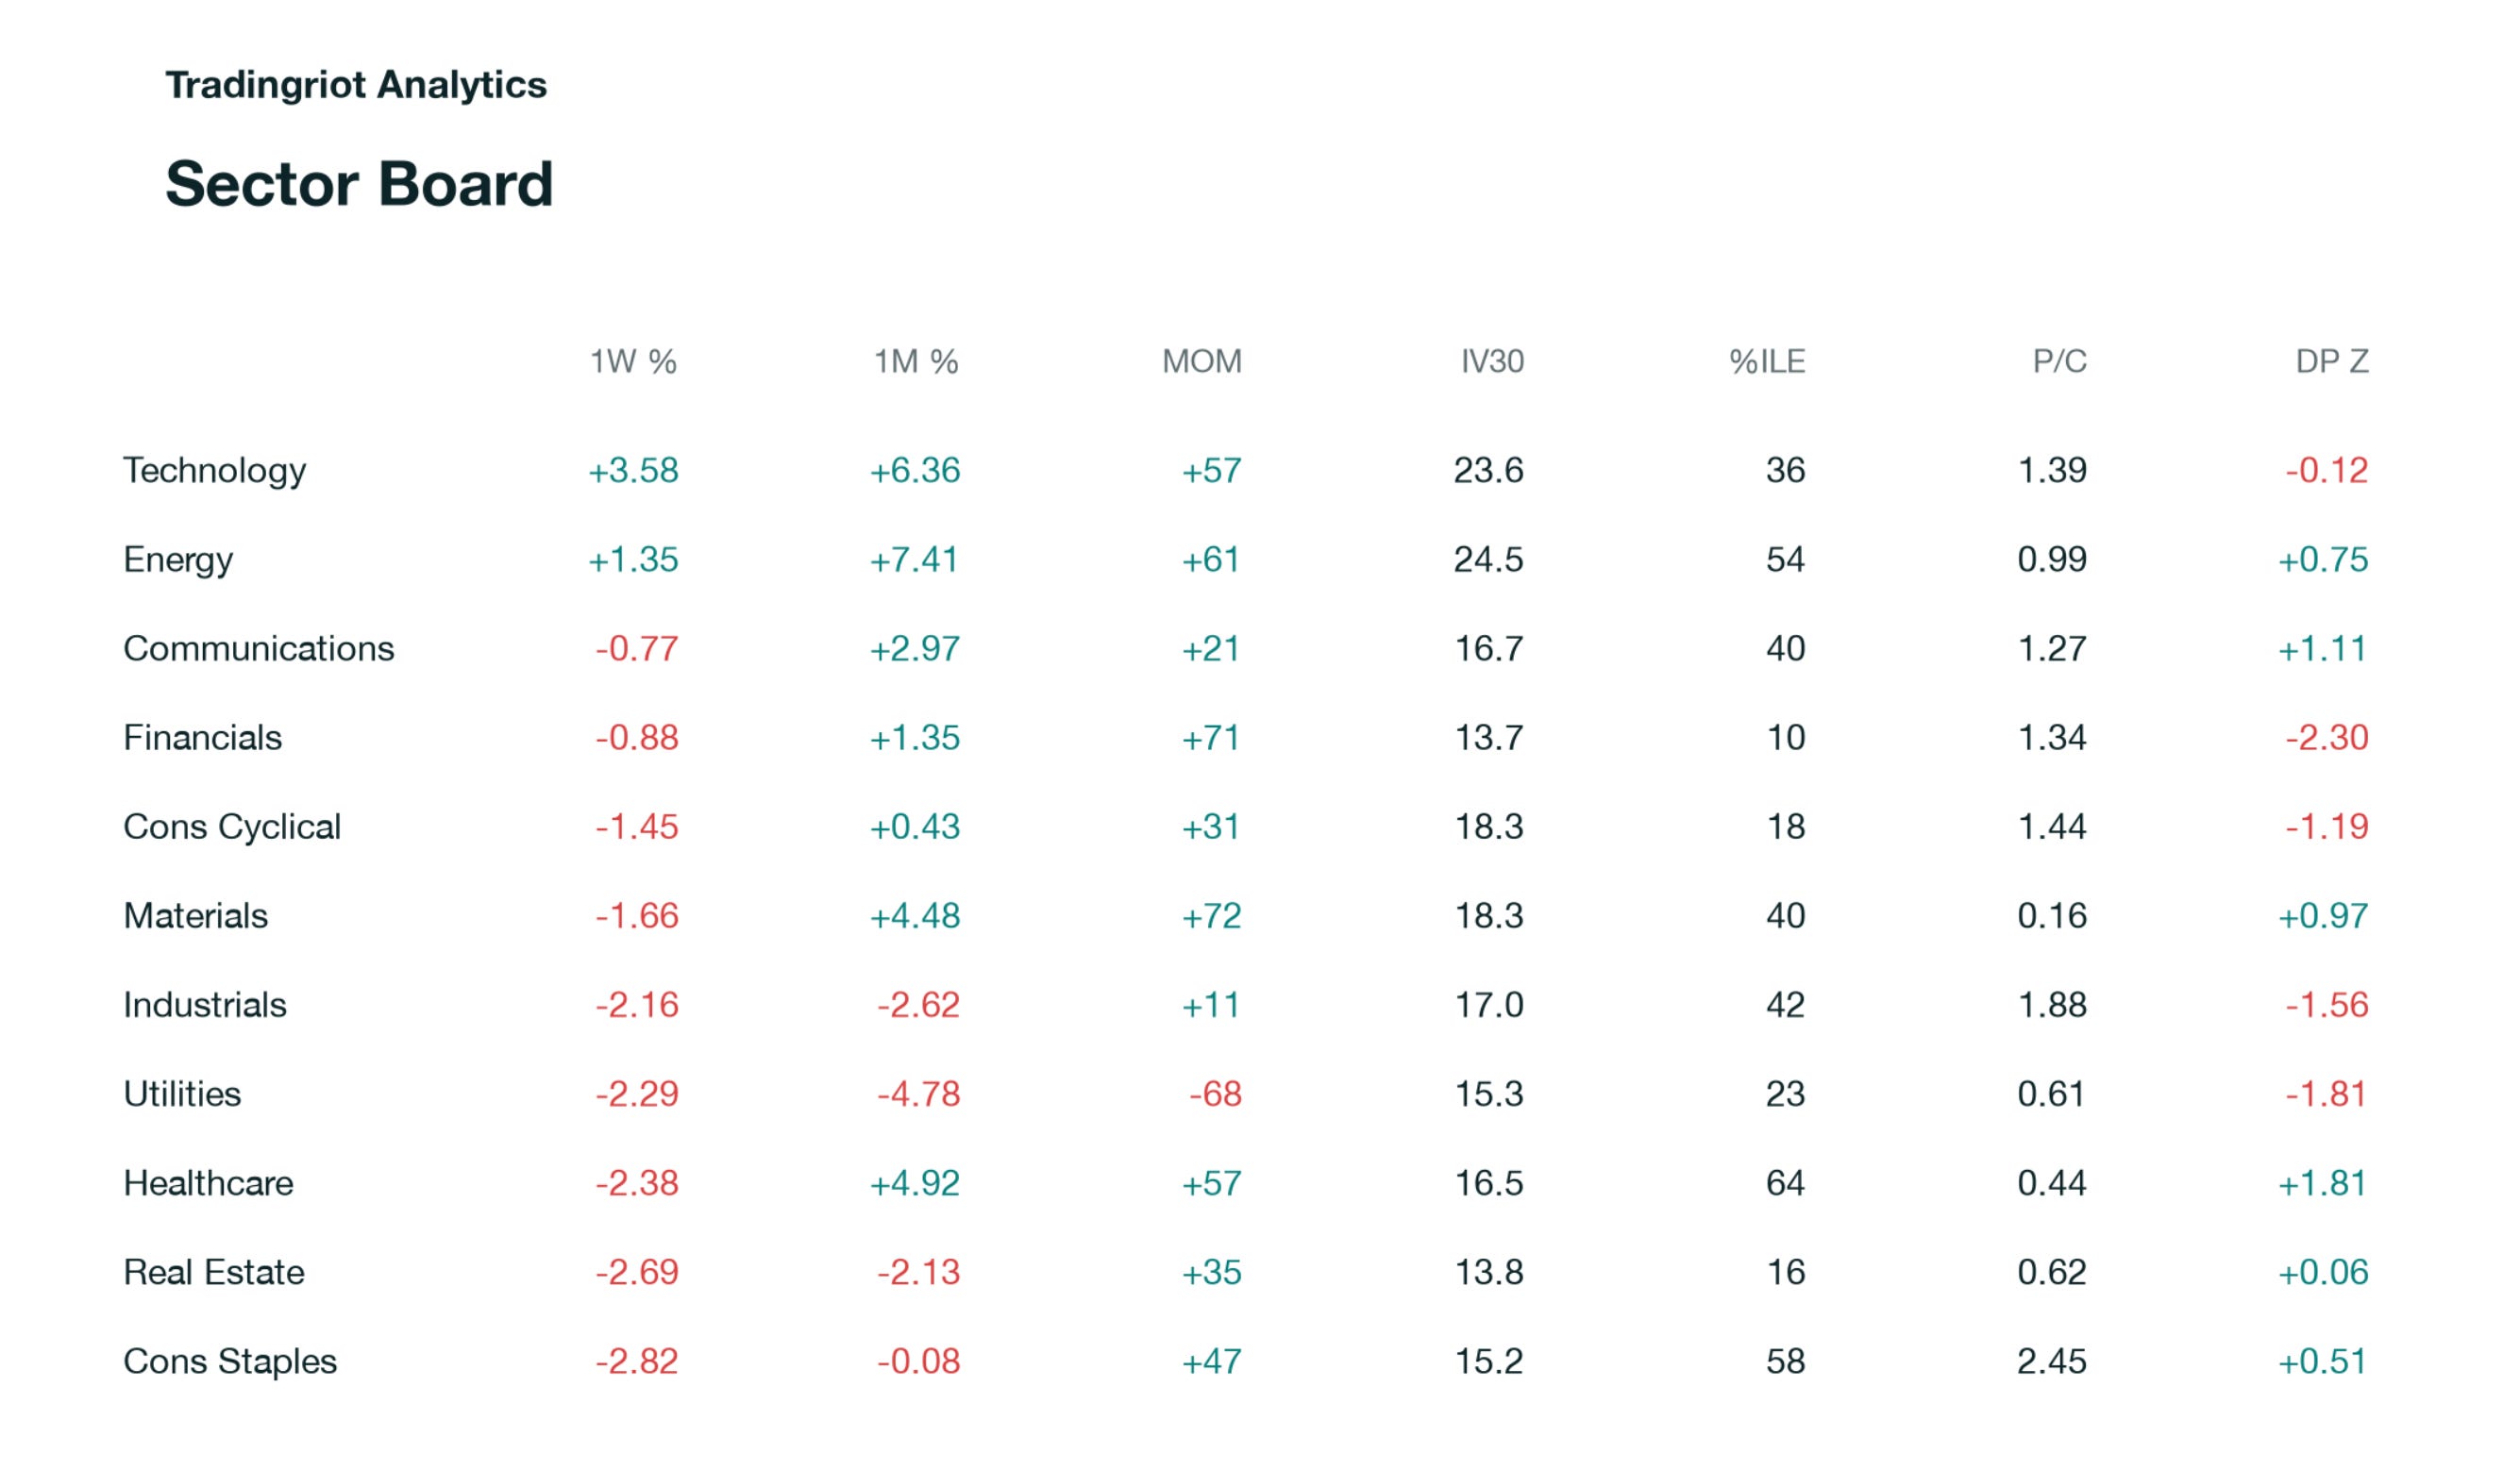
Two sectors were up on the week and nine were down. Technology added 3.58% and energy 1.35%. Staples lost 2.82%, real estate 2.69%, healthcare 2.38% and utilities 2.29%. The four heaviest losses are the four most rate-sensitive groups, which fits the front-end selloff better than anything in the vol surface does.
Built from the 507 single names carrying both a sector and a momentum reading, technology holds 18 of the top momentum decile out of 124 names, median monthly return 6.12%, against utilities at none of 13 and a median of -6.92%. Basic materials is again the odd one, with the strongest median monthly return on the board at 19.2% and the only negative median carry at -3.6%. The metals move keeps happening with the options market barely charging for it, and that survived a week in which gold fell over four percent.
Nvidia is the sharpest single reading in equities. It reported on the 26th, priced a 5.91% move and delivered 8.74%.
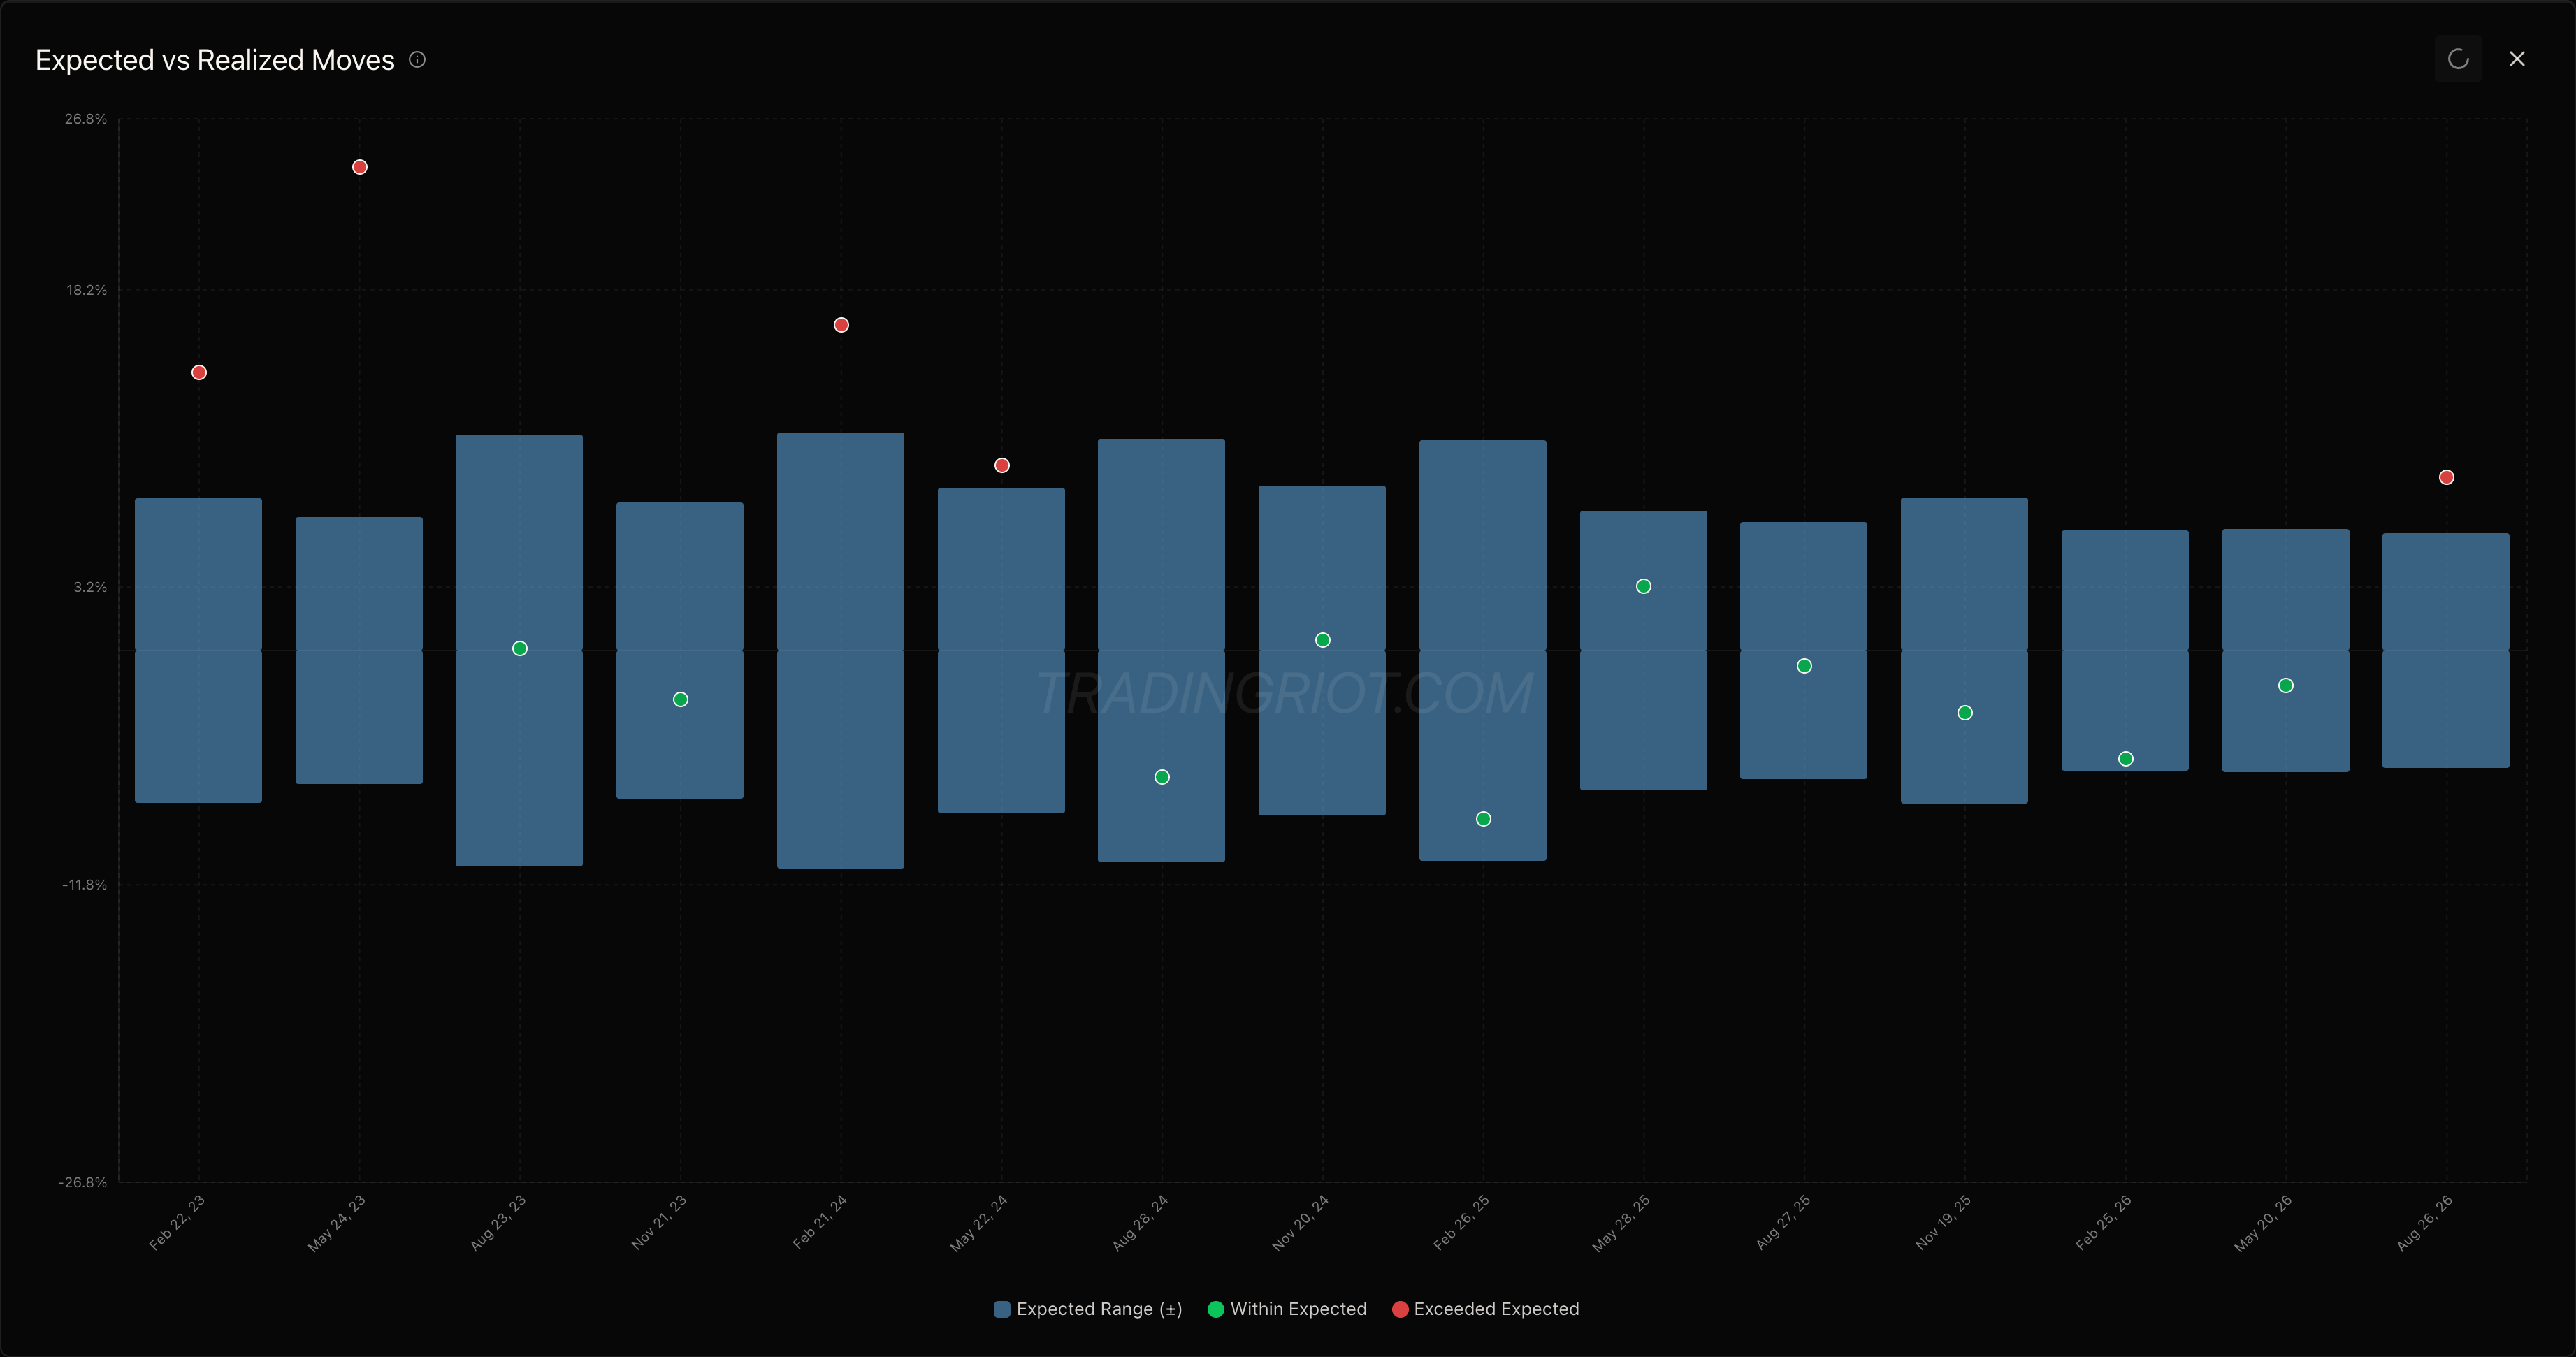
Its 30-day implied now sits at 30.68, the 0.4th percentile of its own year and the cheapest surface of any liquid name on the board, against 44.37 realized over twenty days and 54.43 over ten. The most heavily traded options in the market are priced for a stock that has stopped moving, and the stock has not stopped moving.
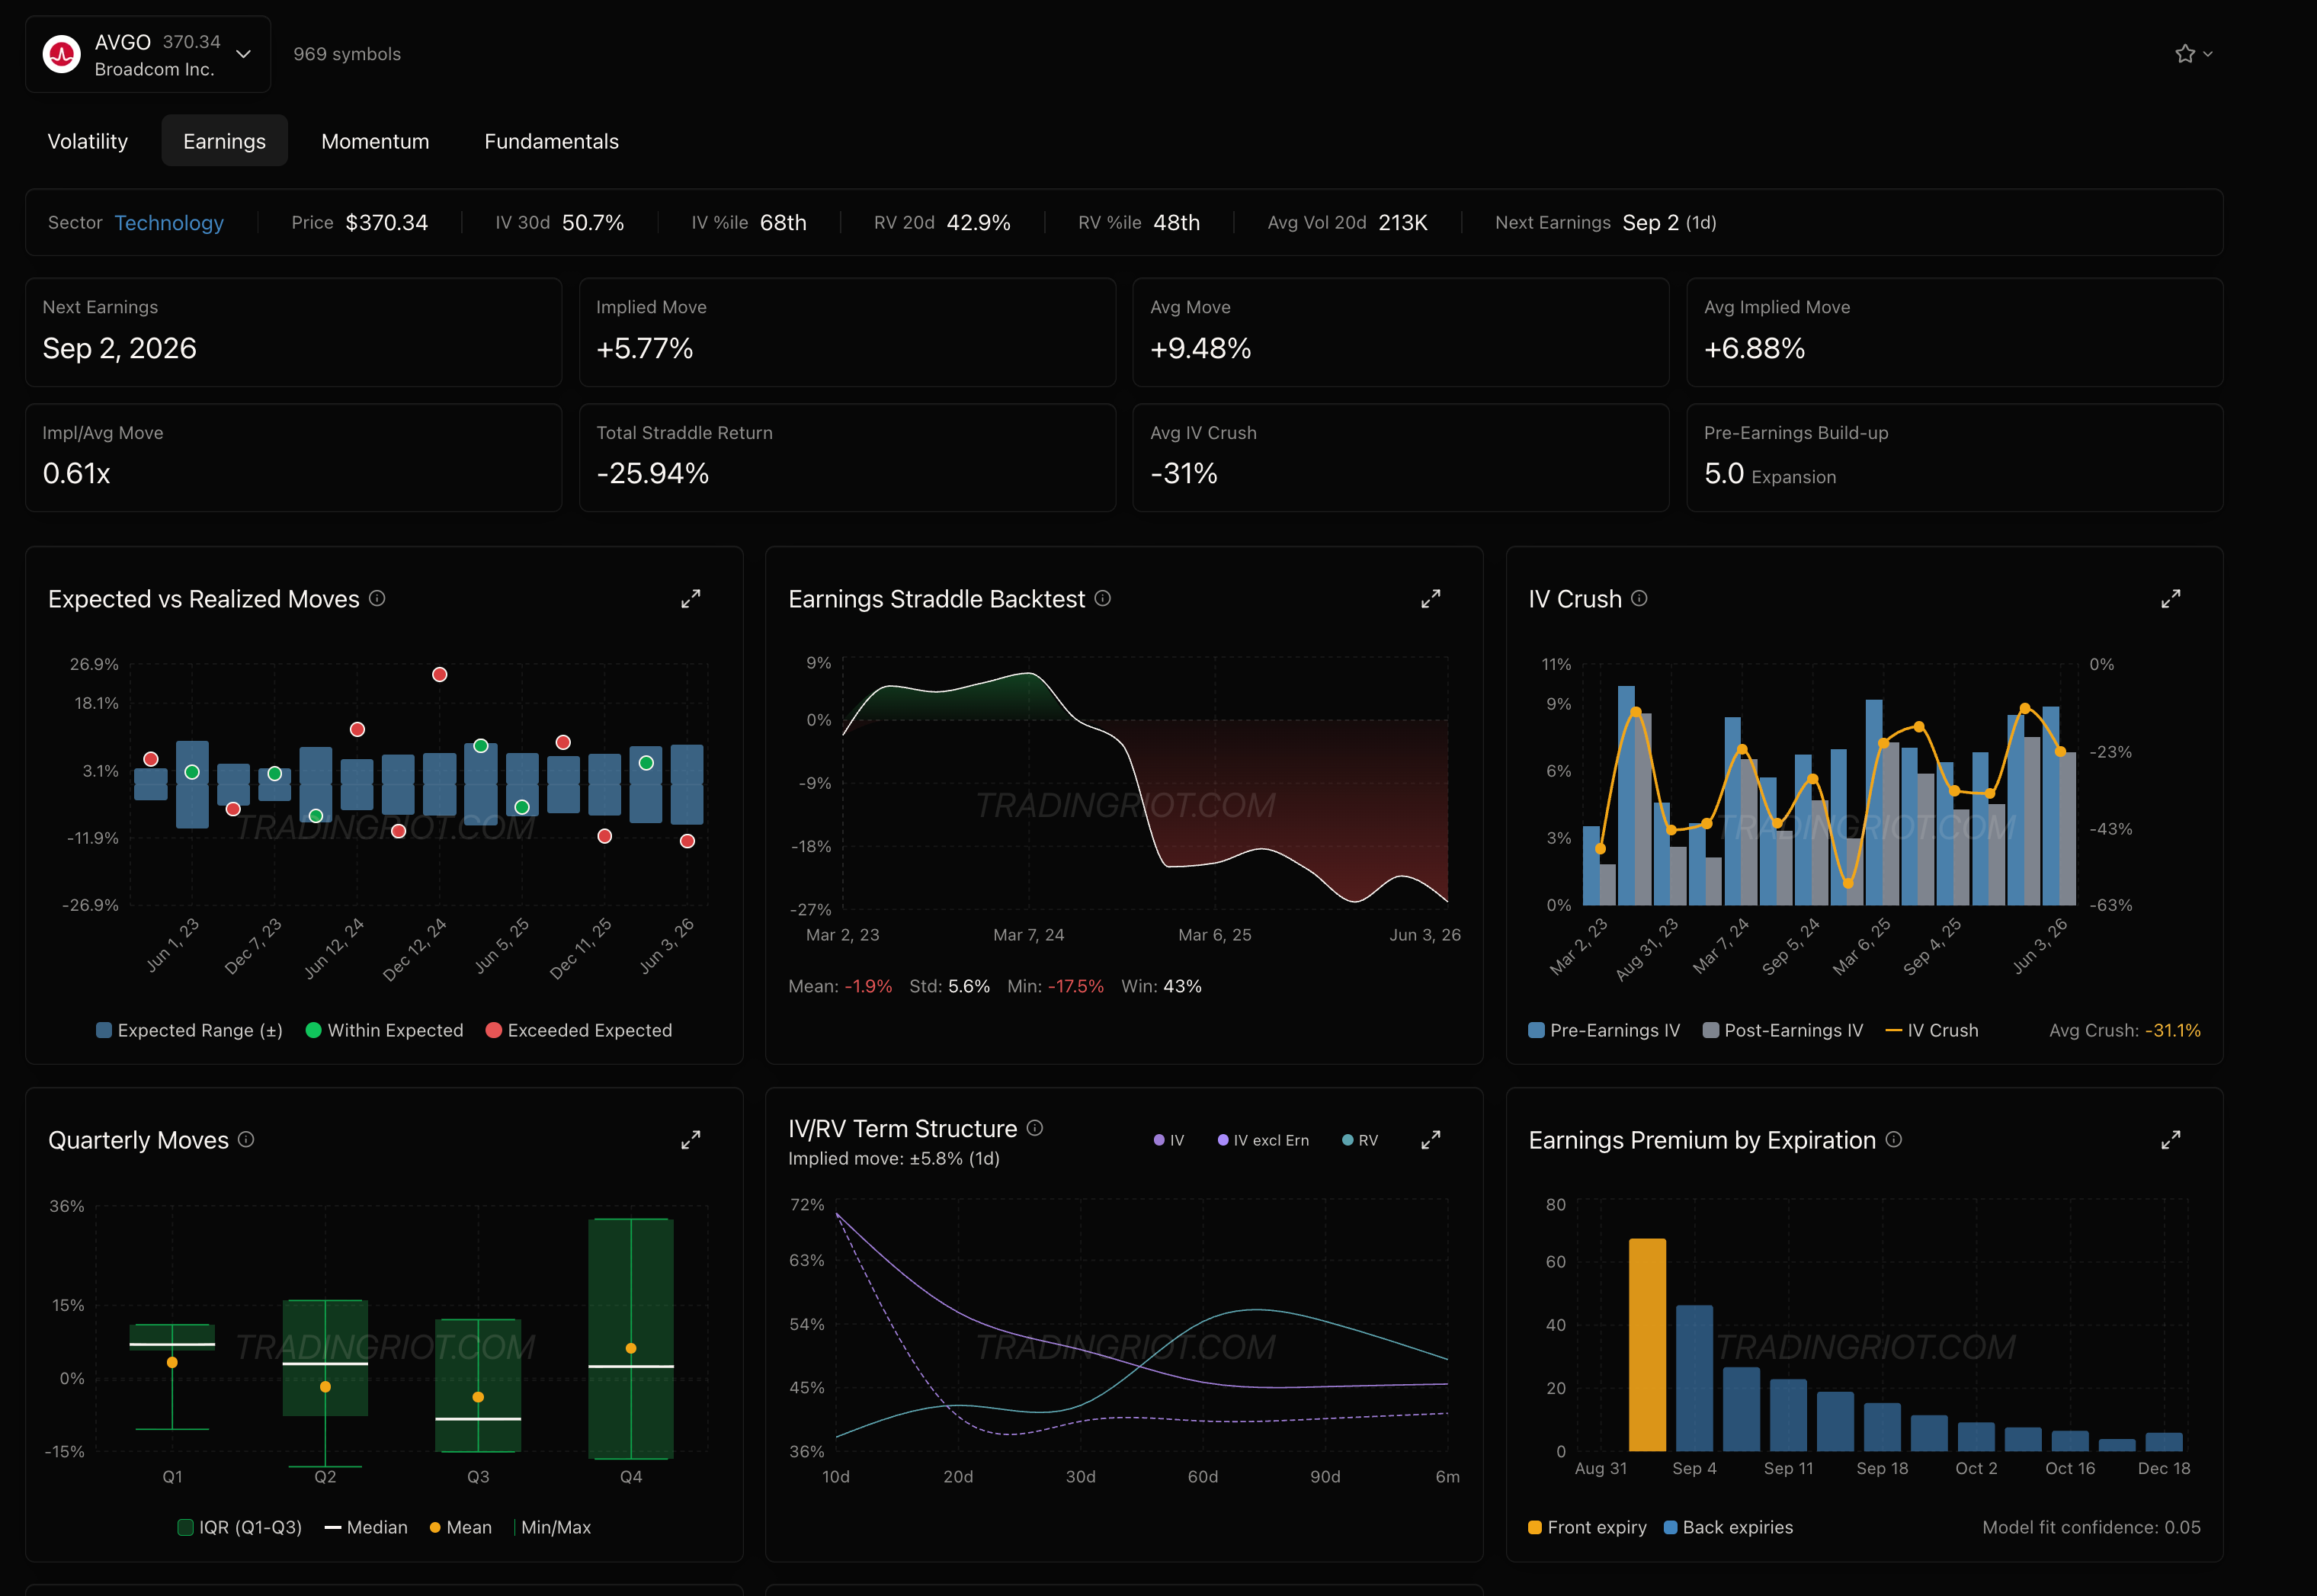
Broadcom reports Wednesday after the close, pricing 5.77% against a twelve-quarter average delivered move of 9.48%, a ratio of 0.61. GameStop on the 8th prices 5.04% against 9.73%, a ratio of 0.52. All three liquid names with earnings inside a week price the event below their own history.
Futures
The futures board has split cleanly into equity index at the floor and agriculture at the ceiling. Four of the ten cheapest surfaces are the four index contracts: Russell at the 3rd percentile of its year, ES at the 8th, Dow and Nasdaq both at the 9th. The top of the board is entirely ags and softs, cotton at the 100th, sugar at the 99th and wheat at the 98th.
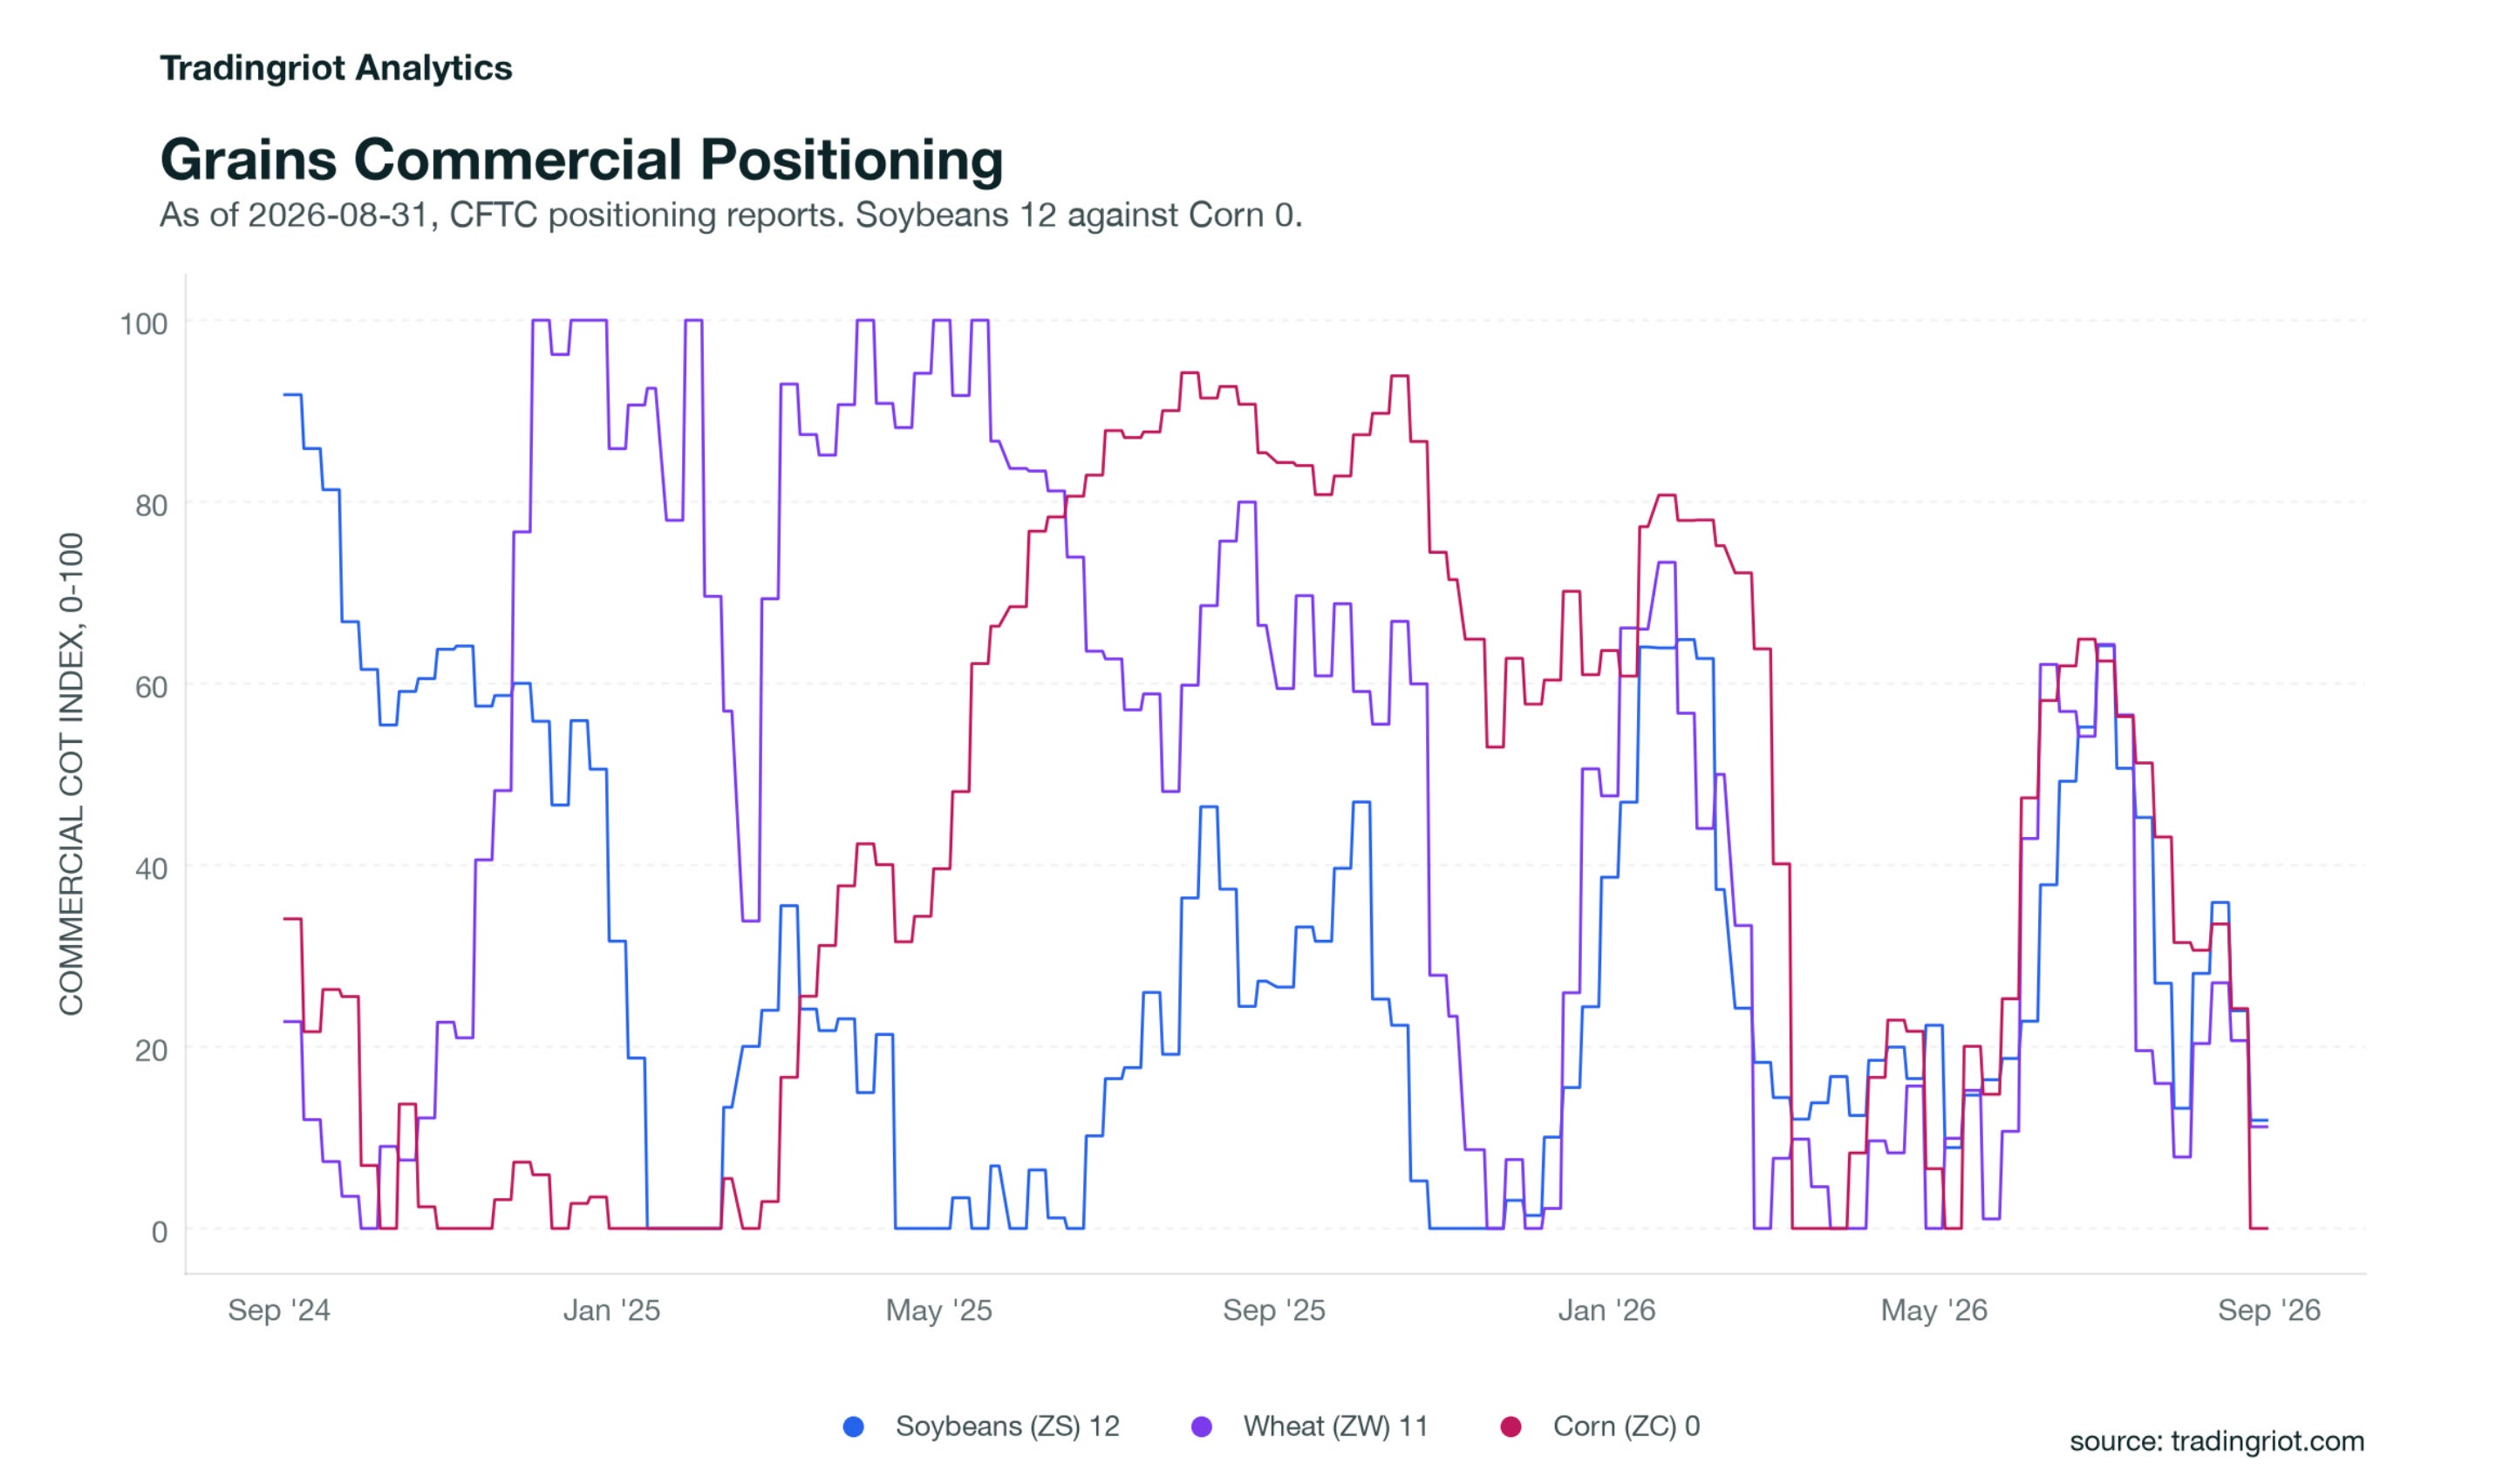
The grain complex moved as one thing. Wheat added 10.65% on the week, corn 9.41%, KC wheat 9.22%, bean oil 5.66%, beans 5.21% and meal 5.08%. Commercial positioning is now at the floor across the whole group, corn and KC wheat both 0 on their 52-week index, wheat 11, beans 12, meal 17 and bean oil 28, against 55 to 65 in July. Large speculators are the exact mirror at 100, 100, 92, 88, 83 and 71. The curves flattened to the bottom of their own ranges at the same time, corn in 2.72% contango at the 0.4th percentile of 252 sessions and wheat at 4.00% at the 0.8th, which is the front rallying hardest. Implied vol, positioning and curve shape agree on this complex. It turns from a state into a signal if commercials stop adding while specs take risk off and implied stays bid.
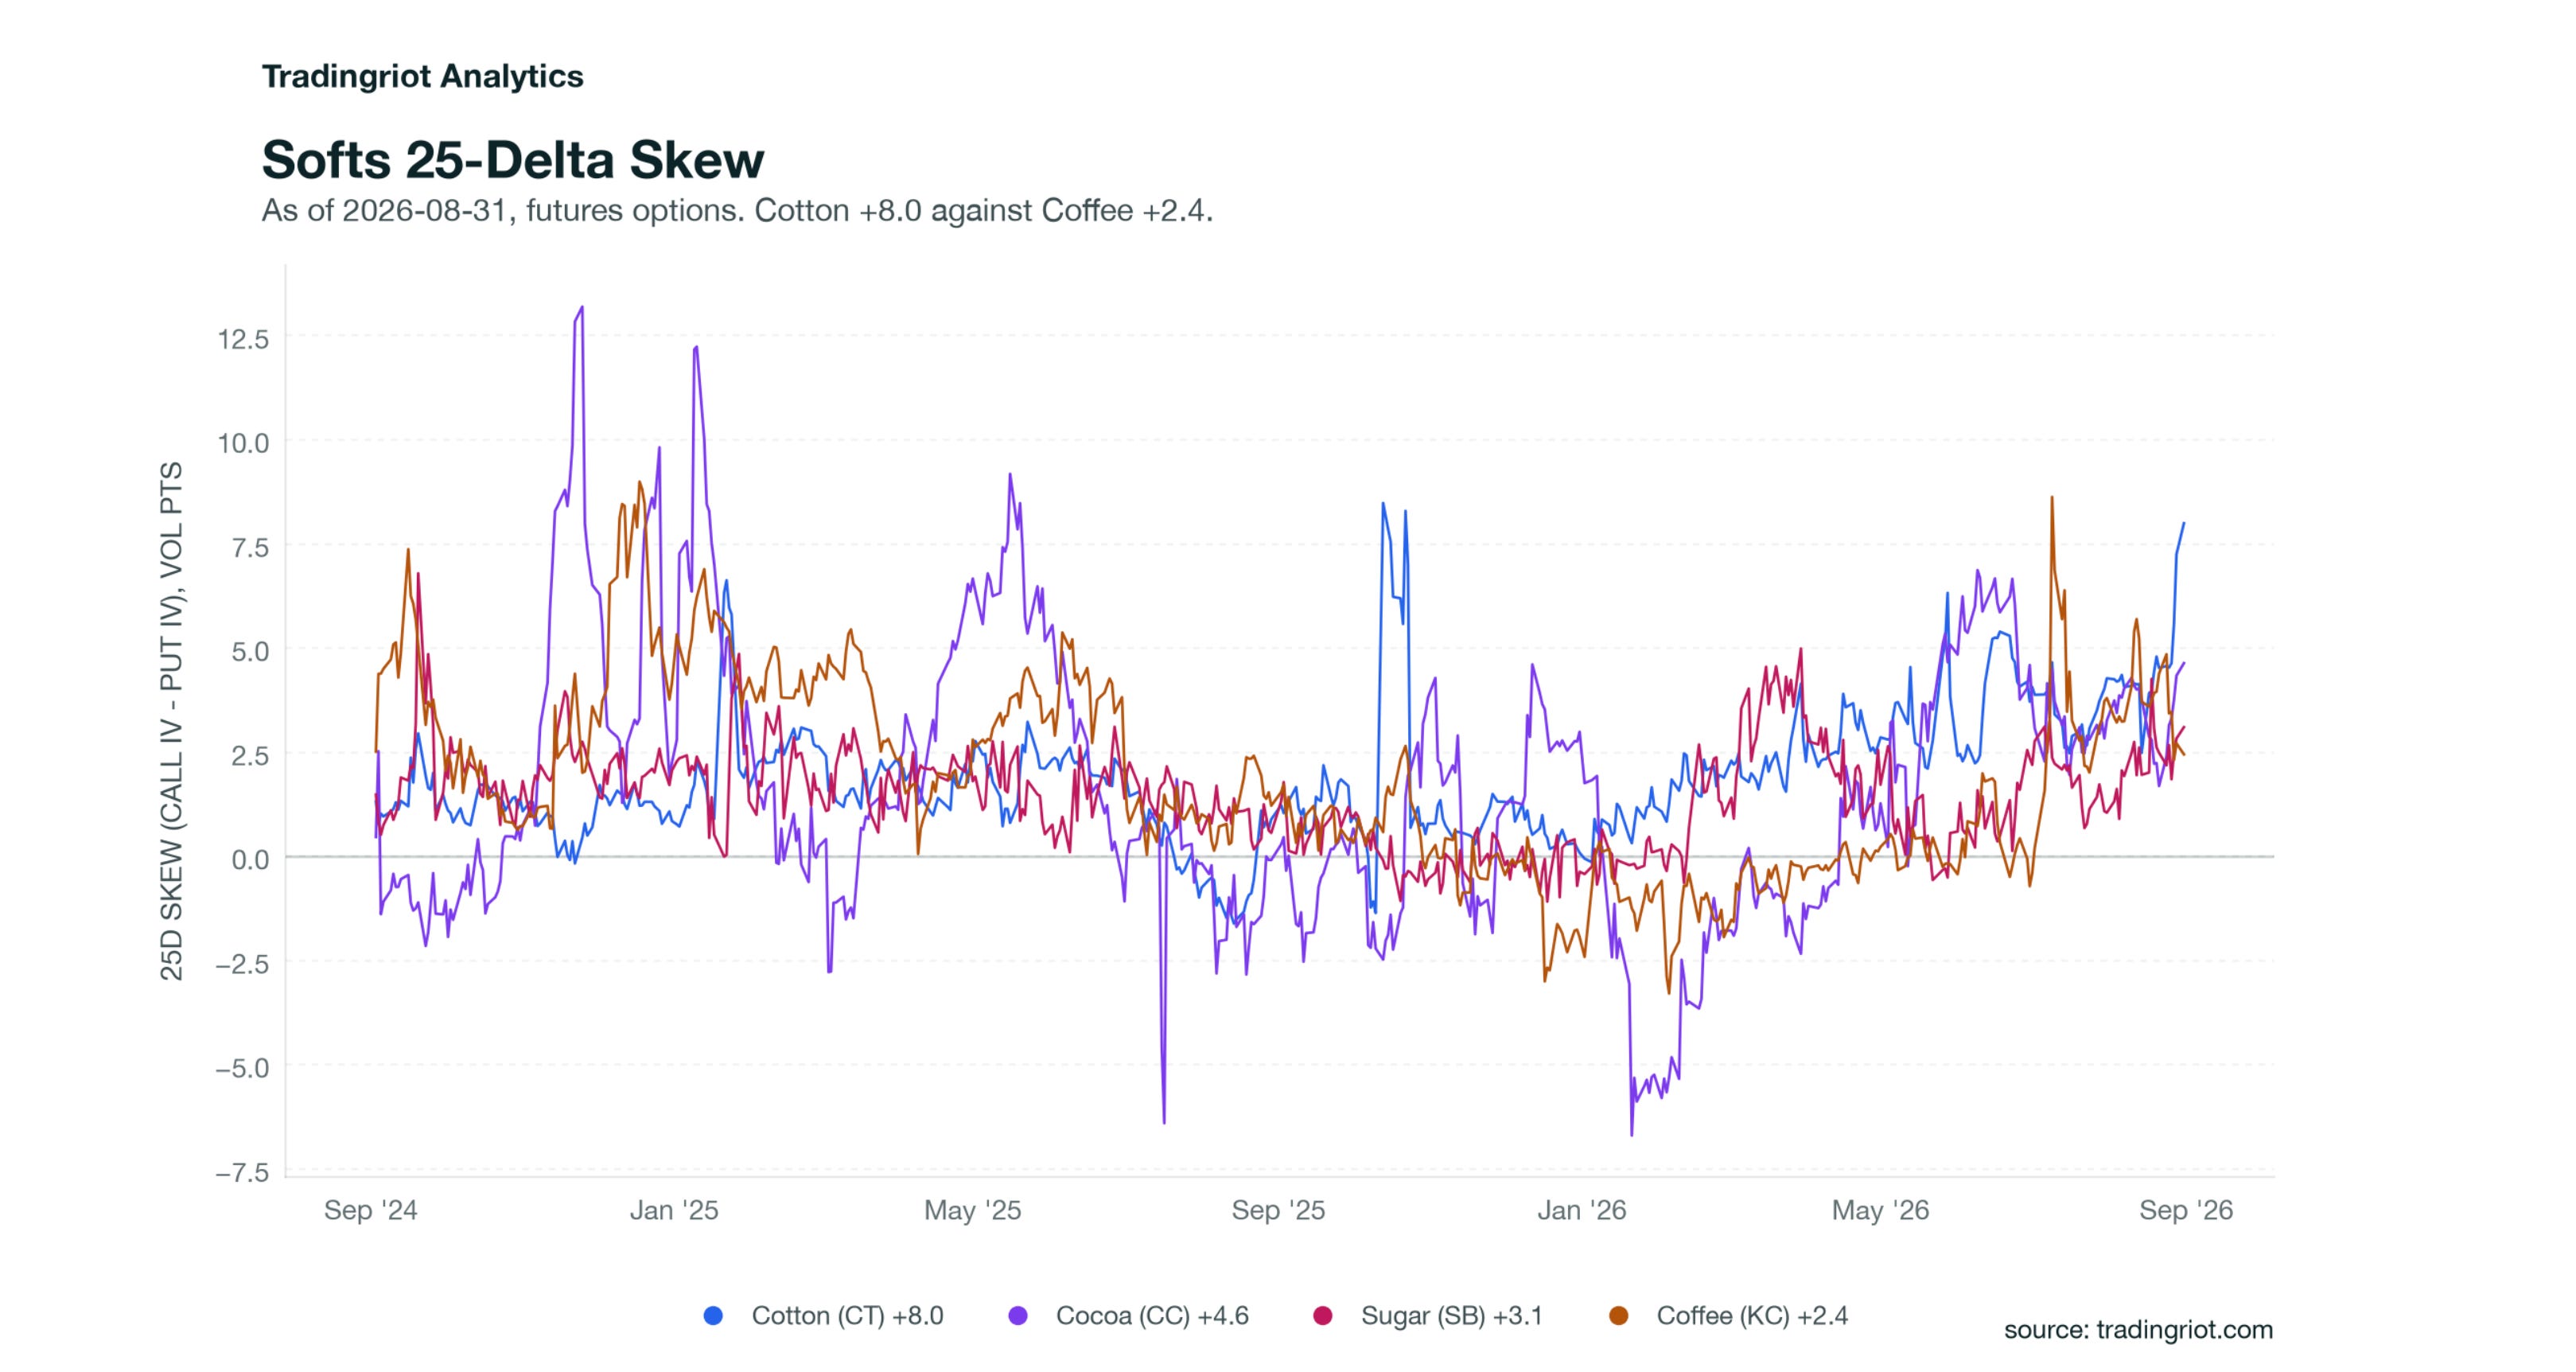
Cotton is the most stretched market on the board. Thirty-day implied at 33.93 against 19.80 realized is 13.68 vol points of premium with a VRP z of +2.26, the only futures market past 2. Its 25-delta skew is +8.00 vol points, the 99th percentile of its year with a z of +3.23, up 3.36 points in five sessions. Commercials sit at 0, large specs at 100. The whole softs complex leans the same way, cocoa at +4.64 and sugar at +3.10.
Last week’s report led on metals skew at yearly highs across copper, gold, silver and platinum. That reversed inside a week. Copper’s 25-delta skew is now +1.95 at the 42nd percentile, down 2.34 points in five sessions. Silver is +3.95 at the 53rd, down 2.10. Platinum is +4.75 at the 39th, down 1.70. Gold held, at +1.36 and the 80th percentile. The upside bid left the complex faster than it arrived, alongside gold down 4.28% and silver down 3.33%.
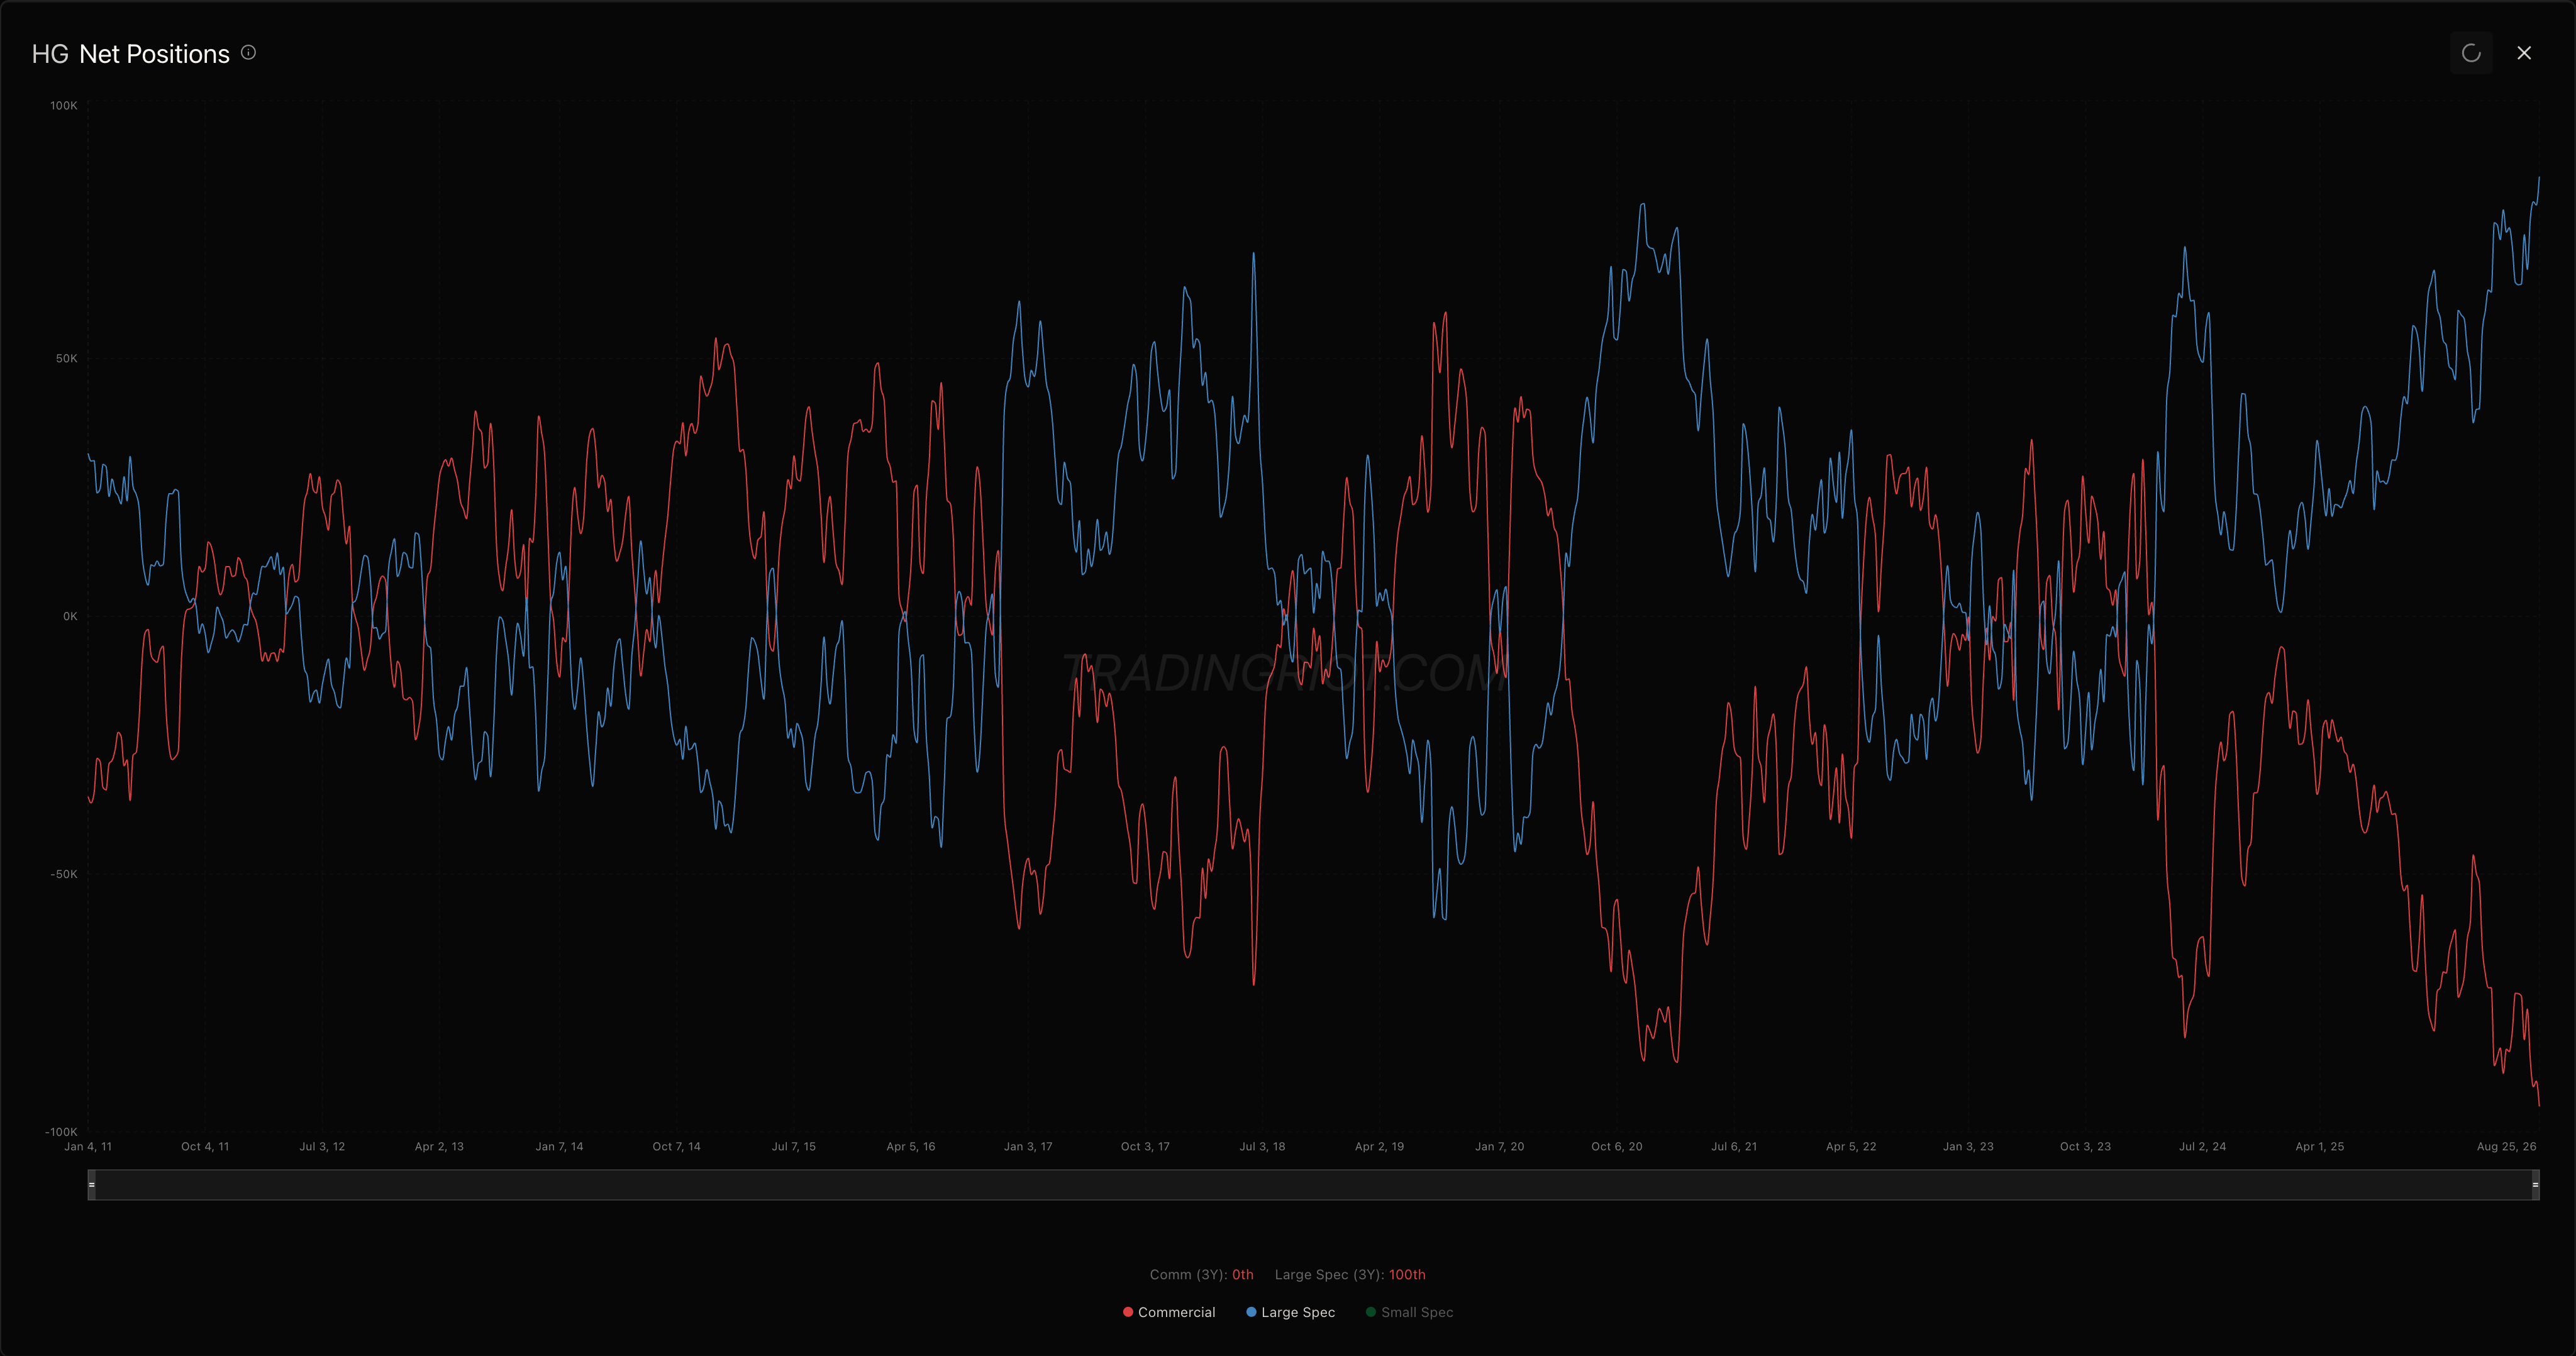
Copper positioning did not move with it: commercials remain at 0 on their 52-week index and large speculators at 100, the split flagged here on the 29th as a record on the full series back to 2011.
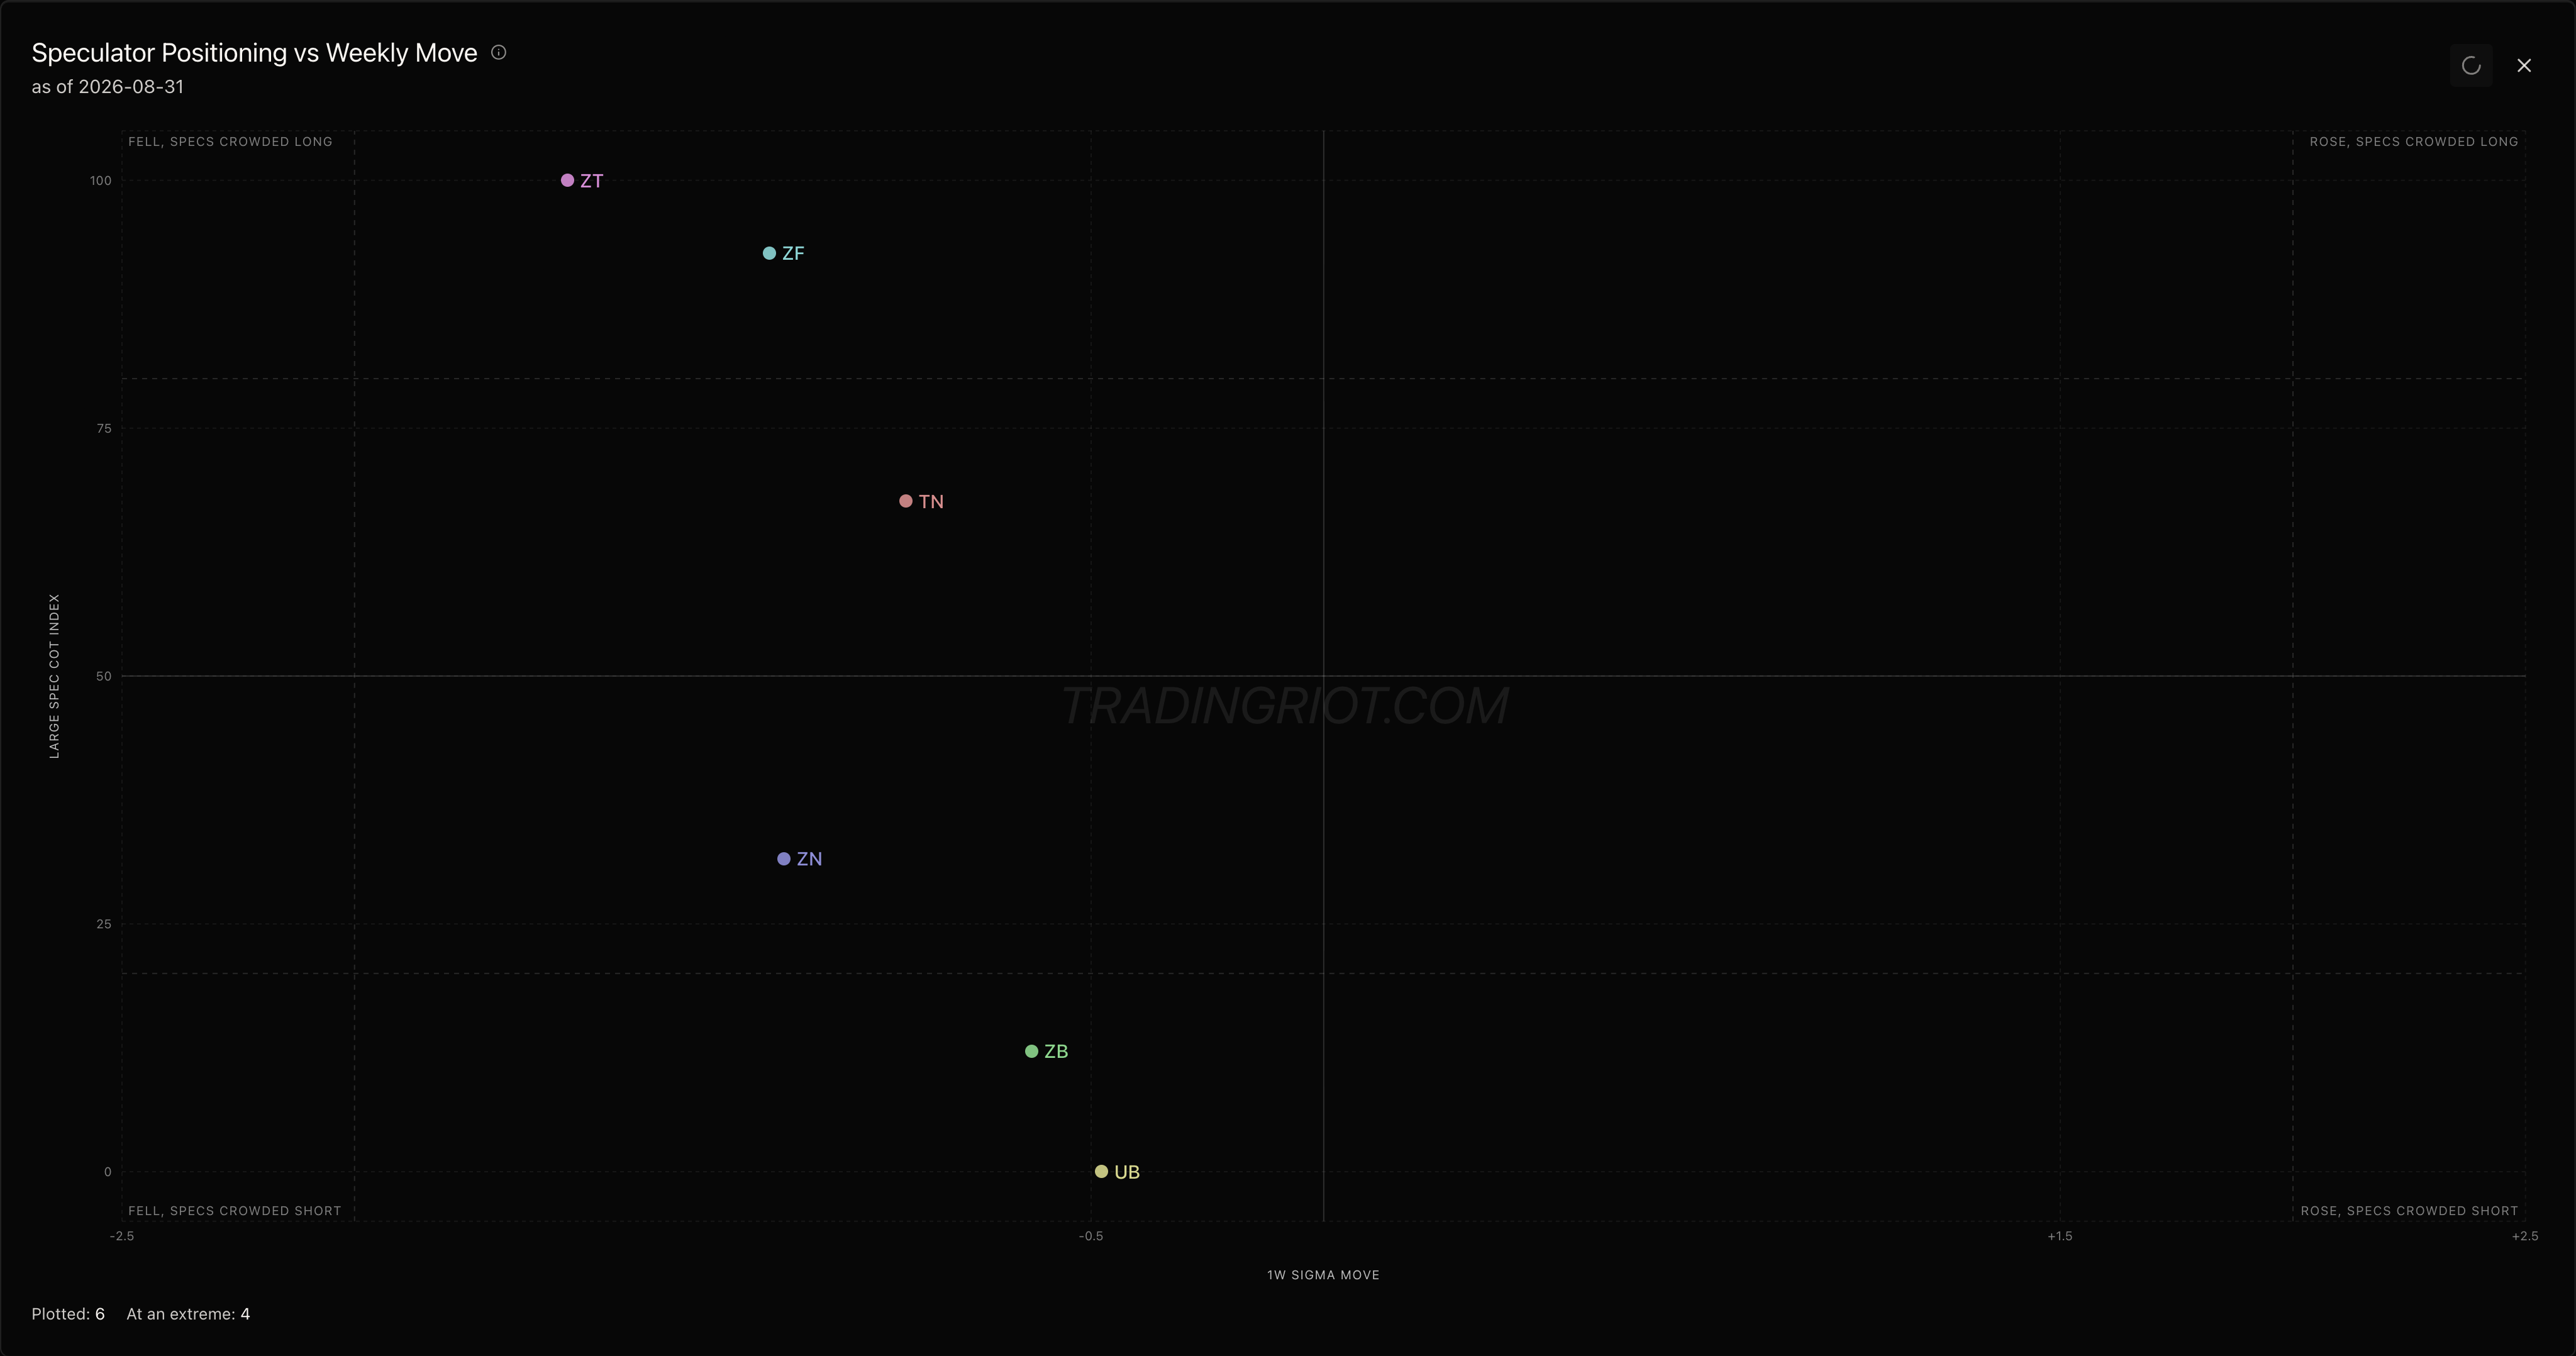
Rates positioning still splits by the curve, though the belly moved. Ultra bond commercials sit at 100 against specs at 0, the 30-year at 79, the 10-year at 56 after commercials shed 27.9 points in a week, the 5-year at 0.8 and the 2-year at 0. The reading is that 100-point spread inside one category; the category mean of 47 says nothing.
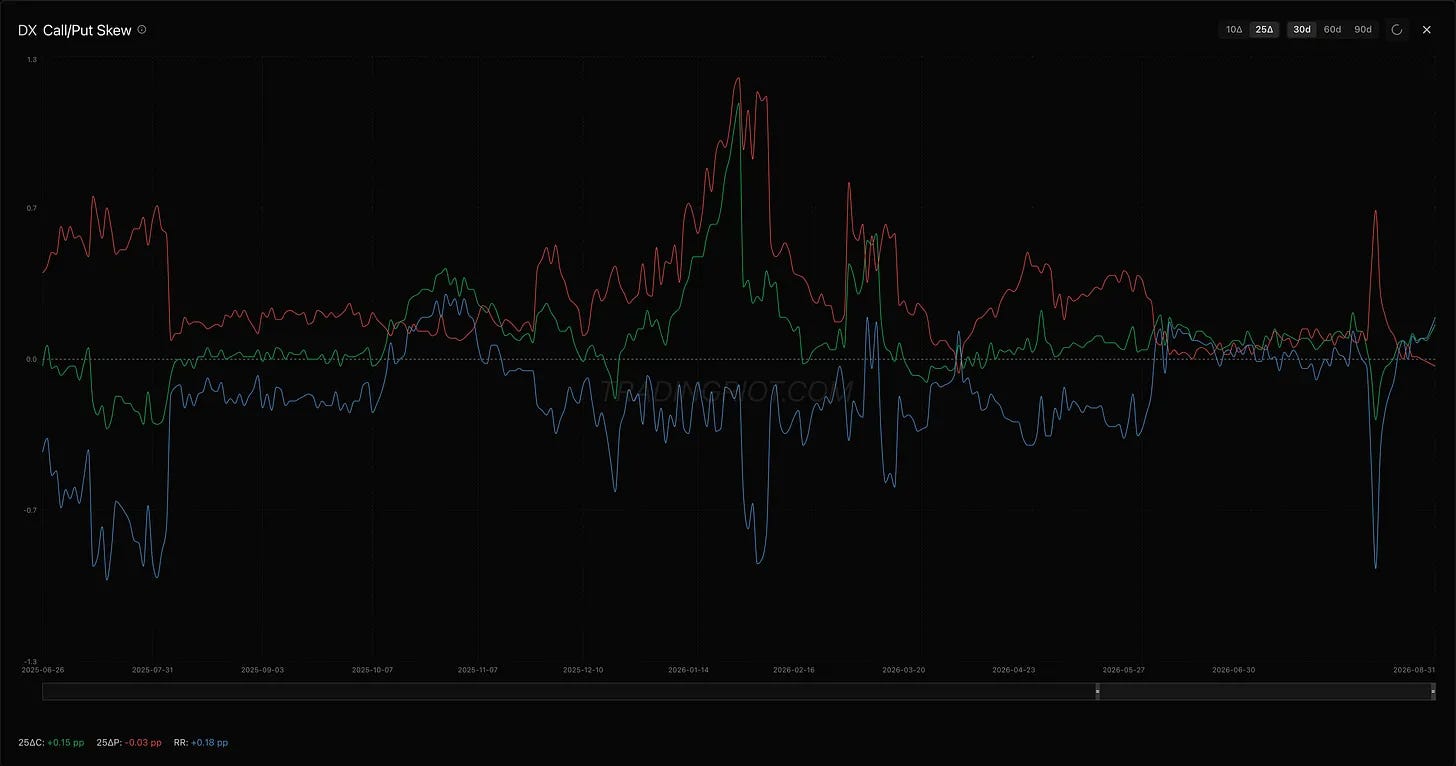
In FX, dollar skew sits at the 95th percentile of its year with a z of +1.58 while dollar implied sits at the 18th, so calls are bid on a surface nobody is paying up for in aggregate, with commercials at 11.8 and specs near maximum long. The largest positioning shift on the board was the kiwi, where large specs added 32 points of their 52-week index in a week to 86.8, ahead of the RBNZ decision on Wednesday.
Crypto
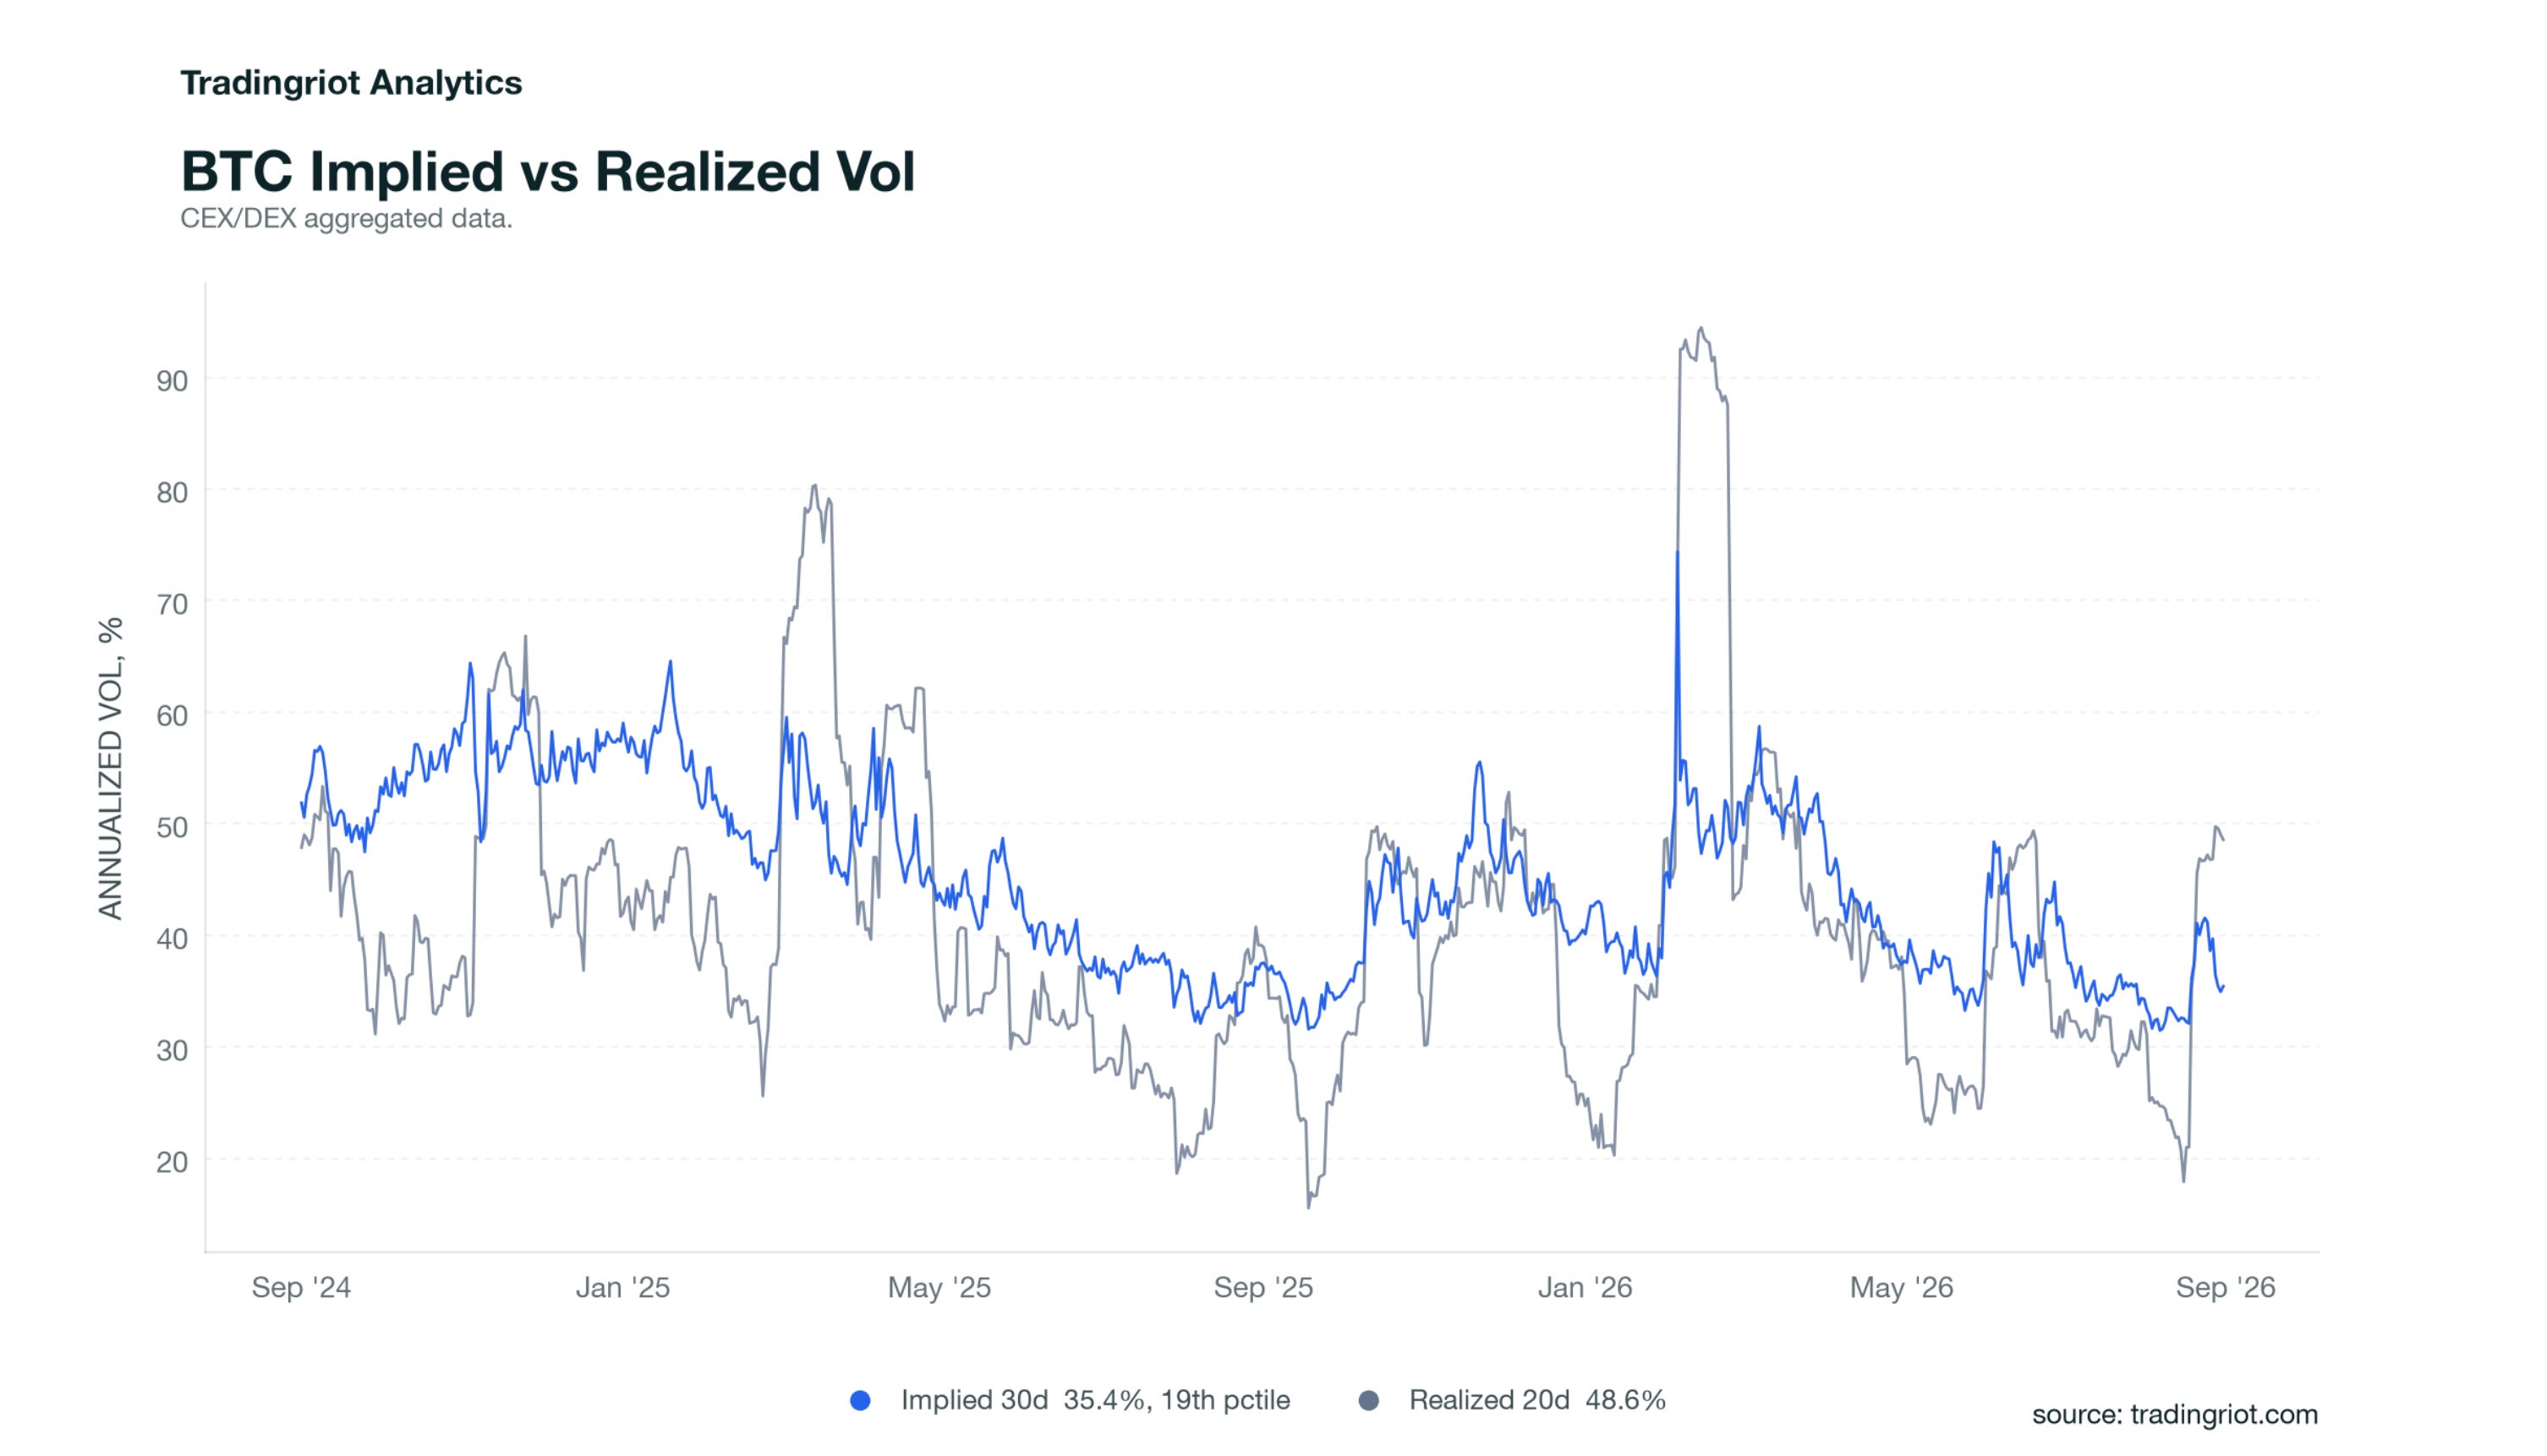
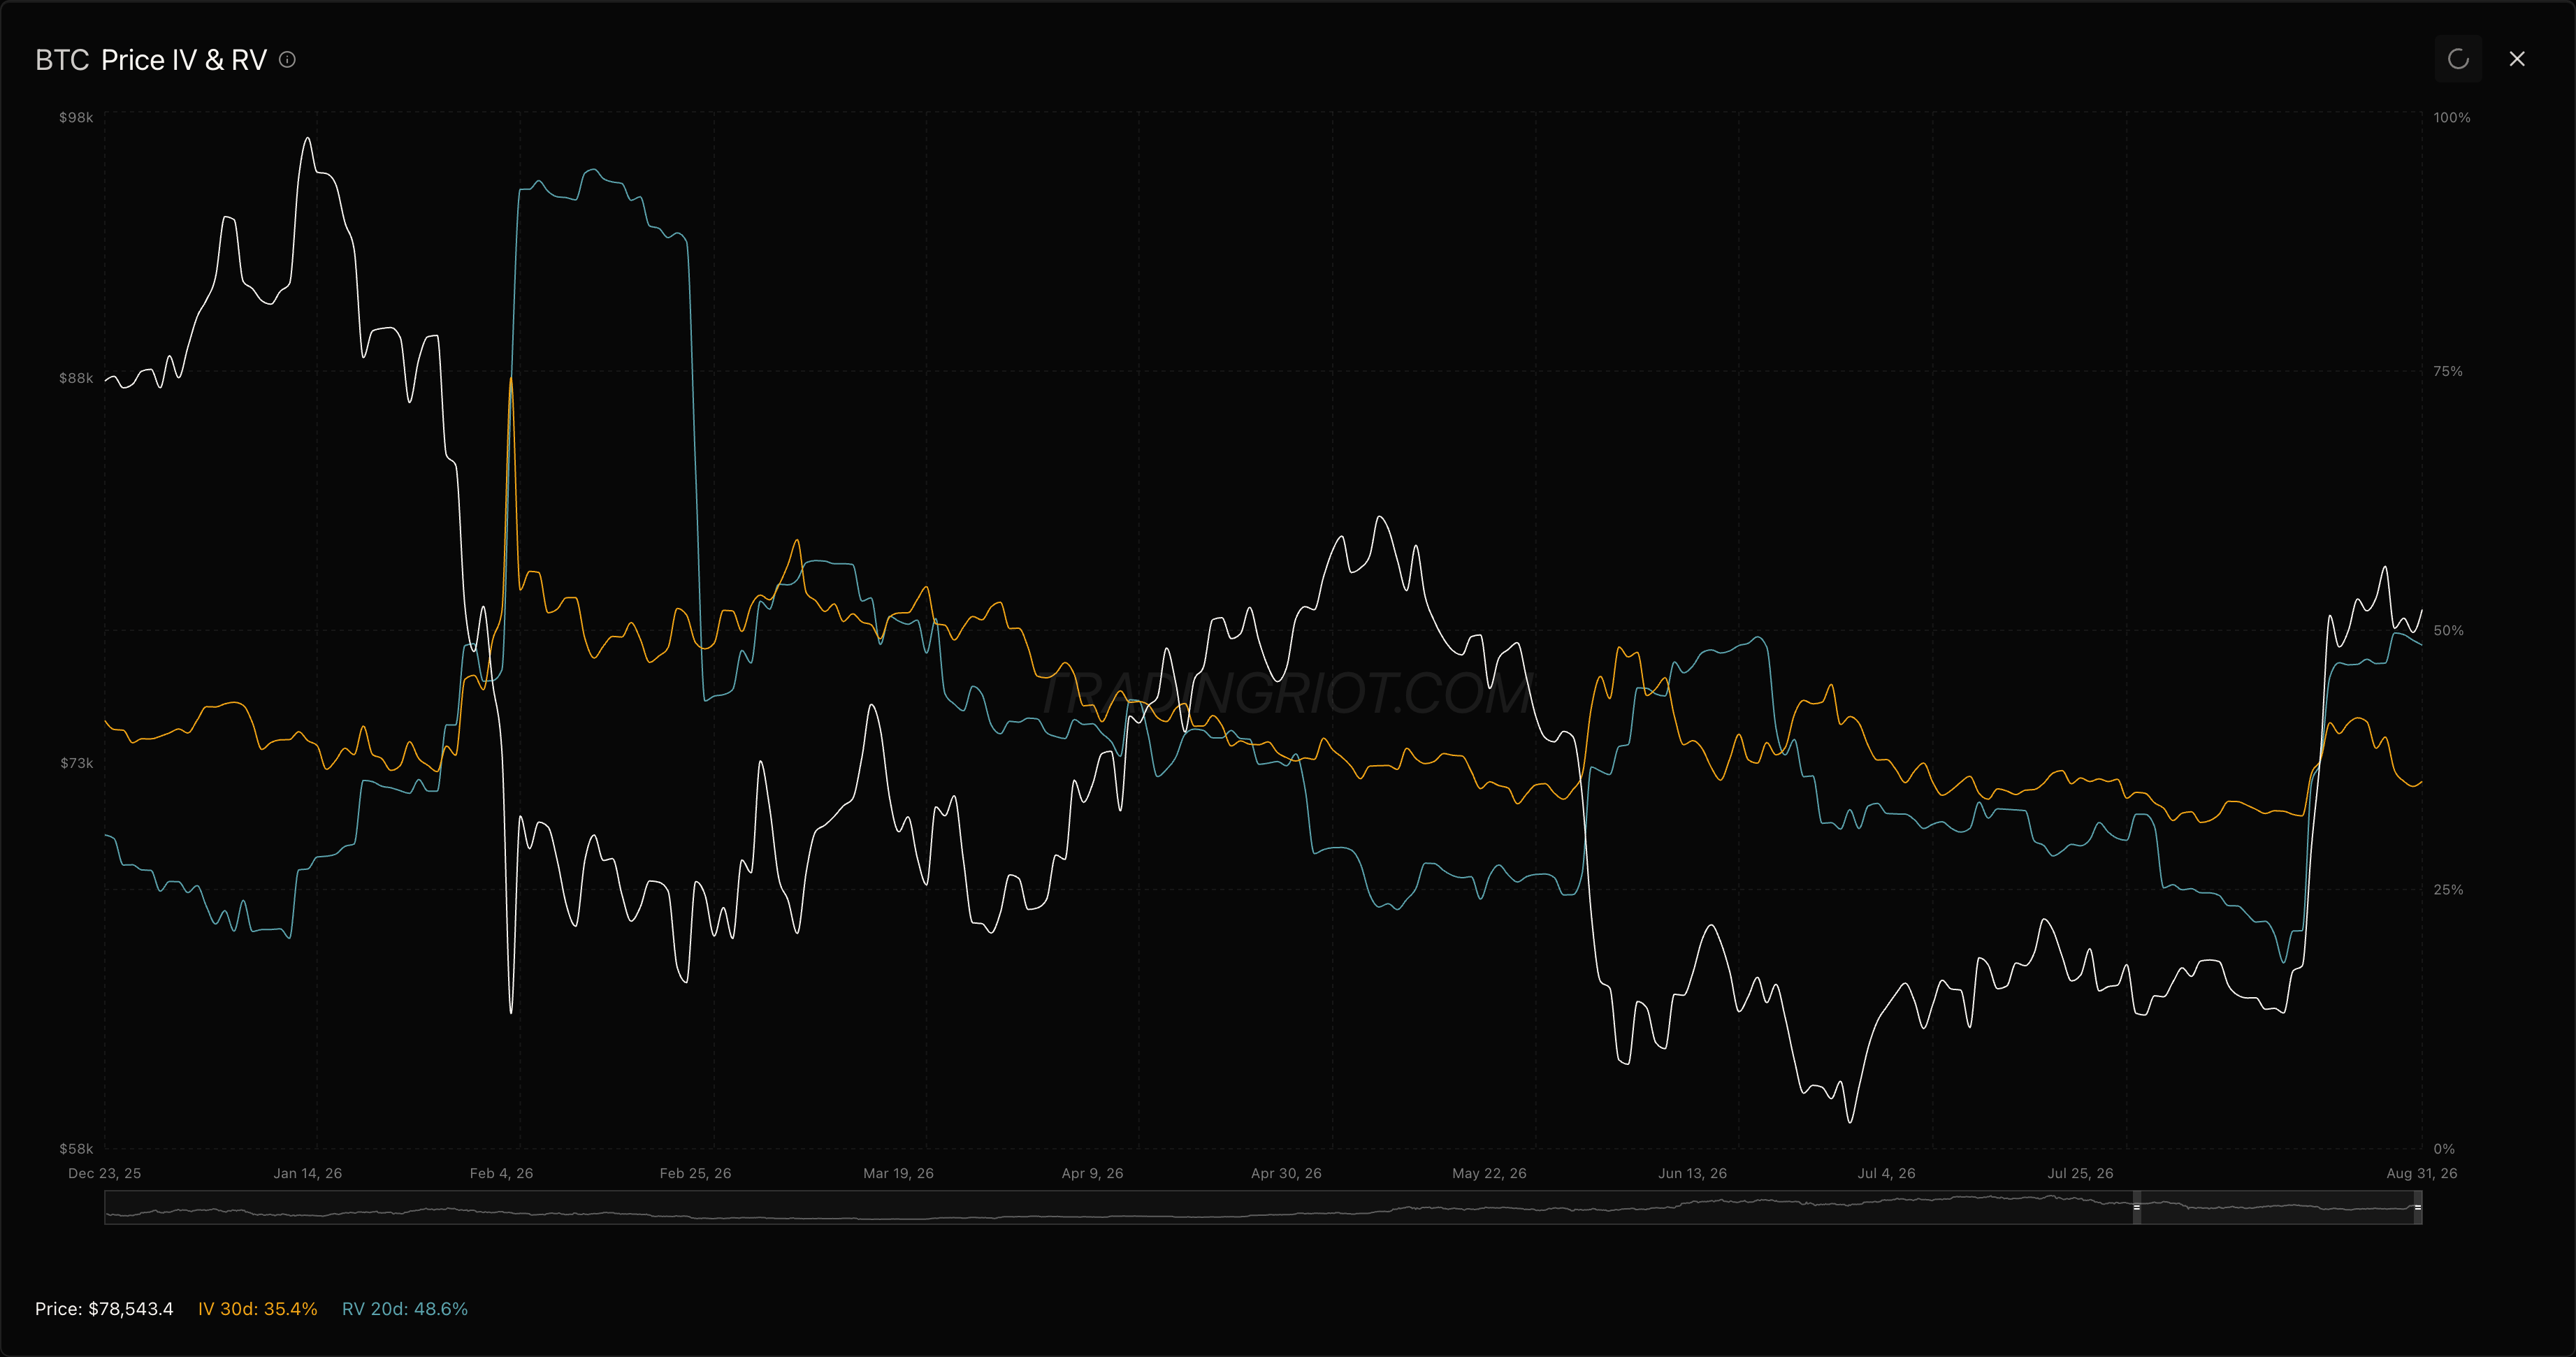
Bitcoin closed the week at $78,543, down 0.5%, and Ethereum at $2,466, down 0.6%, after monthly gains of 22.9% and 31.8%. The tape stopped and the options market repriced hard. Bitcoin 30-day implied fell from 41.56 to 35.43, the 19th percentile of its year, and Ethereum from 56.07 to 49.30, the 20th.
Realized fell further and faster. Bitcoin’s seven-day realized went 60.99 to 27.46 and Ethereum’s went 114.96 to 35.61. The twenty-day windows still carry the rally, 48.56 for Bitcoin at the 81st percentile and 79.05 for Ethereum at the 90th, which is why the headline VRP reads -13.13 and -29.75, both under the 10th percentile of their own years. Measured on the week that actually happened, the front is paying again: Bitcoin’s seven-day implied is 35.67 against 27.46 realized.
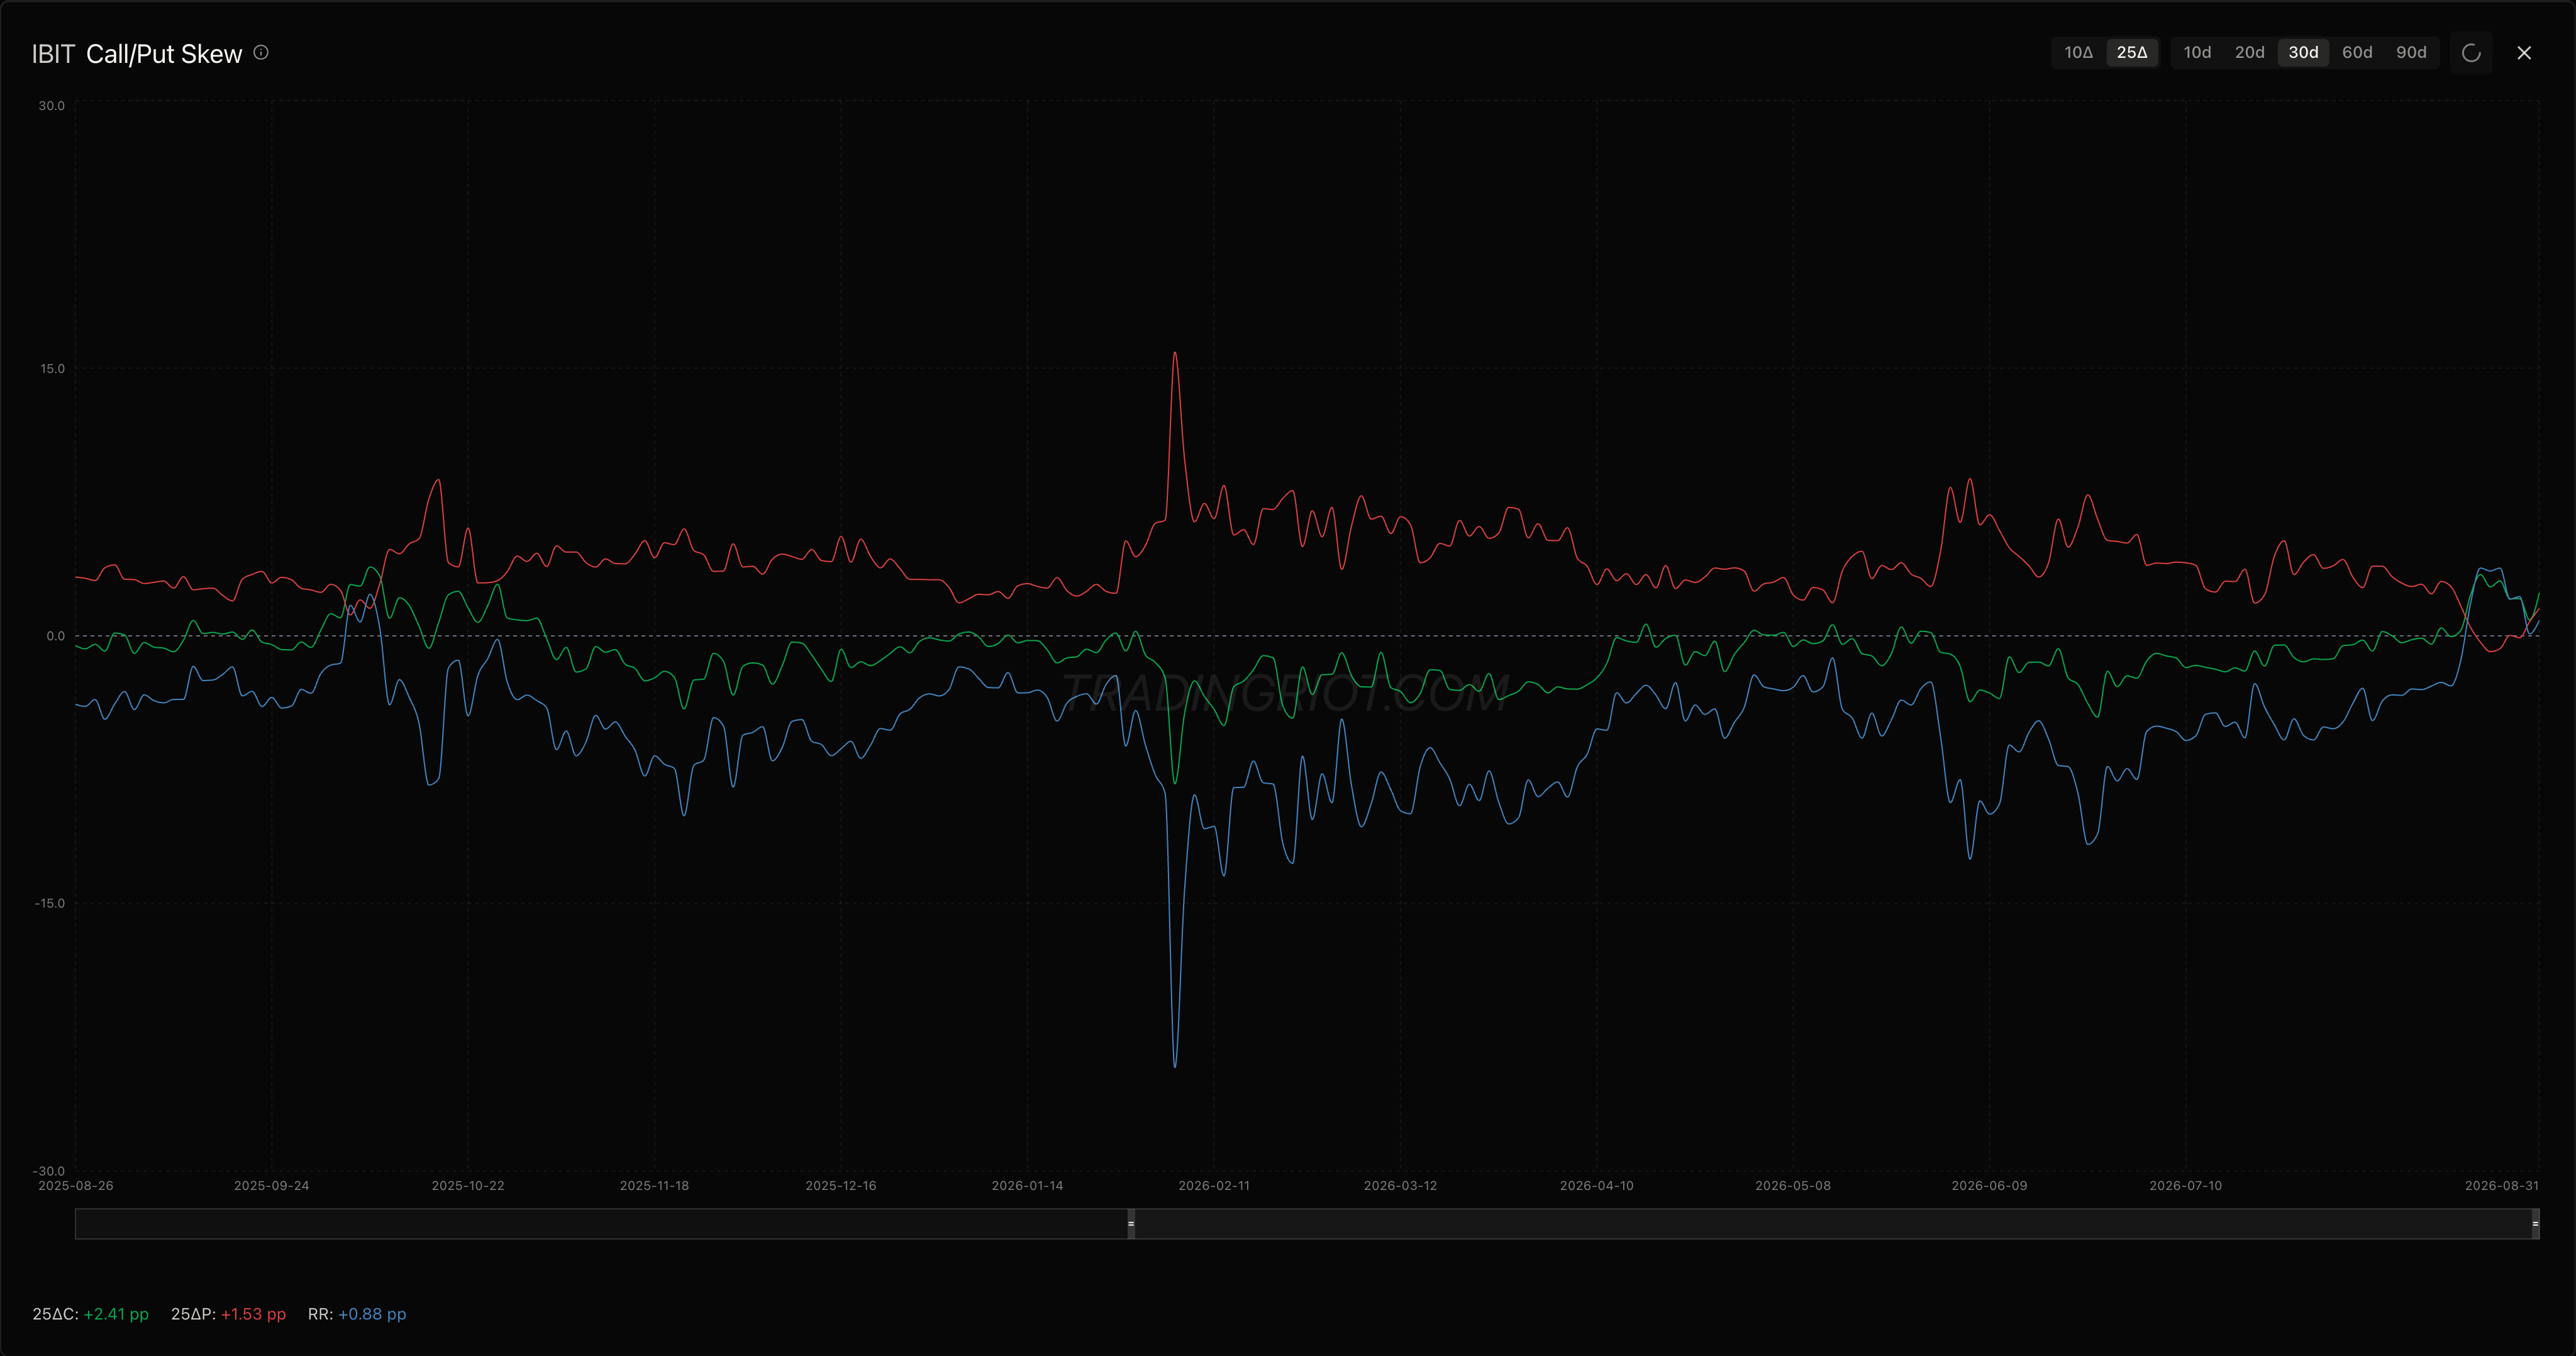
The call bid did not hold. Bitcoin 30-day skew printed +5.90 on the 27th, the 99th percentile of its year, then -5.06, -4.09, -4.27, and +0.74 on Monday. It crossed zero three times in five sessions. It still ranks at the 97th percentile because Bitcoin skew is normally put-bid, which is why a single print of it is worth nothing.
Six of the eight largest perps sit above a +2 open interest z-score: Zcash at +2.52 on $1.15bn and the 99th percentile of its own history, Bitcoin at +2.49 on $20.77bn, Solana at +2.33 on $2.51bn after adding 10.2% of book in a week, Hyperliquid at +2.14 on $2.70bn, PUMP at +2.10 and Ethereum at +2.01 on $12.19bn.
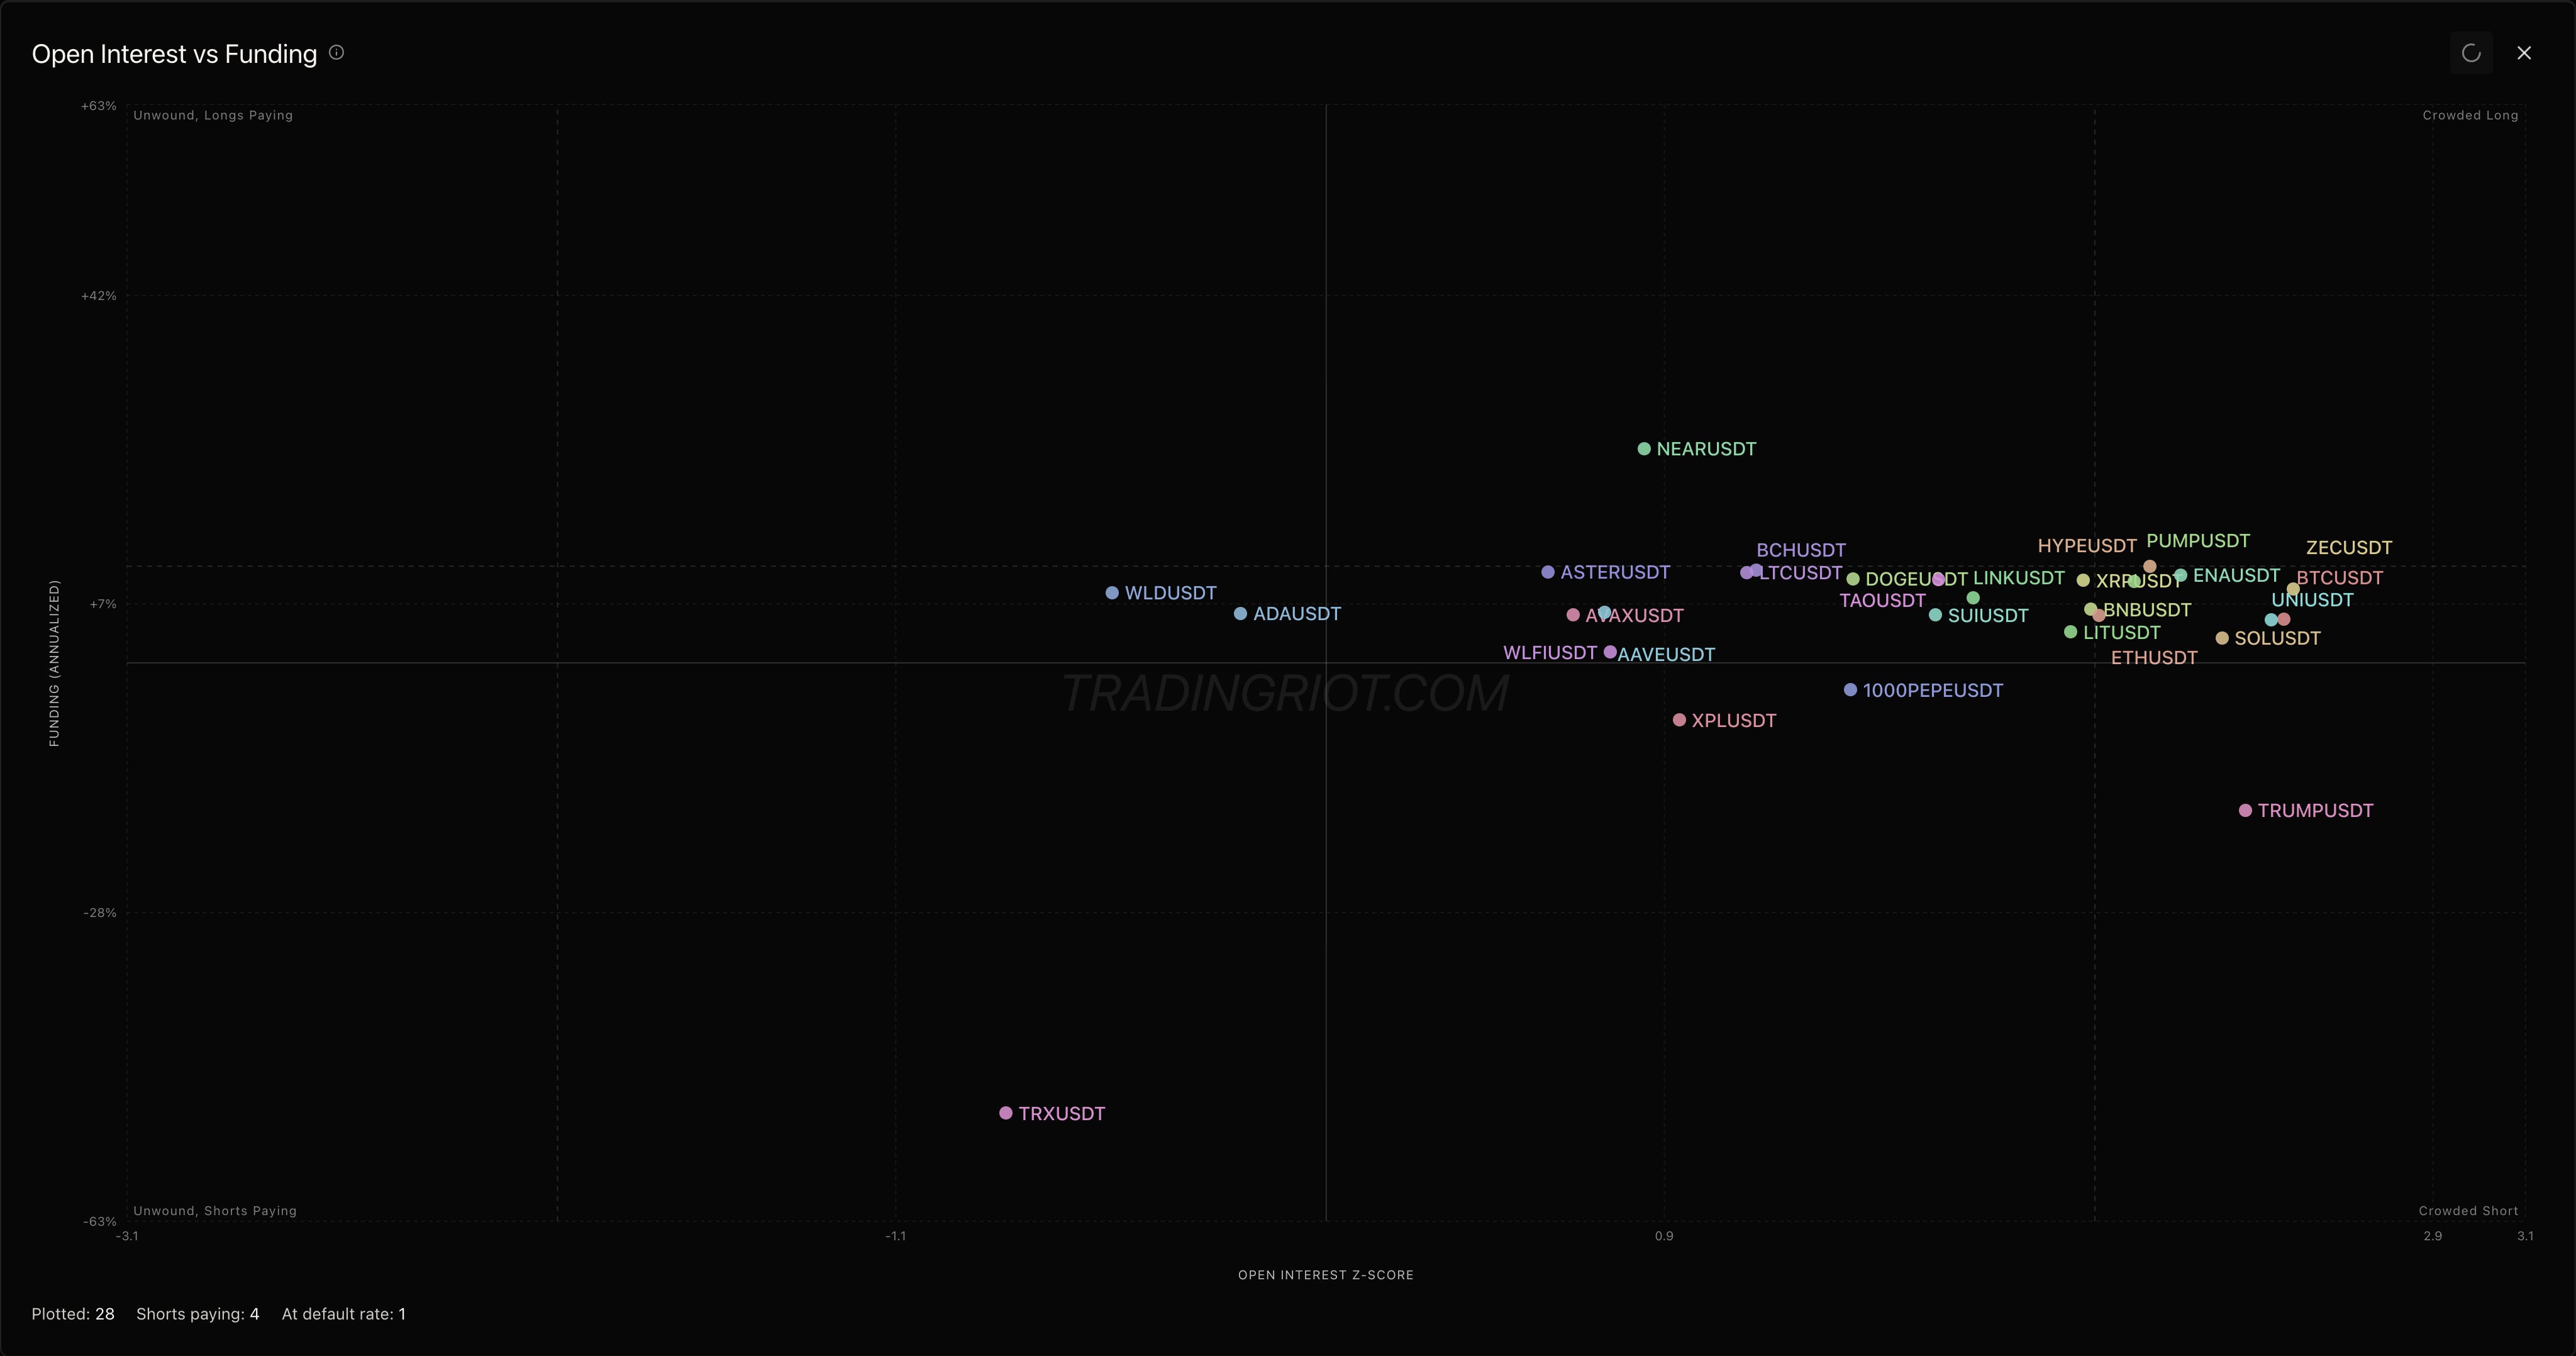
Funding went back to normal underneath it. Bitcoin pays 4.95% annualized with a z of +0.01, its own average to two decimal places, and Ethereum 5.36% at +0.38. One perp above $150m of open interest carries funding past two standard deviations, NEAR at 24.31%, and nothing above $100m printed a liquidation z above 2 all week. Leverage stayed on, the cost of carrying it normalized, and nobody got run.
The alt leverage flagged here last week did unwind. XRP shed 11.8% of open interest with price down 6.9% and Dogecoin 13.5% with price down 8.1%. TRUMP went from the board’s crowded long to its crowded short, funding now -16.73% annualized.