Welcome to another weekly market digest, quick note before we delve in, all the analytics are from Tradingriot.com, you can sign up and get deep historical data for equities, commodities, rates, FX & digital assets which are distilled into daily signals and actionable strategies.
The dollar dropped to a three-month low, gold closed at three-month highs, equities took a fairly modest hit that landed almost entirely on semiconductors, Bitcoin and crypto in general put a massive rally across the board. The volatility bid actually showed up was on the upside of the markets that rallied than on the downside of the one fell.
Macro
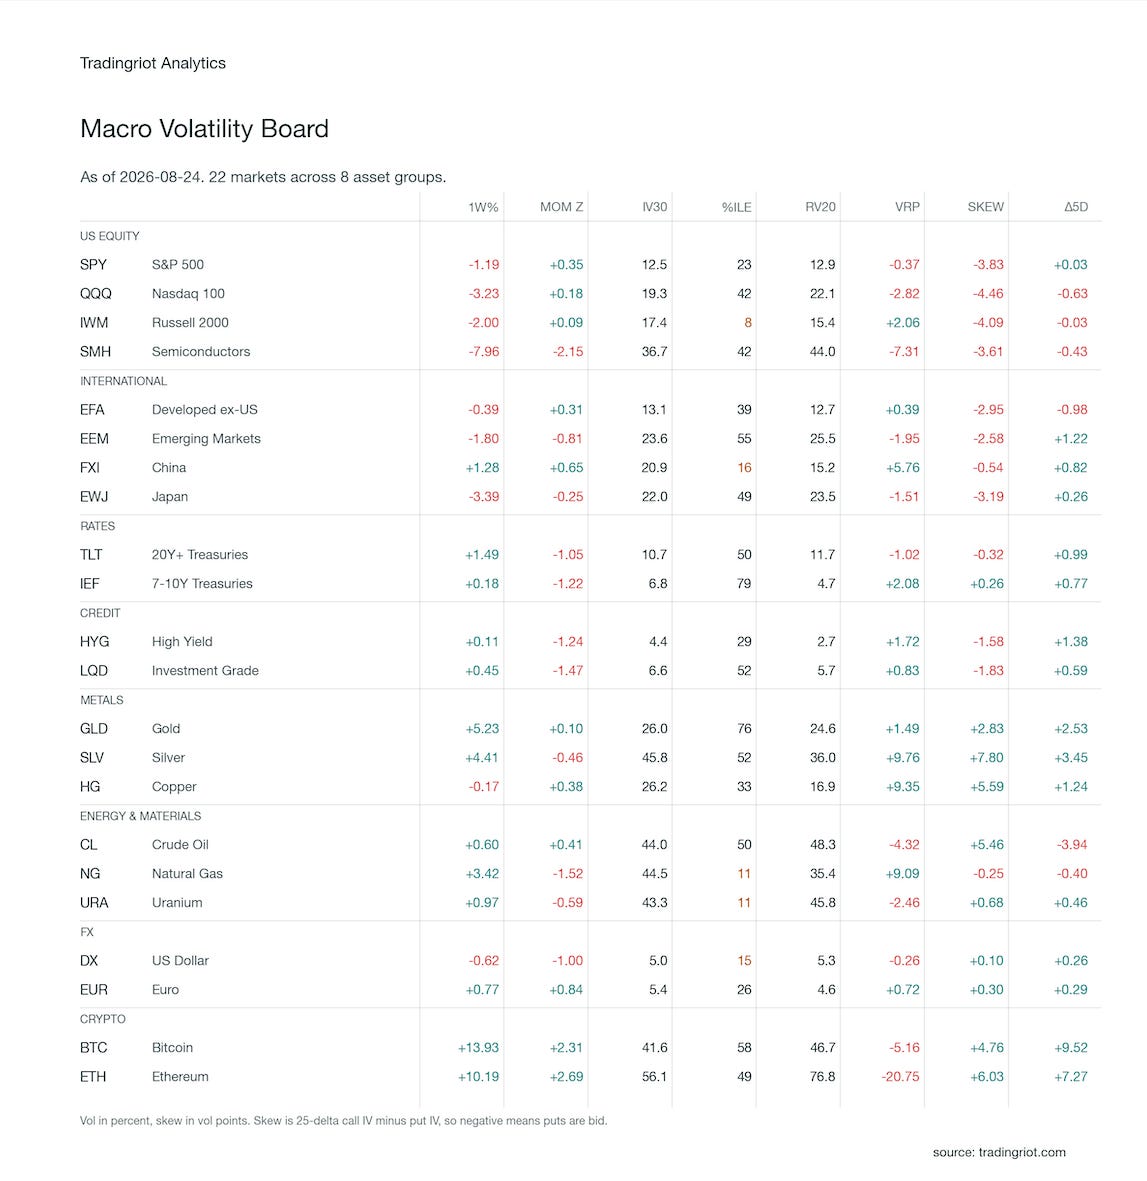
Gold and Bitcoin made up the two biggest changes in implied vol this week. GLD 30-day implied went from the 31st percentile of its year a week earlier to the 76th today - an increase of almost five vol points in six sessions. Bitcoin did the same. Starting out the period at the 1st percentile of its year (as low as IBIT implied ever goes), it managed a 65th by Tuesday last week. With a story of fiscal and not cyclical nature to gold and Bitcoin this week, it stands to reason that option premiums needed to catch up.
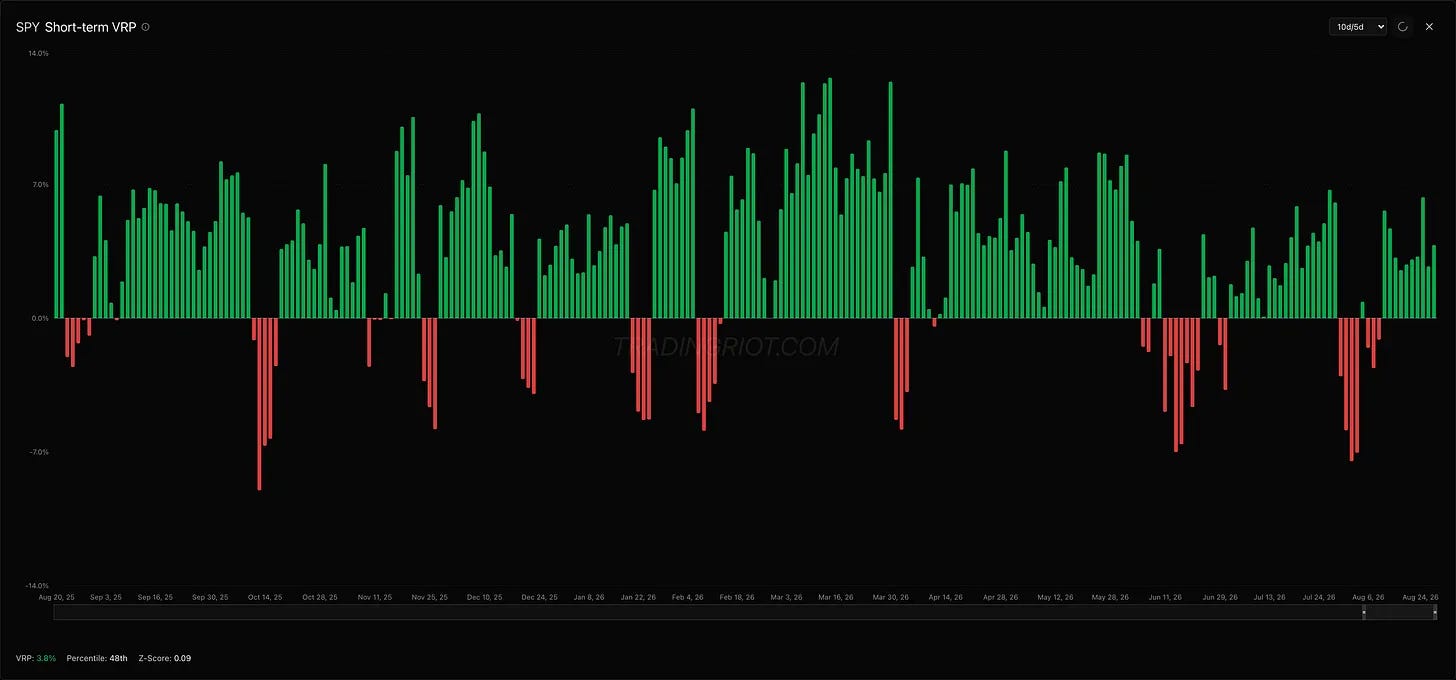
Even though crypto has captured most of the attention in a while, it is actually metals that have had the highest VRP gaps: silver with 45.8 implied against 36.0 realized and copper at 26.2 against 16.9 (Copper is up 9.35, the largest VRP change we have seen). Meanwhile ETH, Bitcoin and semiconductors have followed the opposite trend; Negative VRP implying higher realized volatility than the markets expectation.
Equities
The index gave up 1.19% and semiconductors gave up 7.96%, which tells you the whole selloff was mostly a sector event with QQQ down 3.23%. Front-month implied vol did move, from the 4th percentile of its year on the 14th to the 23rd by Monday. However, vol of vol finished at the 8th percentile after the three-month tenor went the other way.
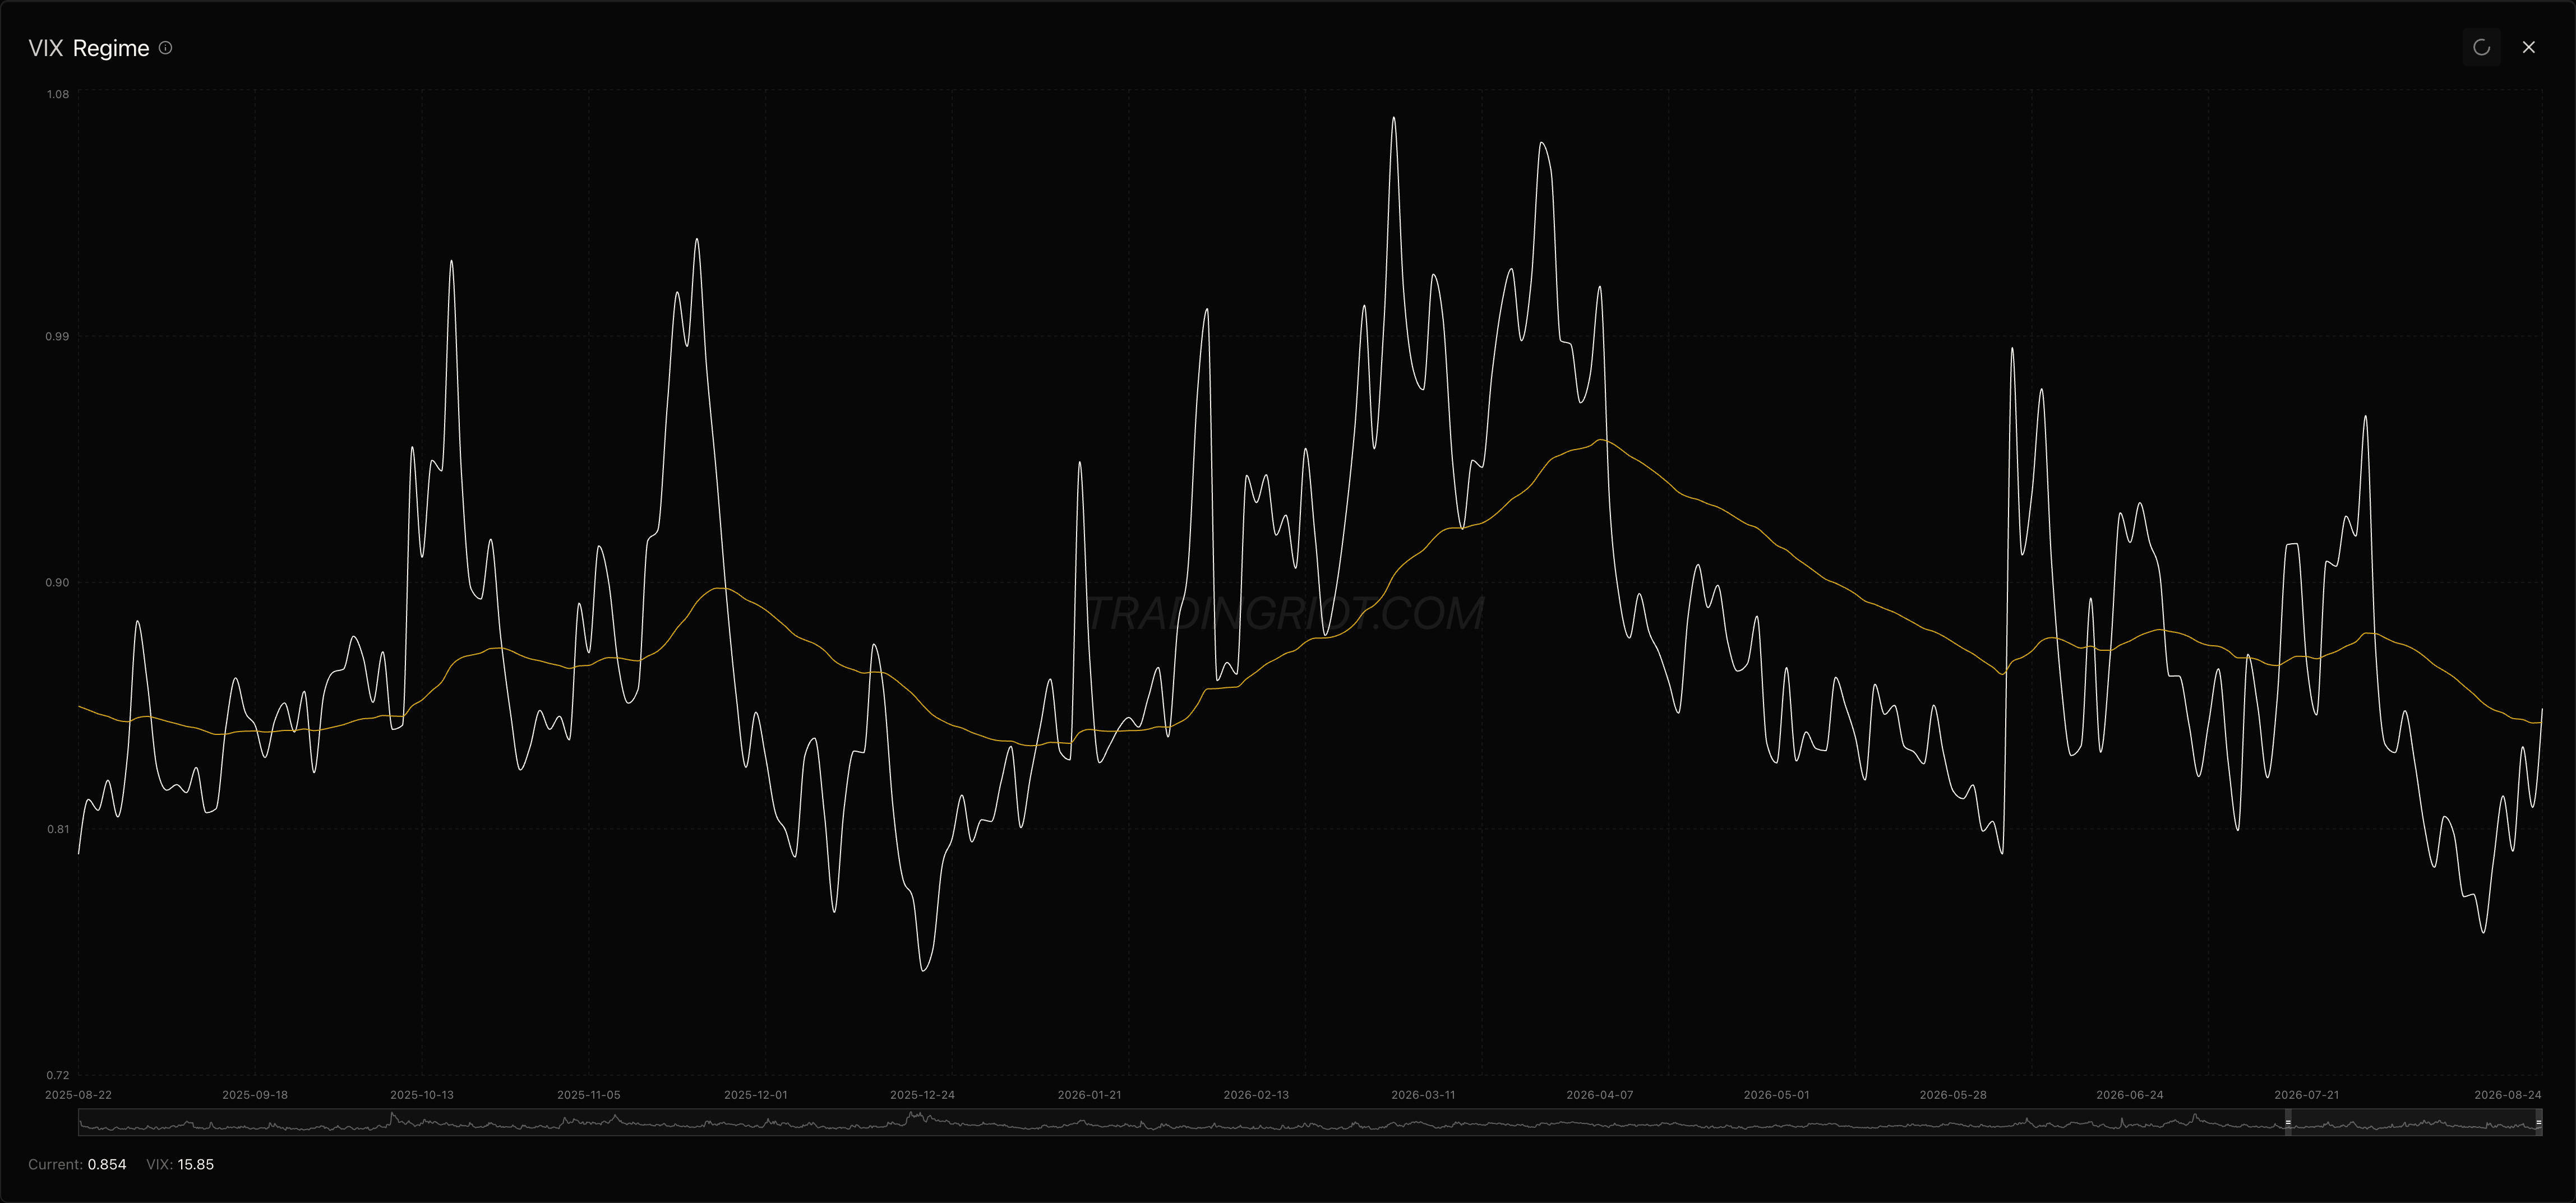
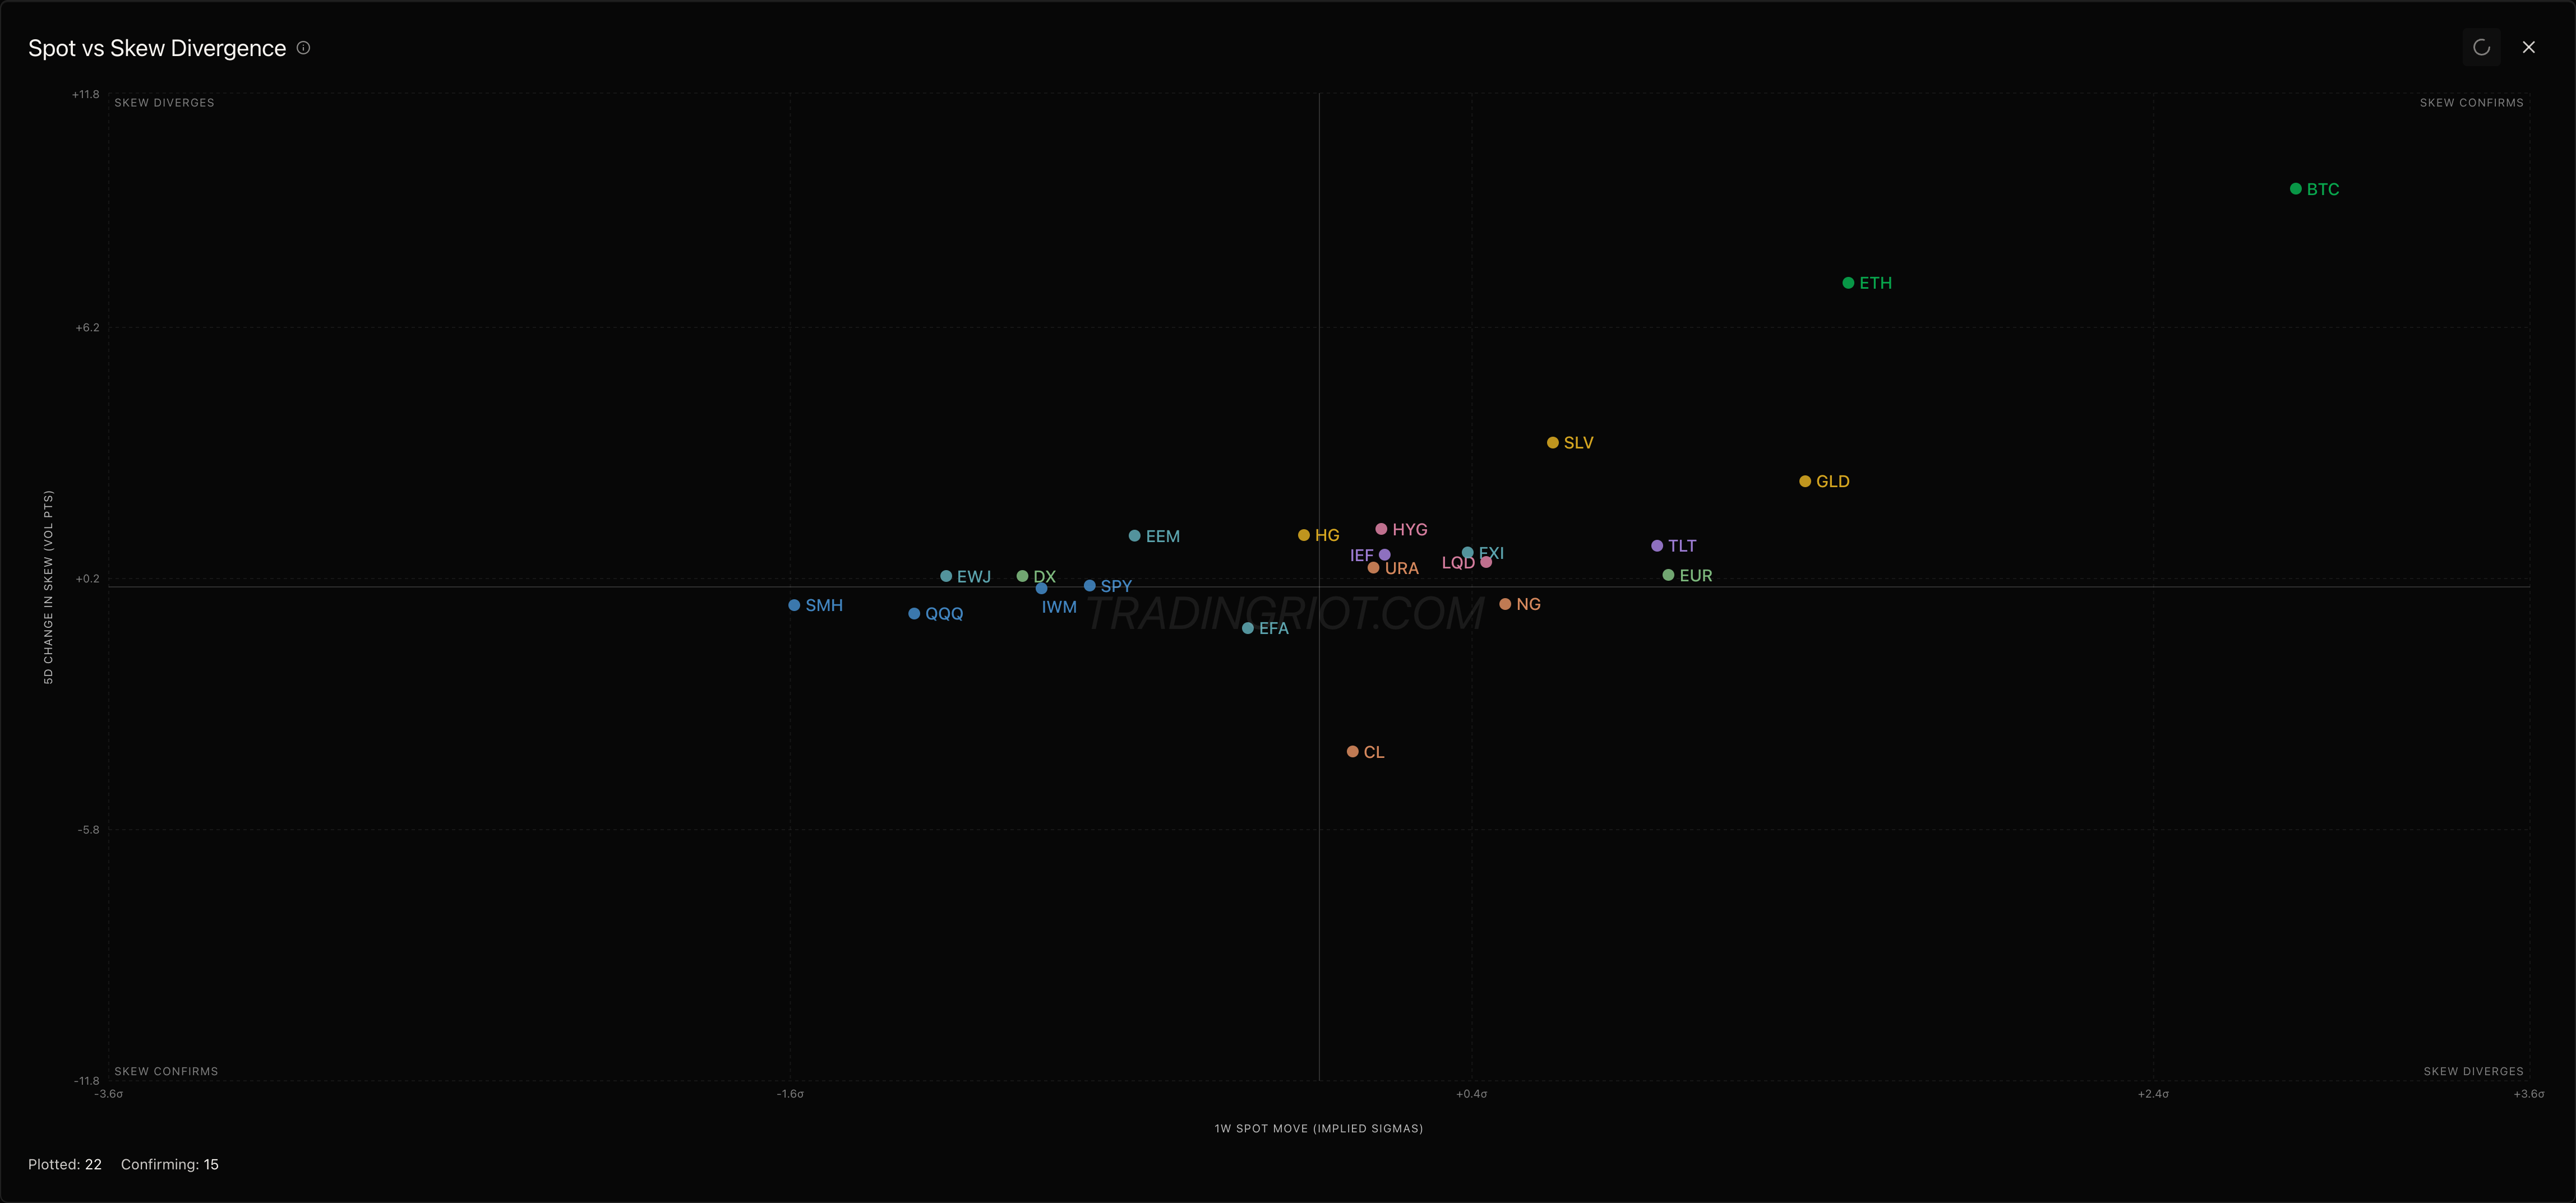
Skew spent the first half of the month at the top of its one-year range: puts had collapsed as traders sold hedges and rotated into upside calls to chase the early August rally as SPY hit the 98th percentile of its year; a small unwind now.
Skew in SPY did come in: its 25-delta skew which was trading in the 97th percentile of its 1Y range last Monday fell to only the 85th; Nasdaq went from 99th to 84th. Puts did, then, richen relative to calls. However they had been trading all year at their cheapest relative to calls and the move is a small one -- less than one volt point on SPY (8 tenths of a point).
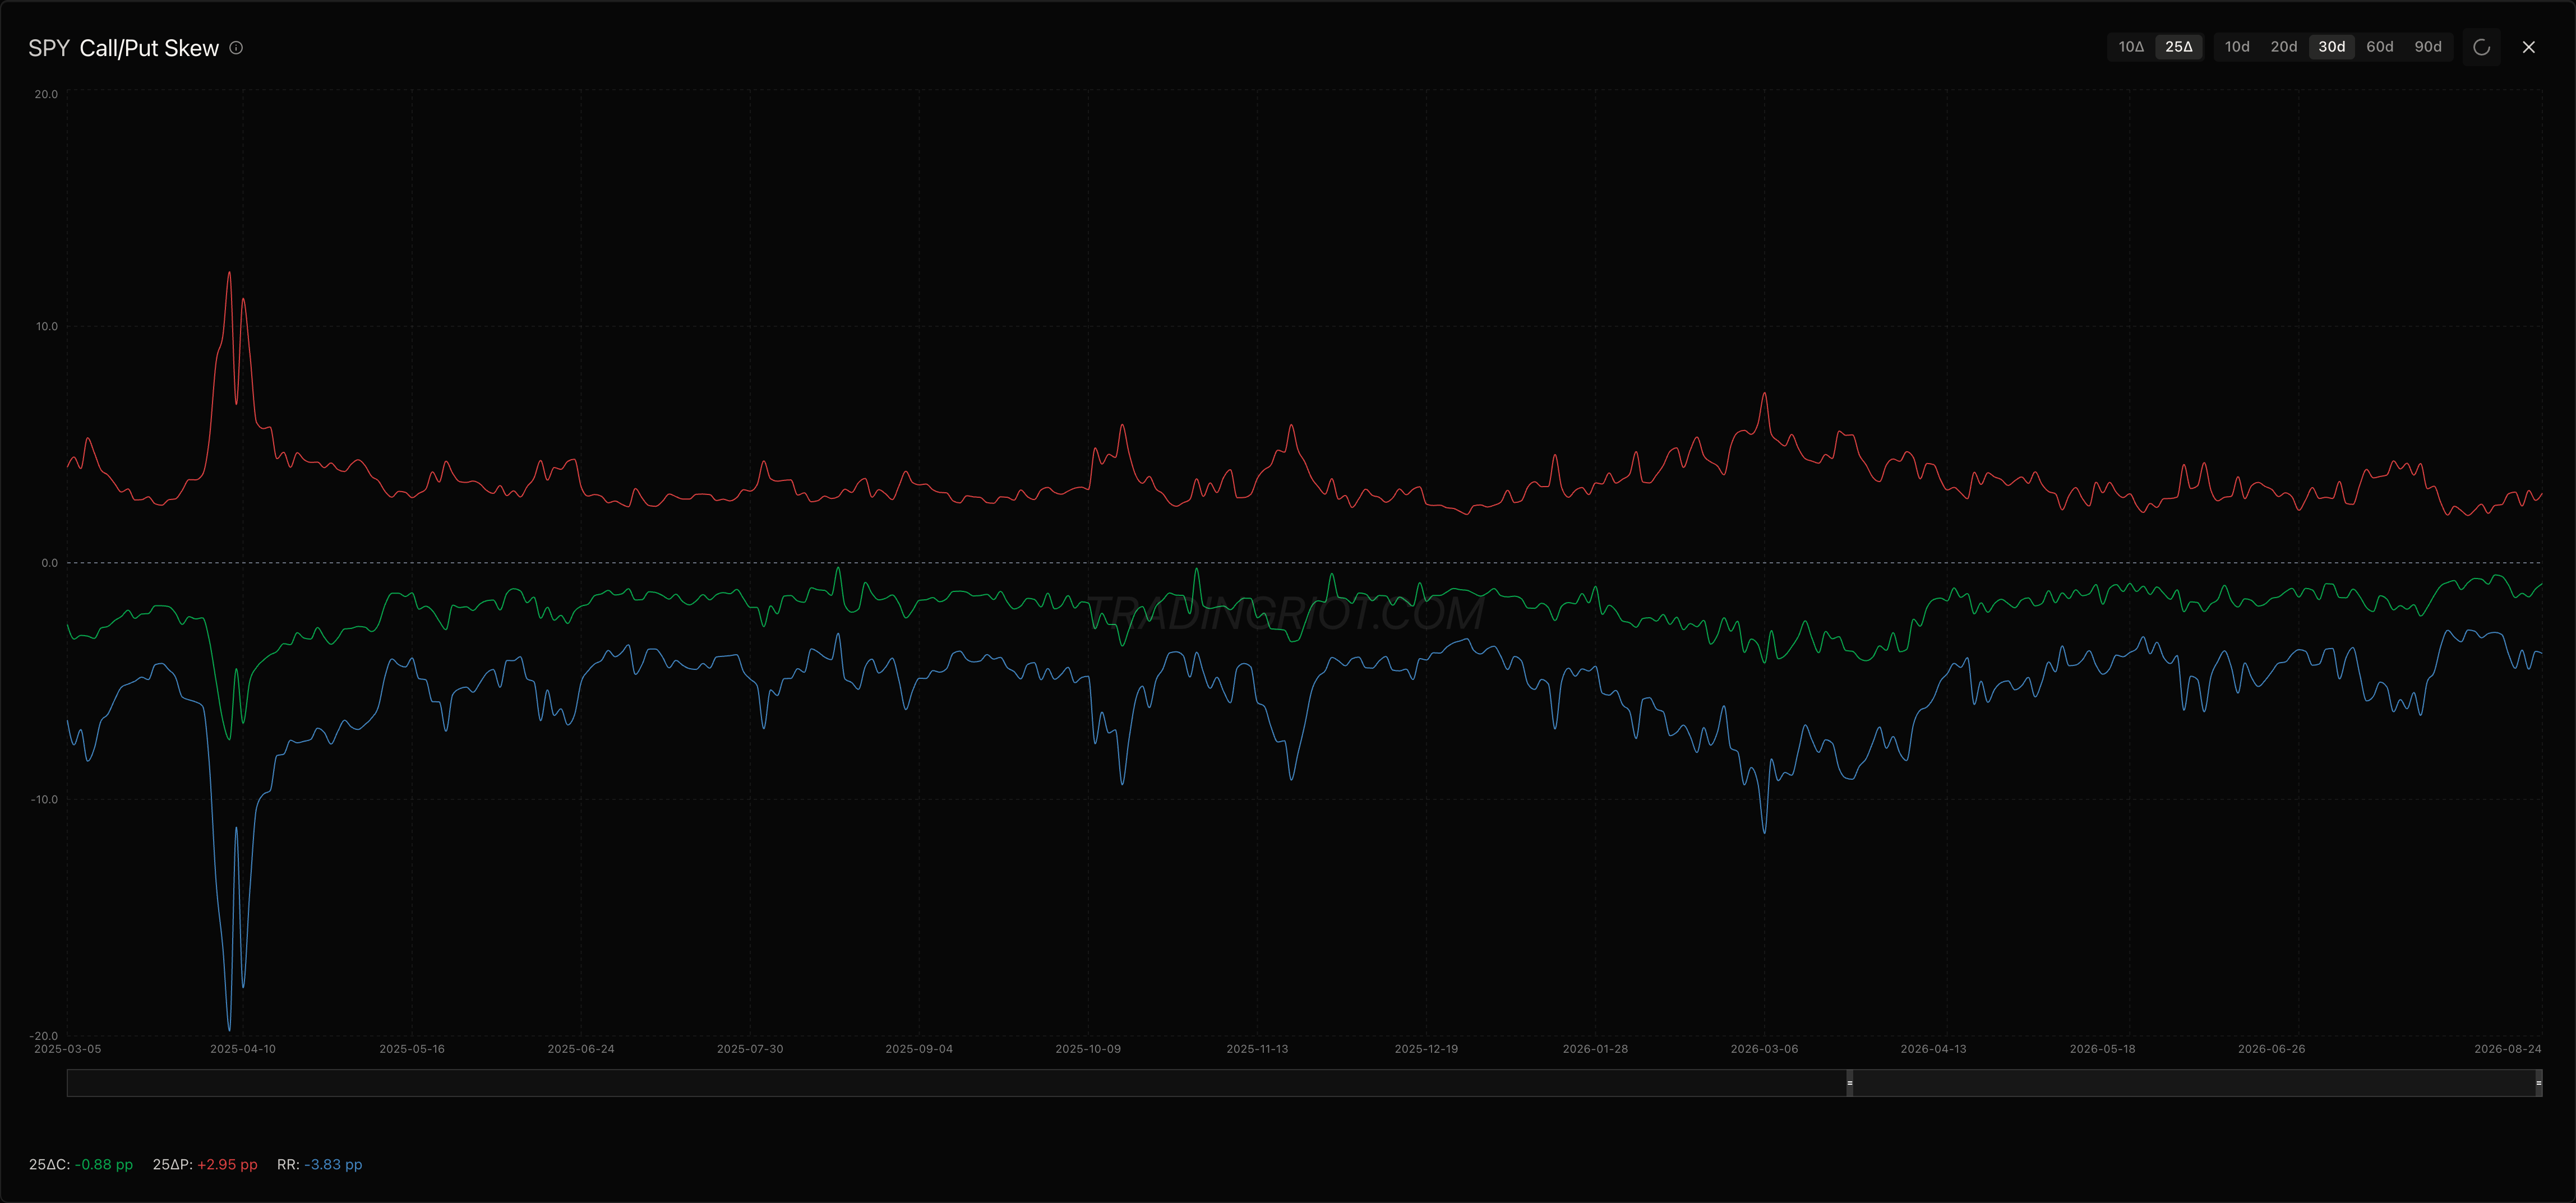
The standard suspect for ATM-pinned index with both wings paid, is generally iron-fly flow - a short ATM straddle which is flat on both sides in the far OTM wings.
This lowers the middle of the surface and pushes up the edges, SKIS skew steepens, meanwhile the top line vol-index goes nowhere. And well, that just sums up what the tape actually seemed like ALL week. SPY realized 7.5% over than 12.5% implied - carry=56%, within one week when SEMIs were down with 8%, whilst under the quiet index Dispersion actually does some real work.
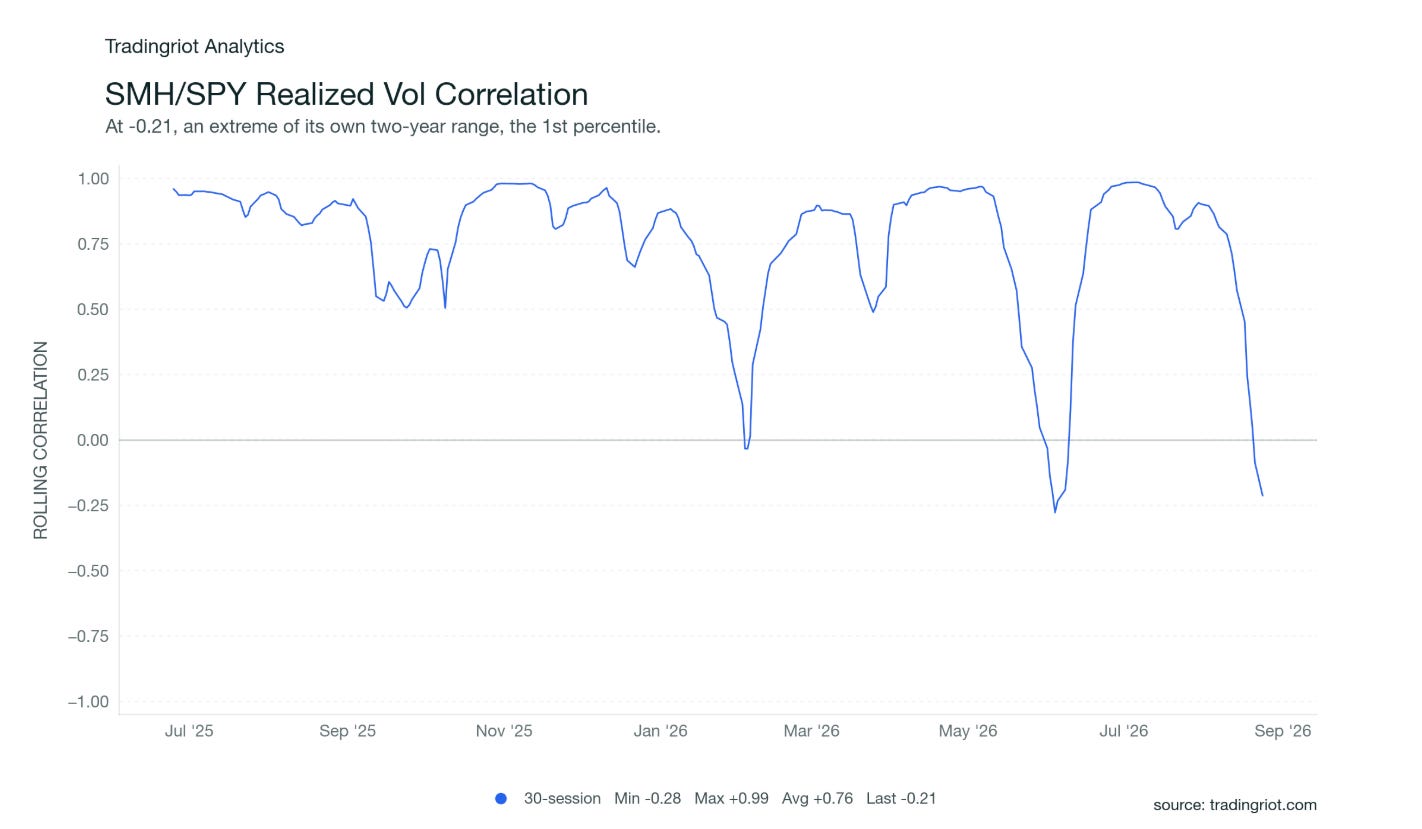
The rolling 30 session between semi and index realized vol turned into the negative territory, currently -0.21. It corresponds to the 1st percentile throughout the 2-year range and comparing to 1-year average of +0.57, which has held in line with its sign for 80% of the time of its presence. SPY-QQQ says the same story with firmer statistics, 0.45 compared to 1-year +0.78, which has held for 96% of the time. Actually, semi did it once in June already with a print of -0.28. Hence, we should treat it as a repeat rather than a 1st time phenomenon, but the pattern should be the same in both cases (drawdown of a single sector being absorbed by the index when it scarcely moves).
Underneath this rotation is defensive and it is broad - Healthcare added 4.58%, Staples 3.27% and Technology lost 5.4%, Industrials 3.93% and Implied Vol on XLV and XLP sits at 81st and 80th %ile the two highest of the eleven sectors. That defensives are being bought and their options bid is a different animal from defensives gently grinding higher in a quiet tape.
More interesting are the momentum figures based more on single names than merely the index wrappers. The top momentum decile starts at 70 (out of 100) when looking across ~500 names that are assigned both a sector and momentum rating. 20 of its 43 names for sector energy reside in that group, technology only holds 4 (out of 118!) and has lost 7.44% on the median name of the sector this week and only healthcare with 12 names (out of 54) shows some sign of strength. Meanwhile of all sectors basic material comes across with nothing in the top group, however shows the strongest median returns this week of 8.79%, with the cheapest median carry on the board with only 1.6%. The move in metals is taking place with its option charged almost for free. Something of a repeat on the story with gold above.
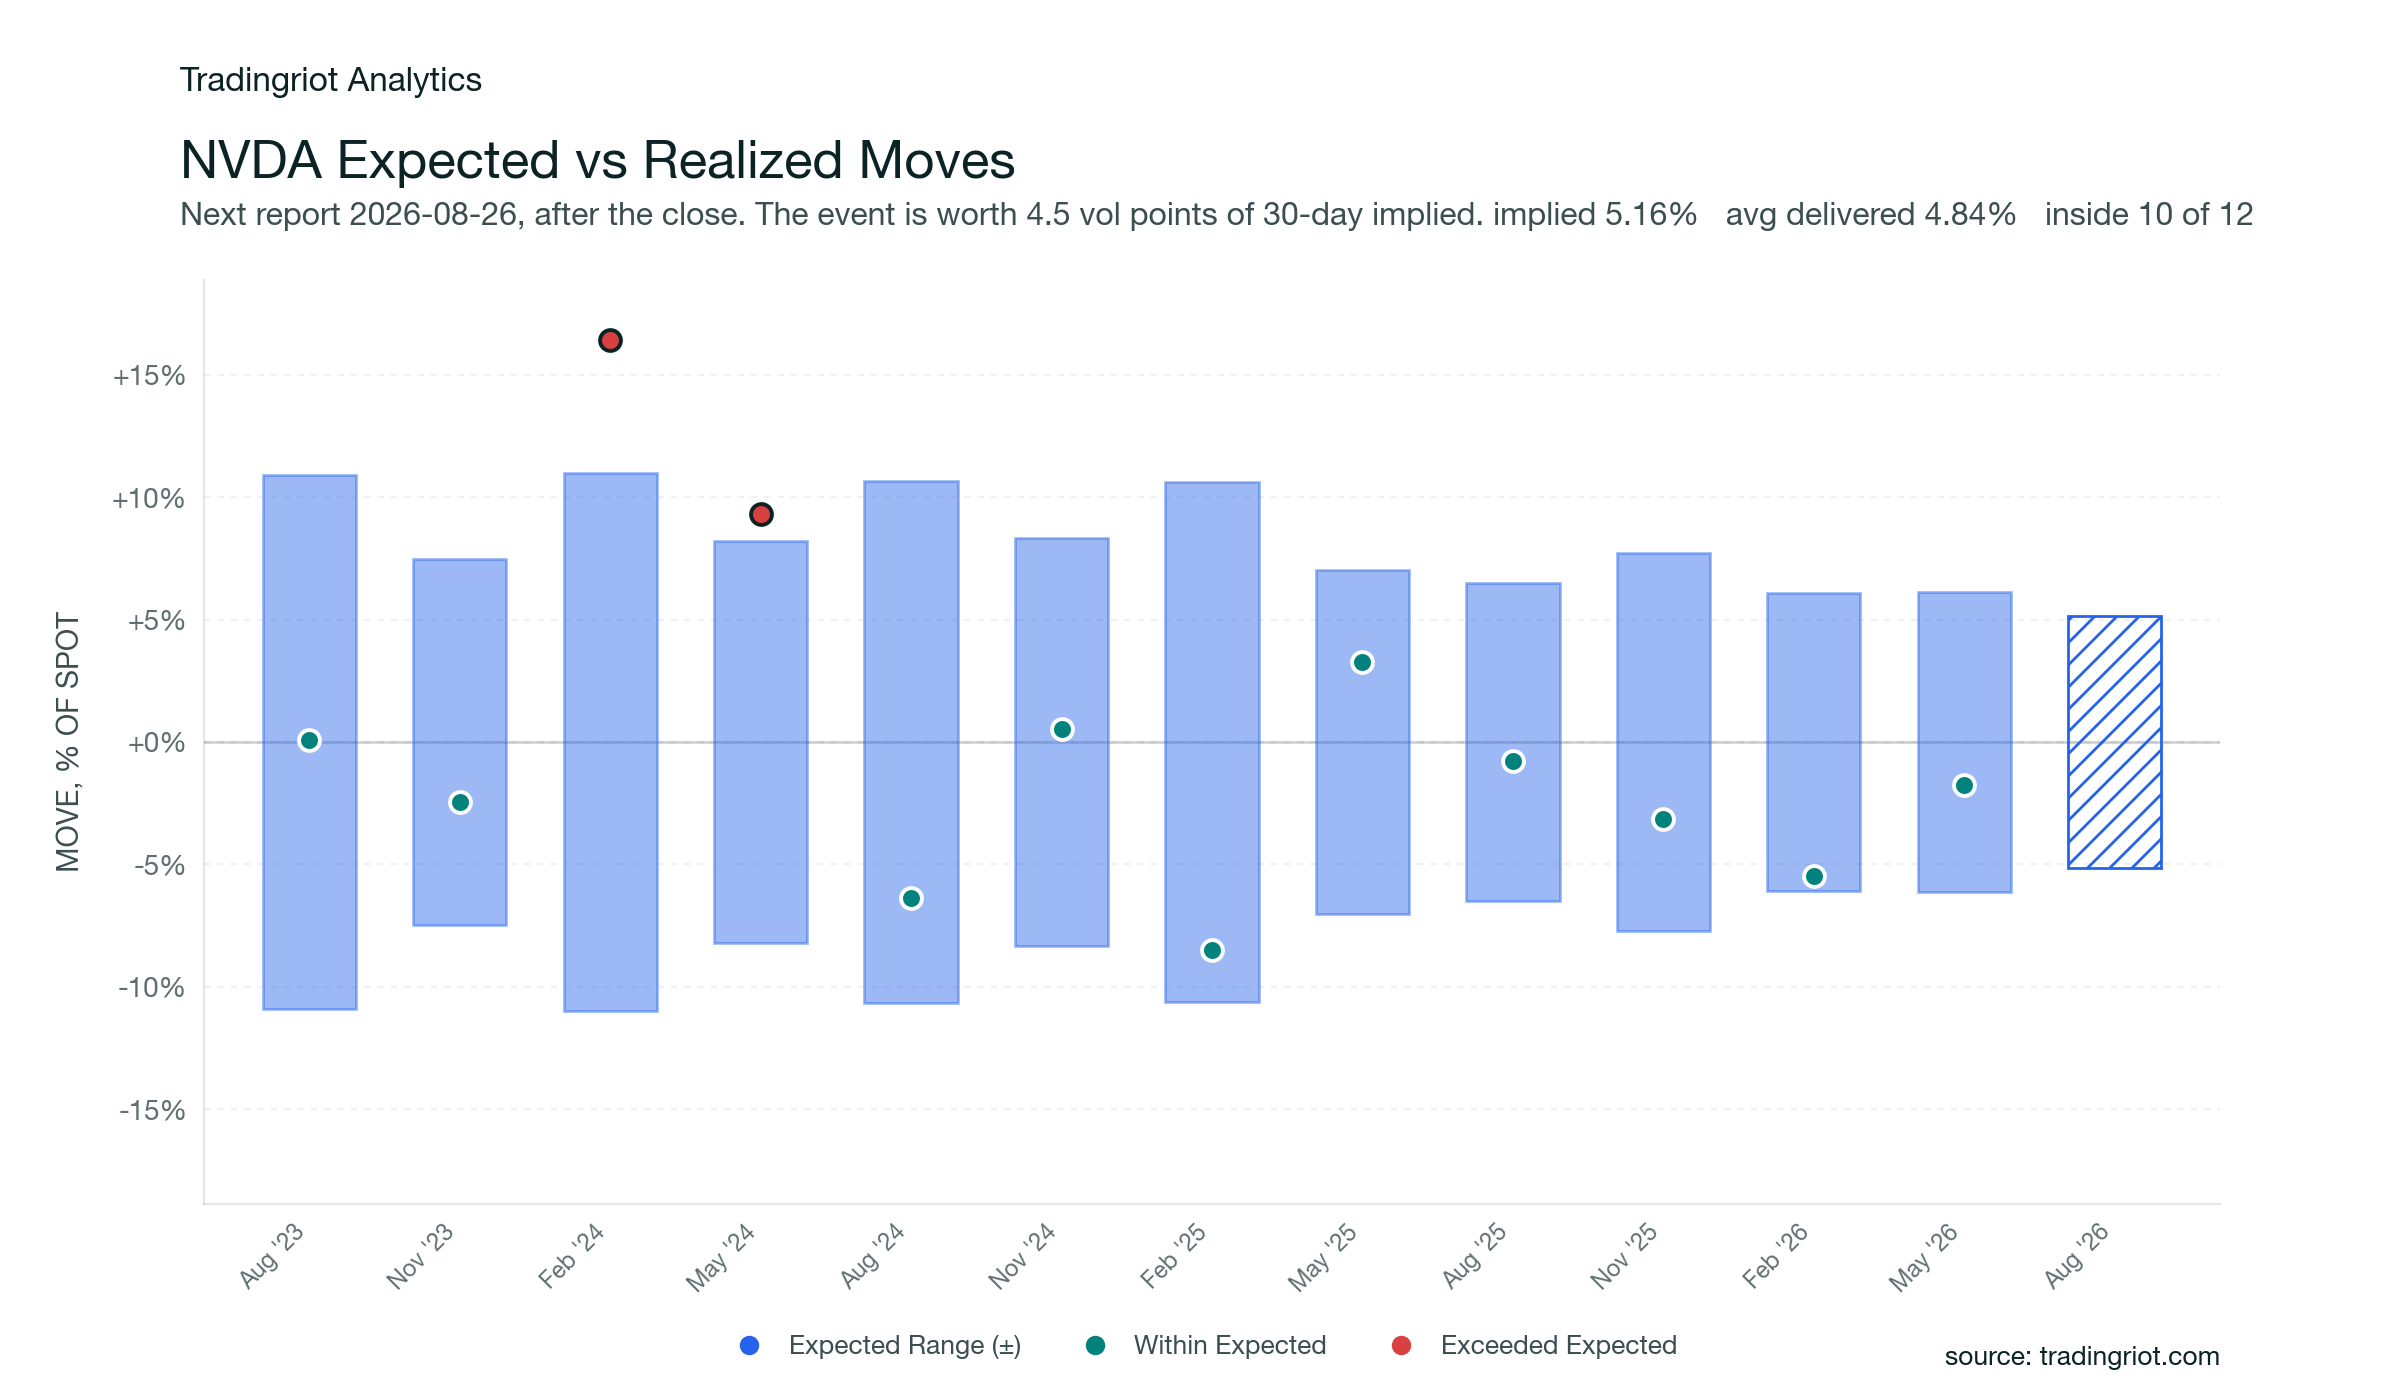
On Wednesday after the close, Nvidia reports and the options market is pricing a 5.64% move vs. an average delivered move of 4.84% over the last twelve quarters. Worth knowing before anyone calls that expensive, the stock has come in under its straddle in ten of those twelve prints.
Futures
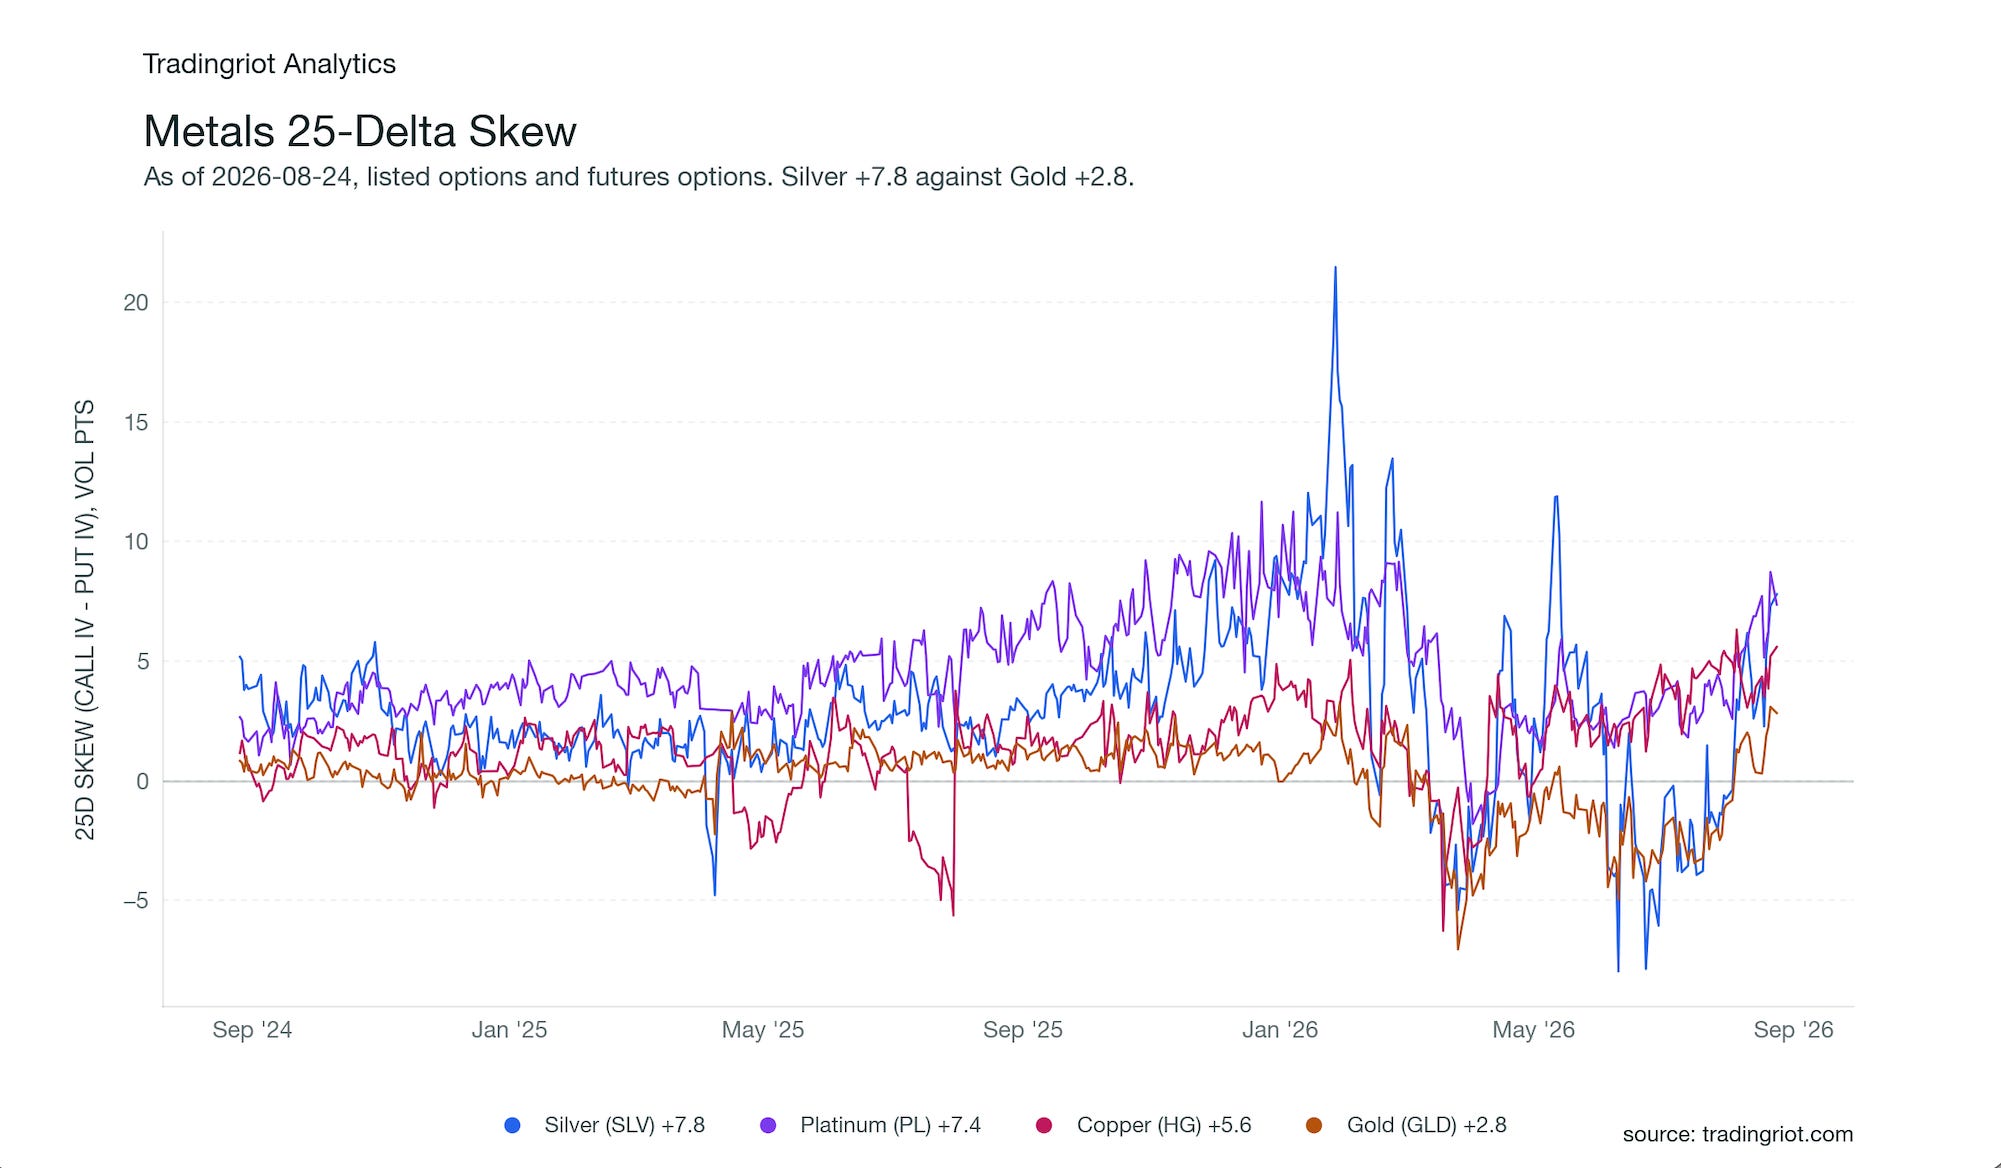
Up all of the metal complex has repriced its upside in tandem. Copper, Gold and Silver 25 delta skew is at yearly highs and Platinum is chasing them. All three are trading their calls over puts. As you can see from the chart below. ATM levels are nowhere near as stretched.
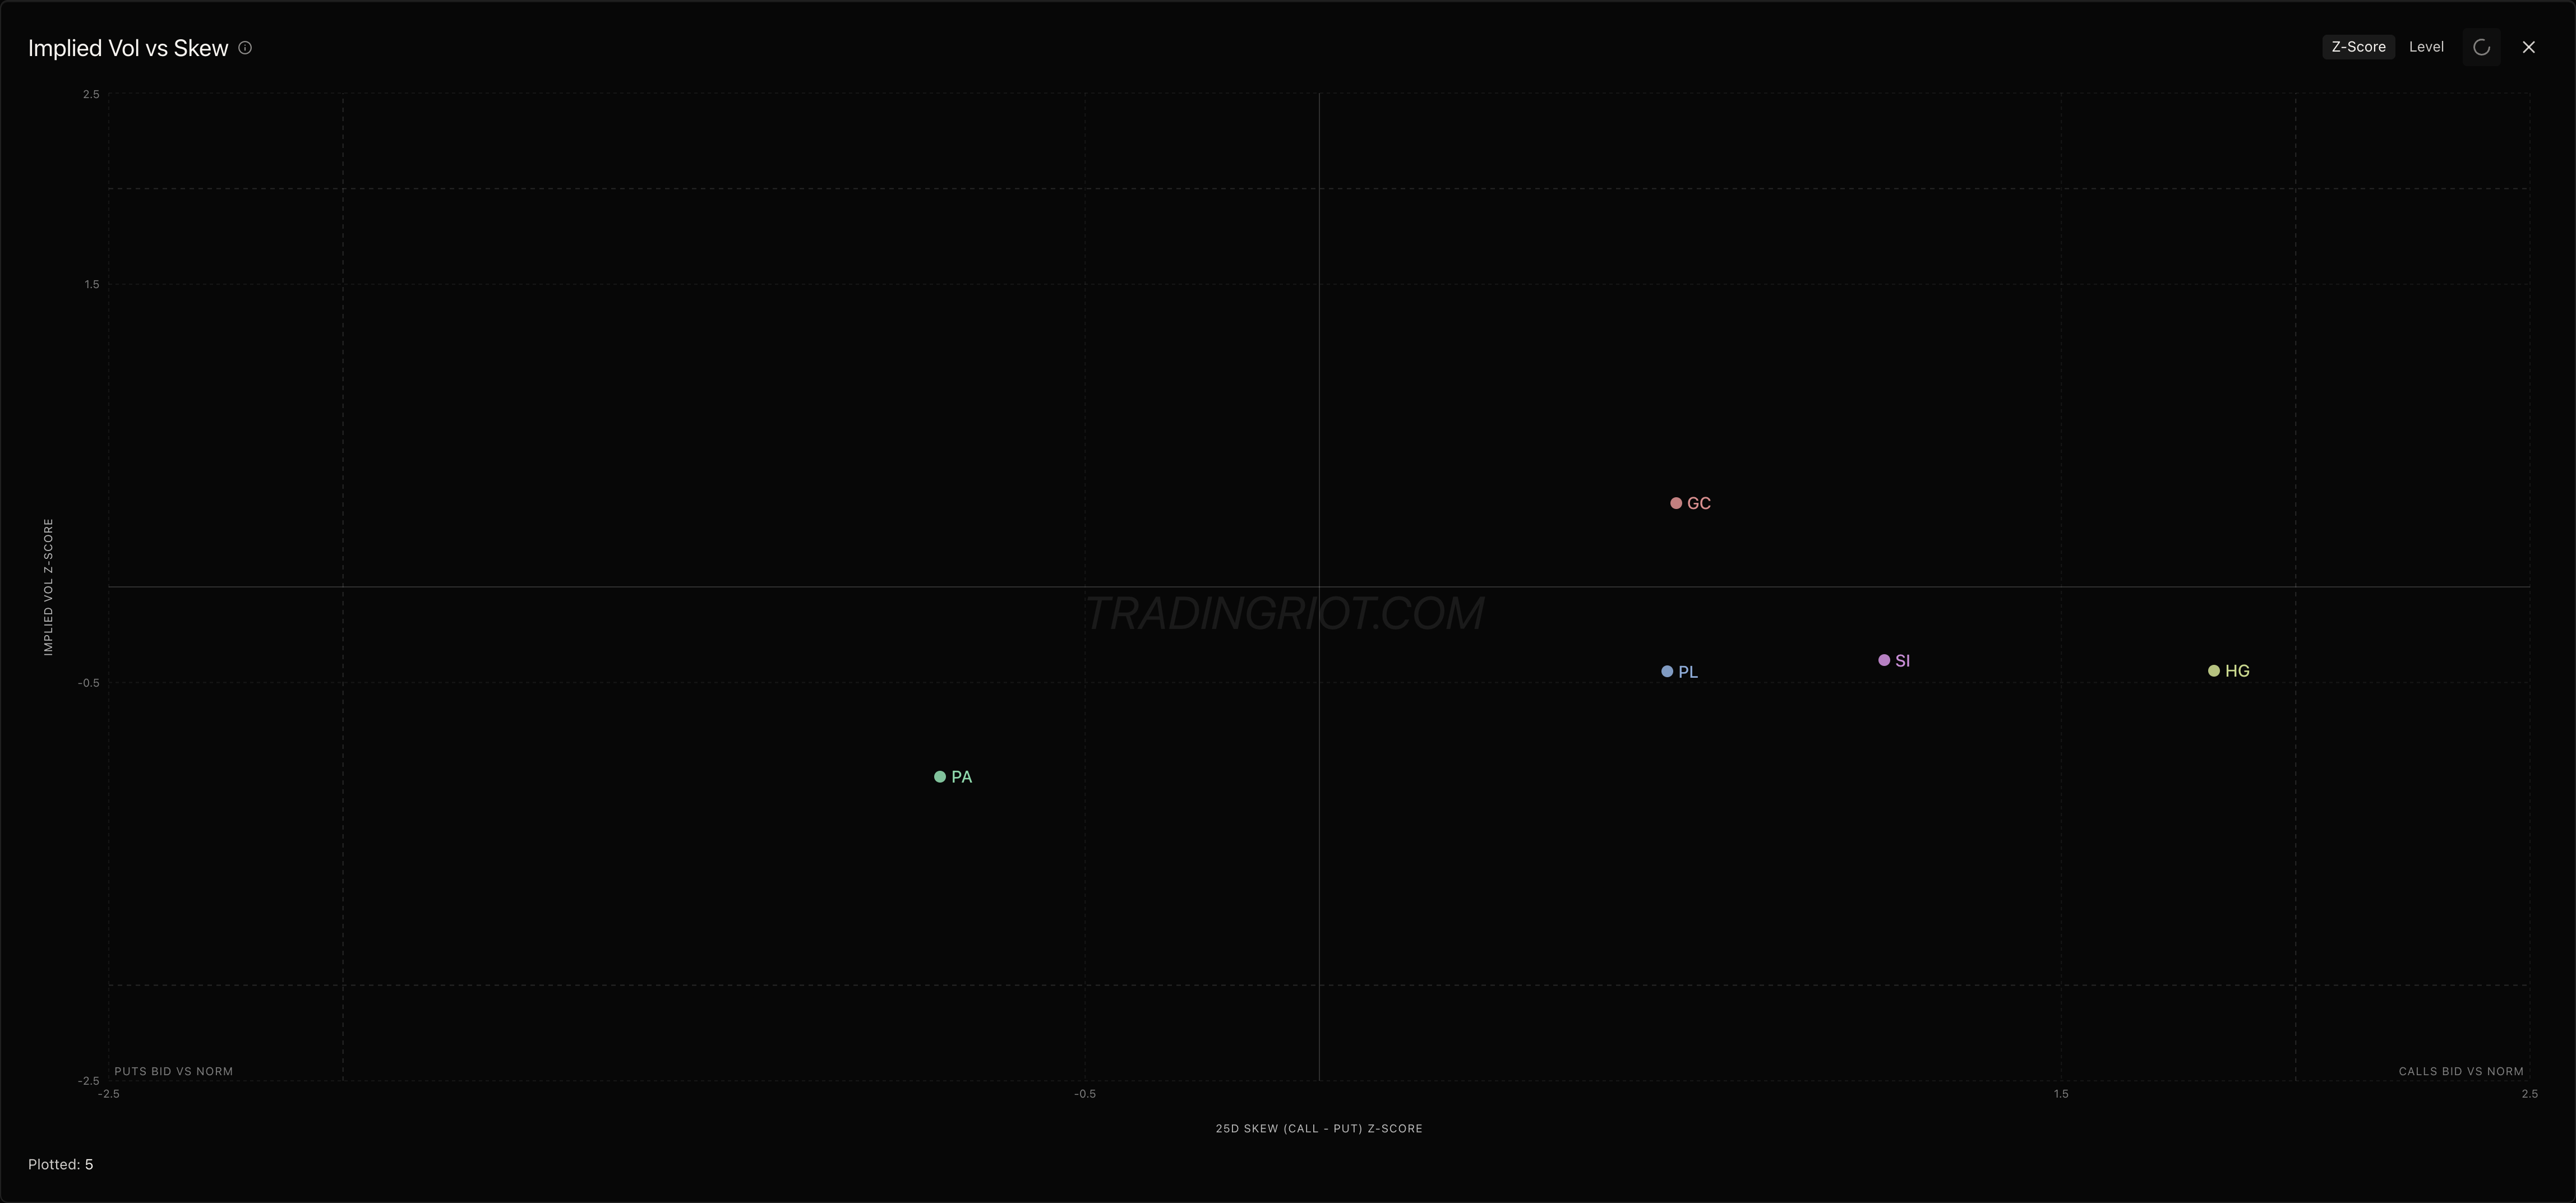
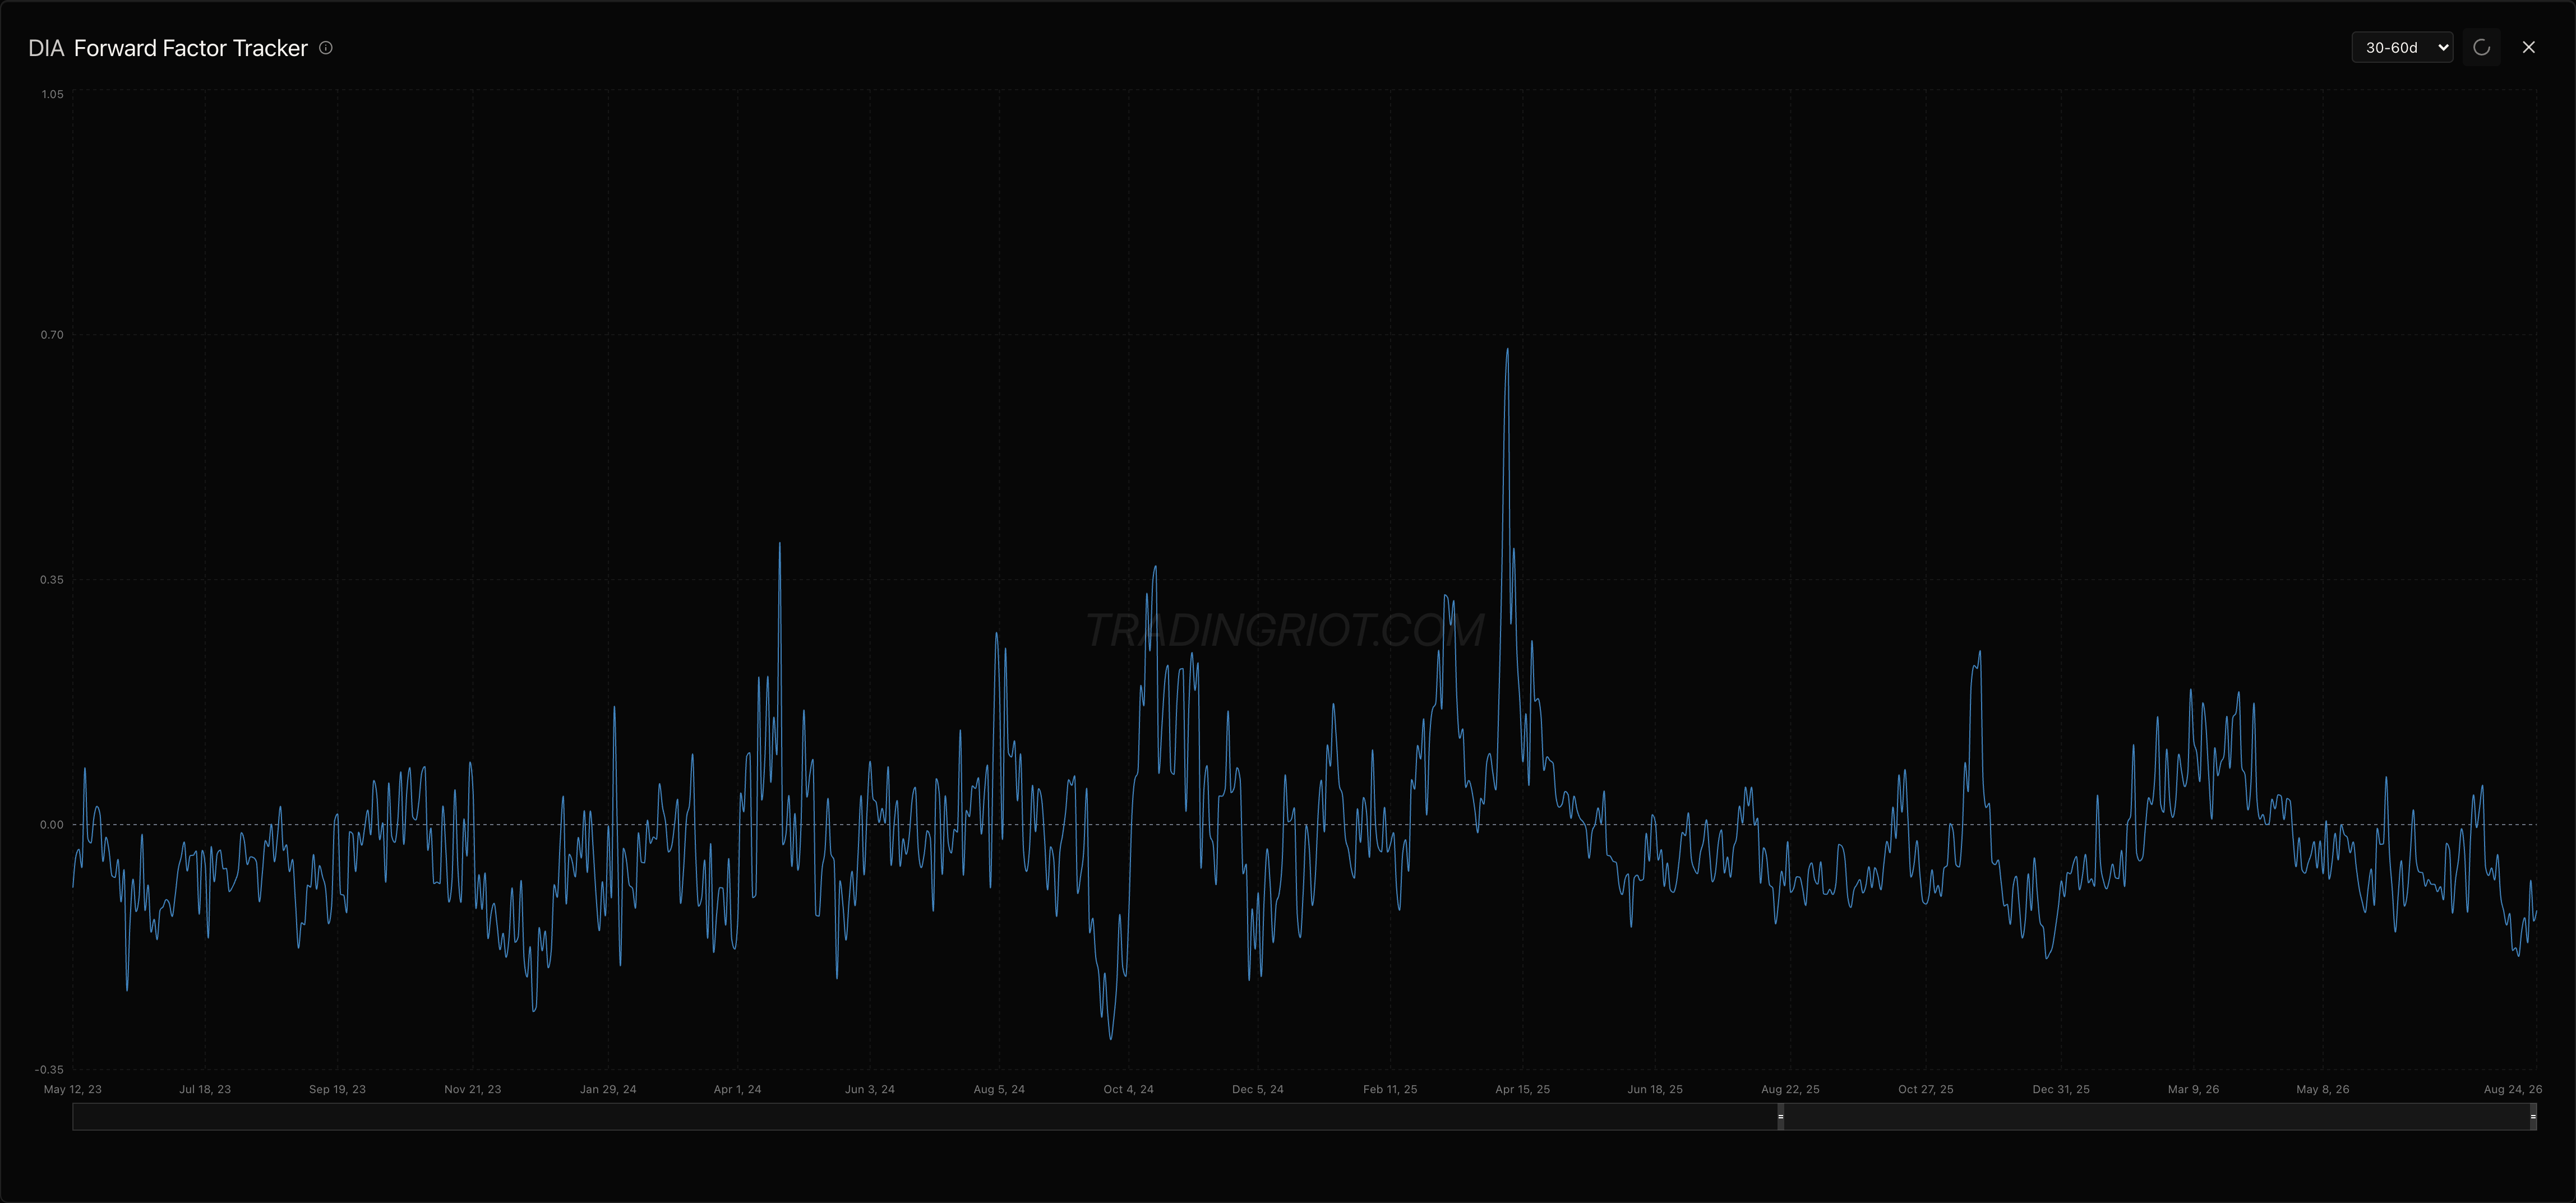
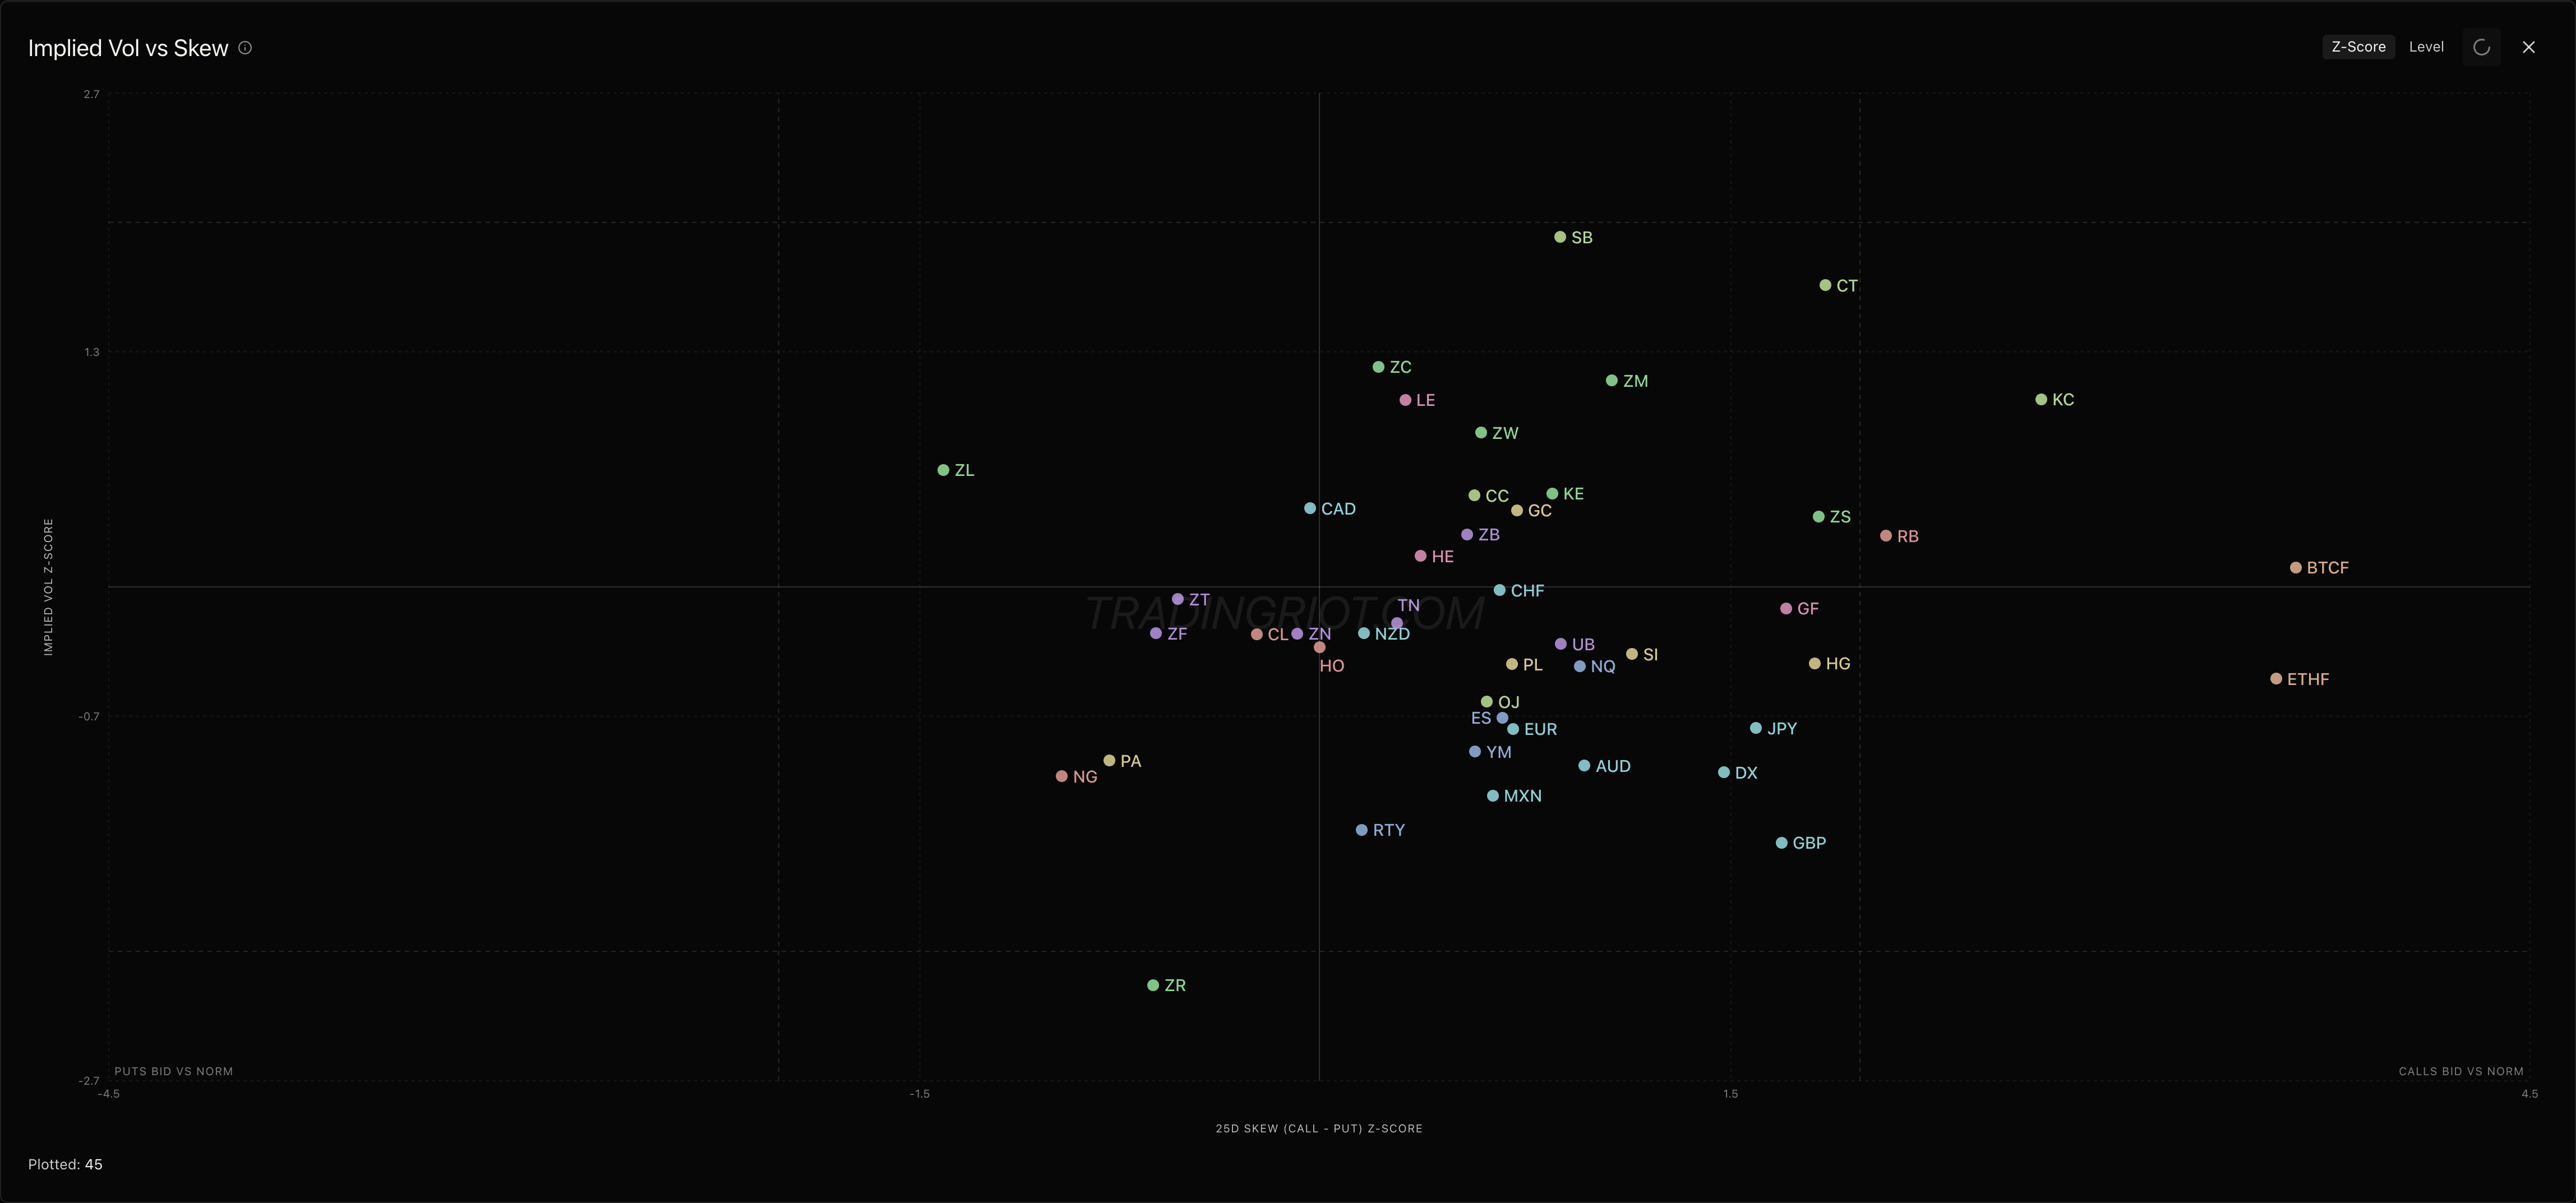
Other than metals implied vol in futures still lives where it has lived all summer. And this remains soft & grains. Index futures are a reversed image, with the Russell at the 5th percentile and the Dow and ES hitting 30-to-60-day fwd factor lows as window after it are also getting repriced below the window behind them.
Last week also saw crude climb from $82 to a $87.06 high by Friday, the second consecutive week with gains before coming back to $85.01 on Monday where its vol is still sat in the 50th percentile and in the middle of its range.
As we begin with the start of the week now at the long end I would shift my gaze towards looking for rates positioning. This divides the curve almost in two. In the COT report dated 18th of August commercials are 100 on their 52 week index in the 30-year and in the ultra bond, they also hold 84 in 10-years, opposed to 0 in 2-years and 8 in 5-years. The exact mirror of course is represented by large specs: 100 in the 2-year while 0 in each long bond contract.
None of this has found its way to options pricing, with rates implied vol percentiles are between 38 & 61%, skew percentiles between 32% & 75%, whilst the GLD (Gold) implied remains at the foot of its spectrum at 7.7%, as the TLT 30-day implied closed at 10.7 on Monday in the middle of 10.5--11.3 band from earlier in the week.
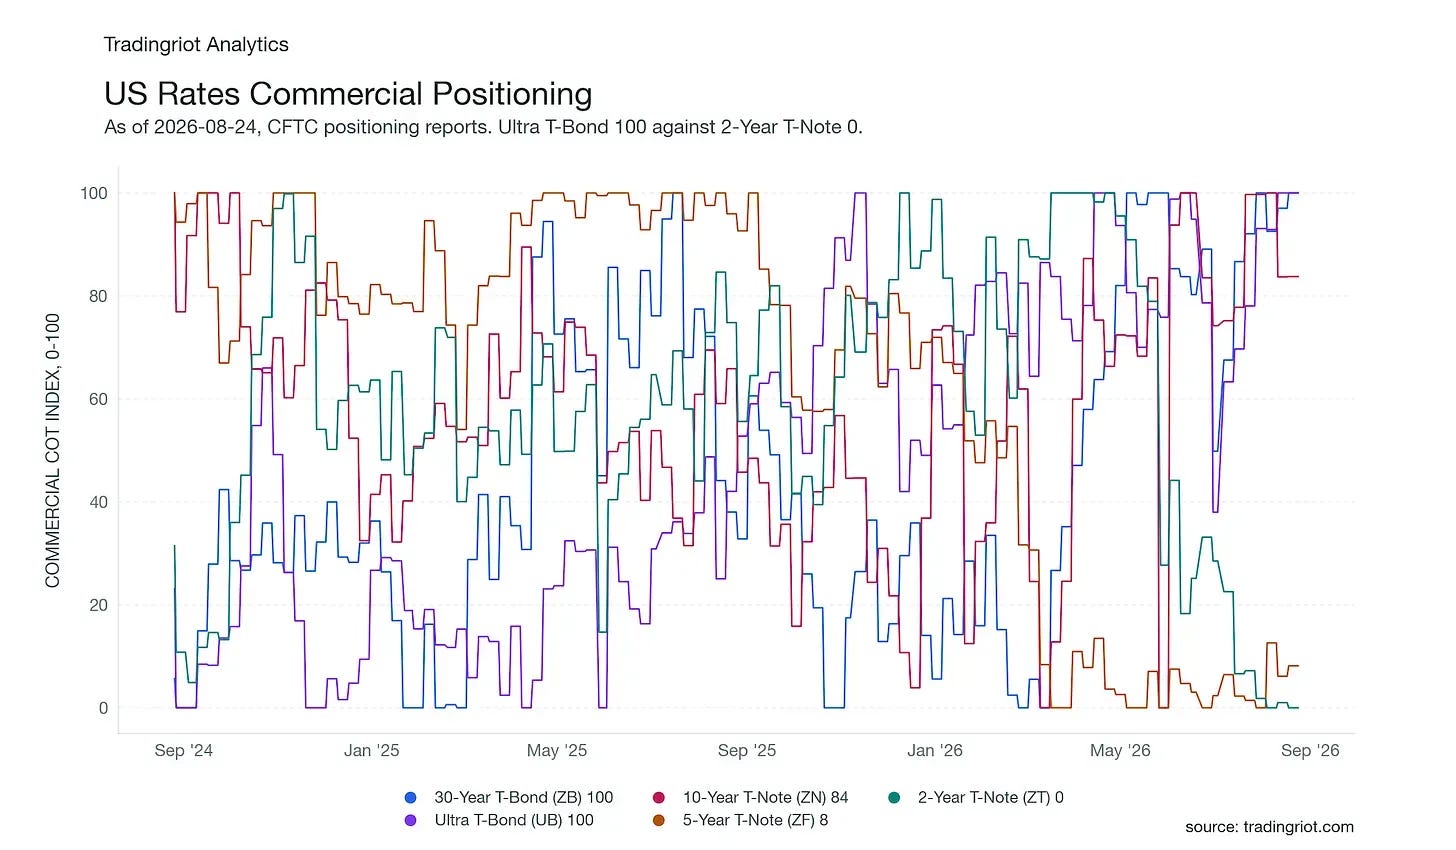
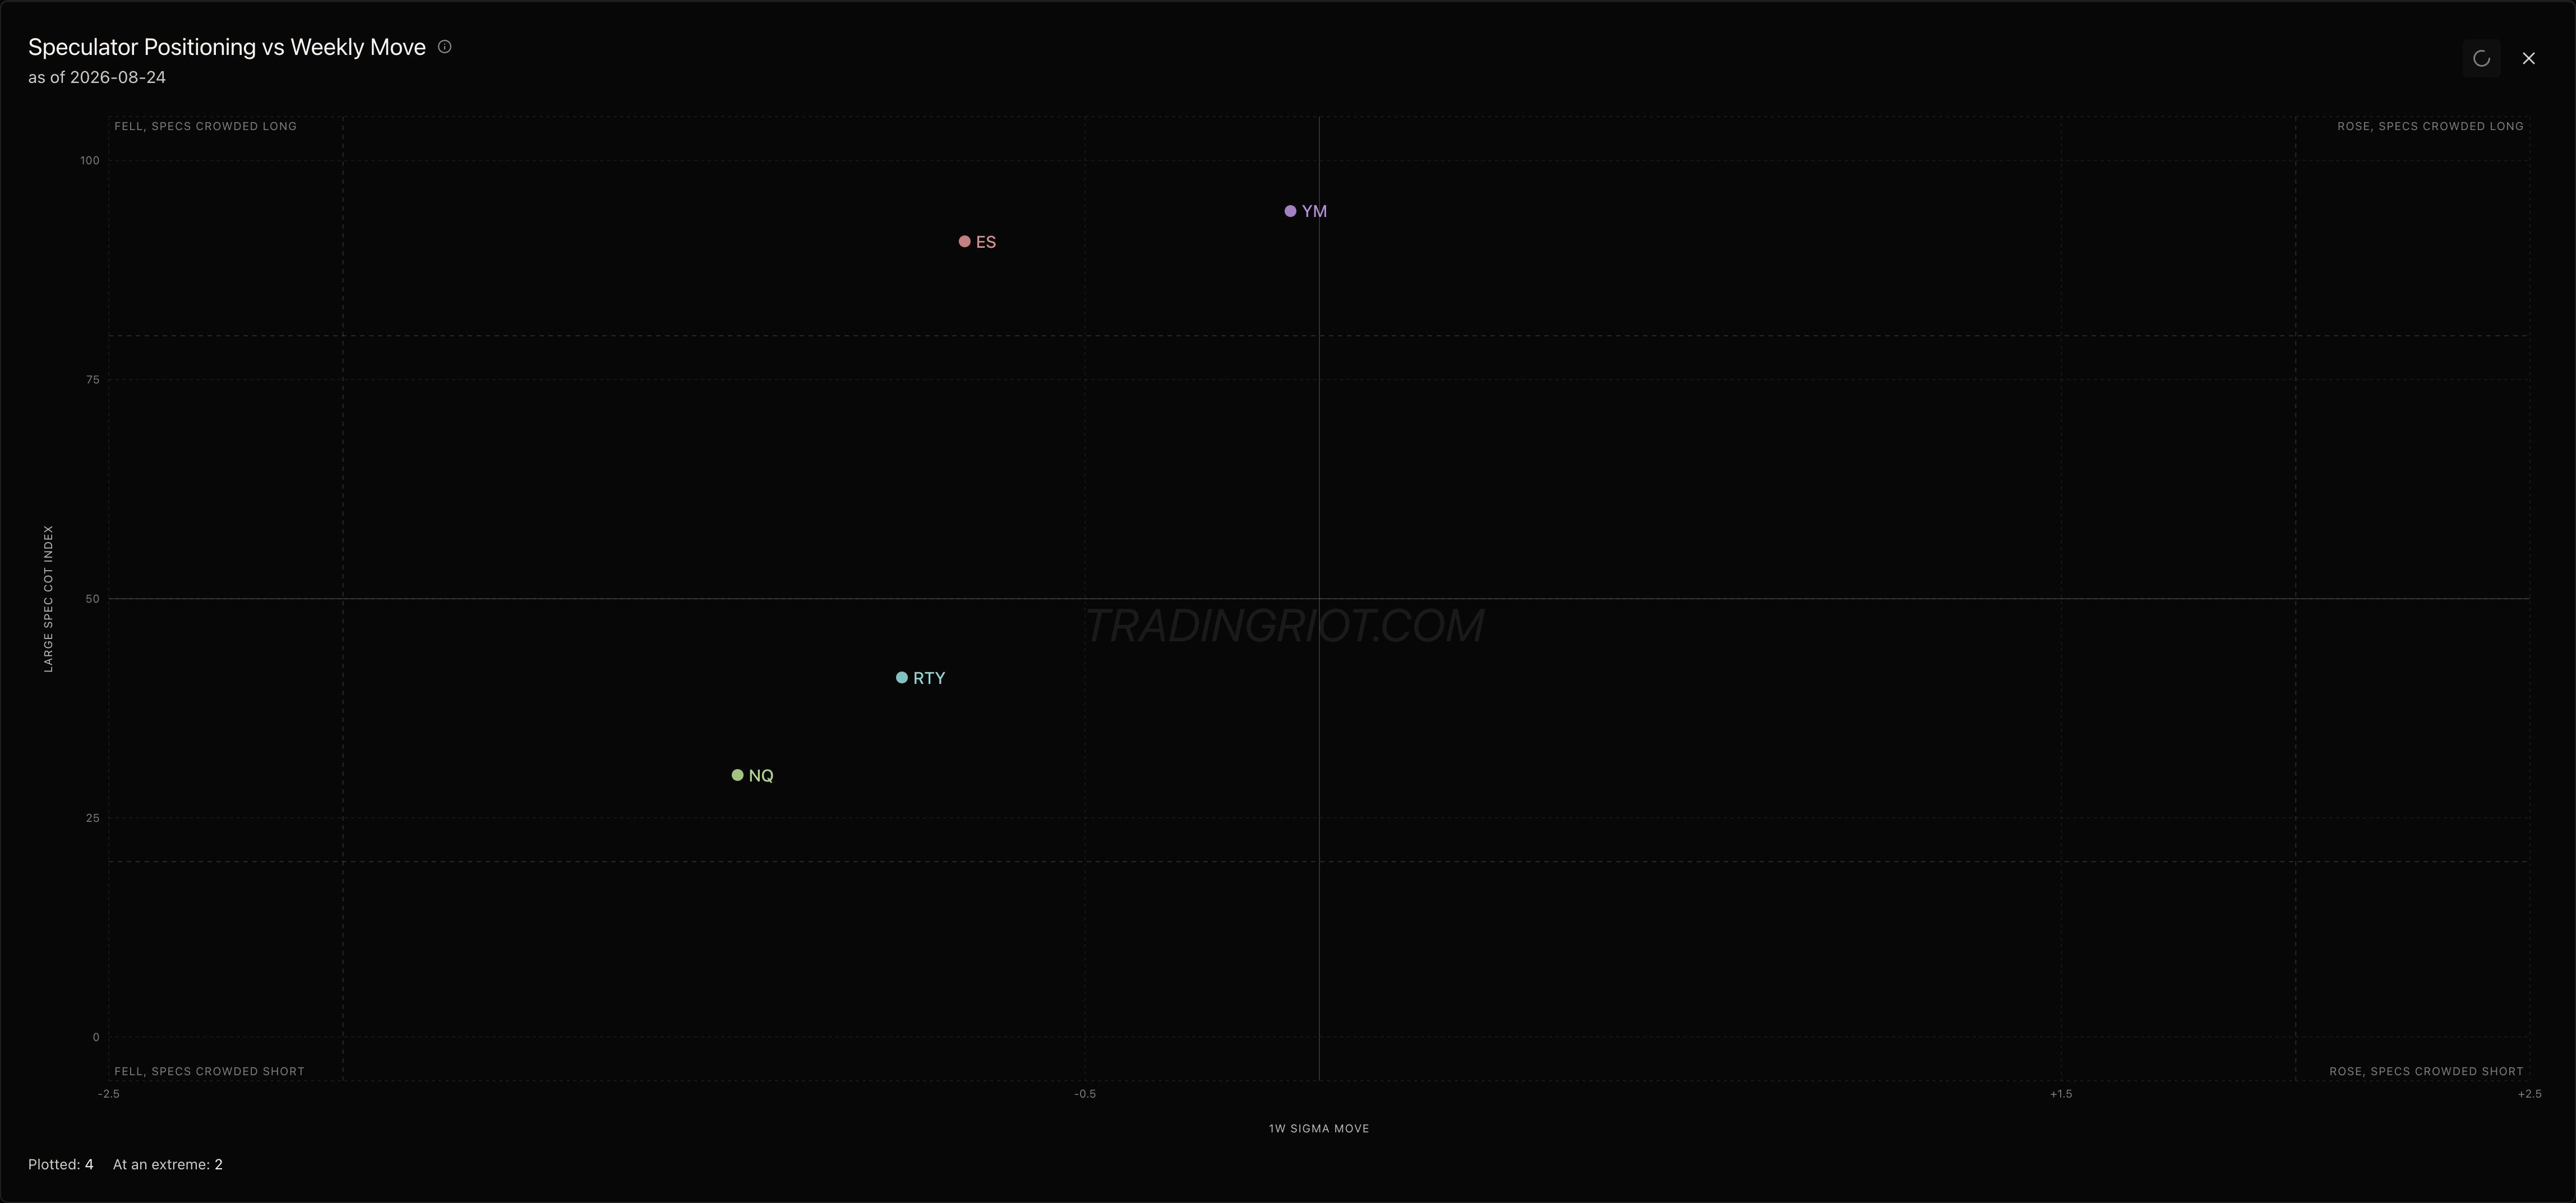
Inside a day the yields had erased the buyback relief and with the dollar keep siding it on Friday it obvious the fact that market saw the declaration as something less tan a stop on descent. In fact it might be more feasible to assume the fact that 30-day index did realize this which actually matches exactly the same condition with the equity surface on top. It would be an indication if such occurrence was to start and realize at front end or even on a slight possibility that long-bond wing reprices and yet the status of positioning remain split up. Same fashion and Dow large speculator 94 against ES of 91 compared to 30 of NQ and 41 for RTY would be seen as separate. Interest of this large speculator seems split and NQ along with RTY have the same in that category at a much reduced 30-41 (against 94/91 for rest of the pack.)
For FX, specs near maximum long the dollar (commercials at 9.7) and maximum short the euro (commercials at 90.4) with dollar implied vol at the 15th percentile.
Crypto
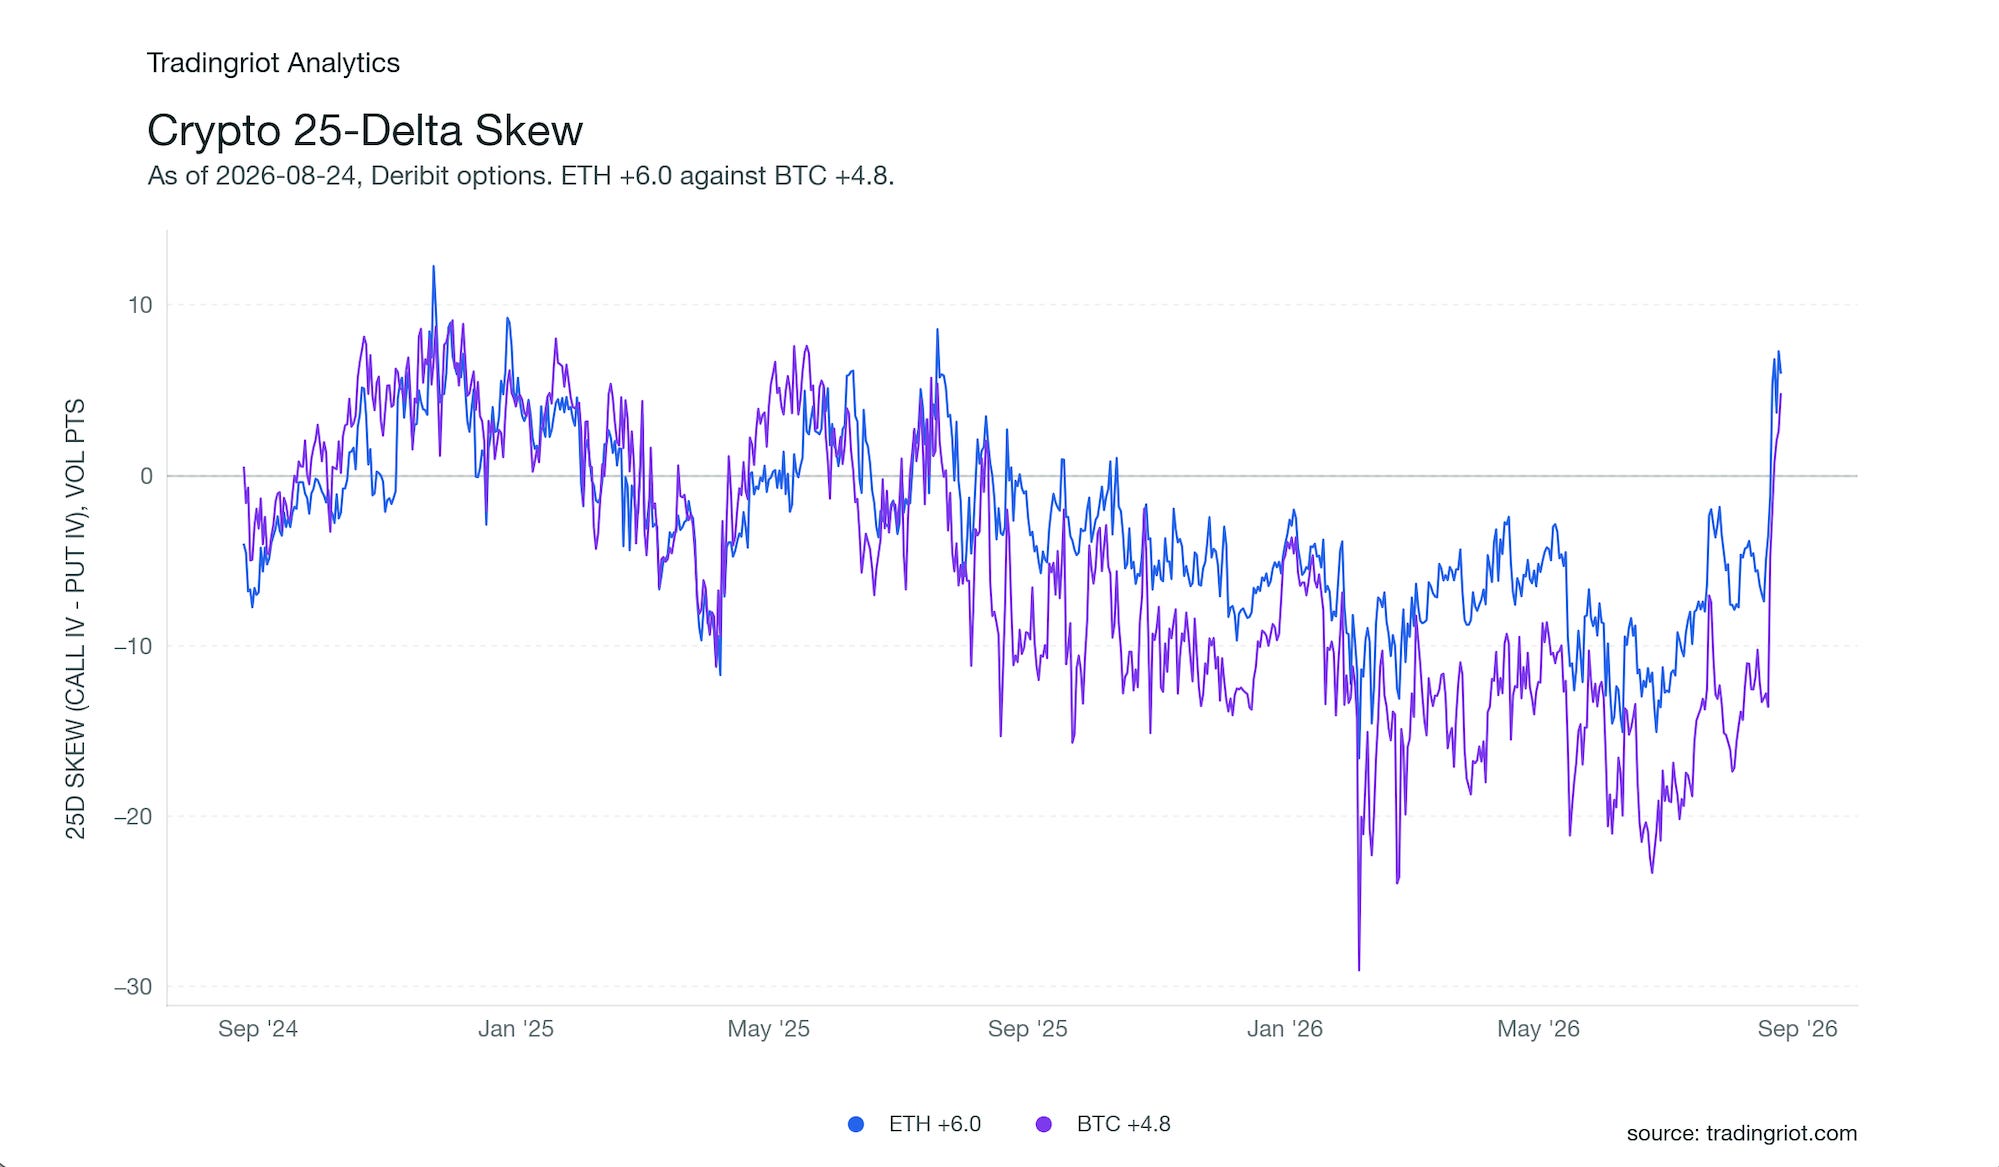
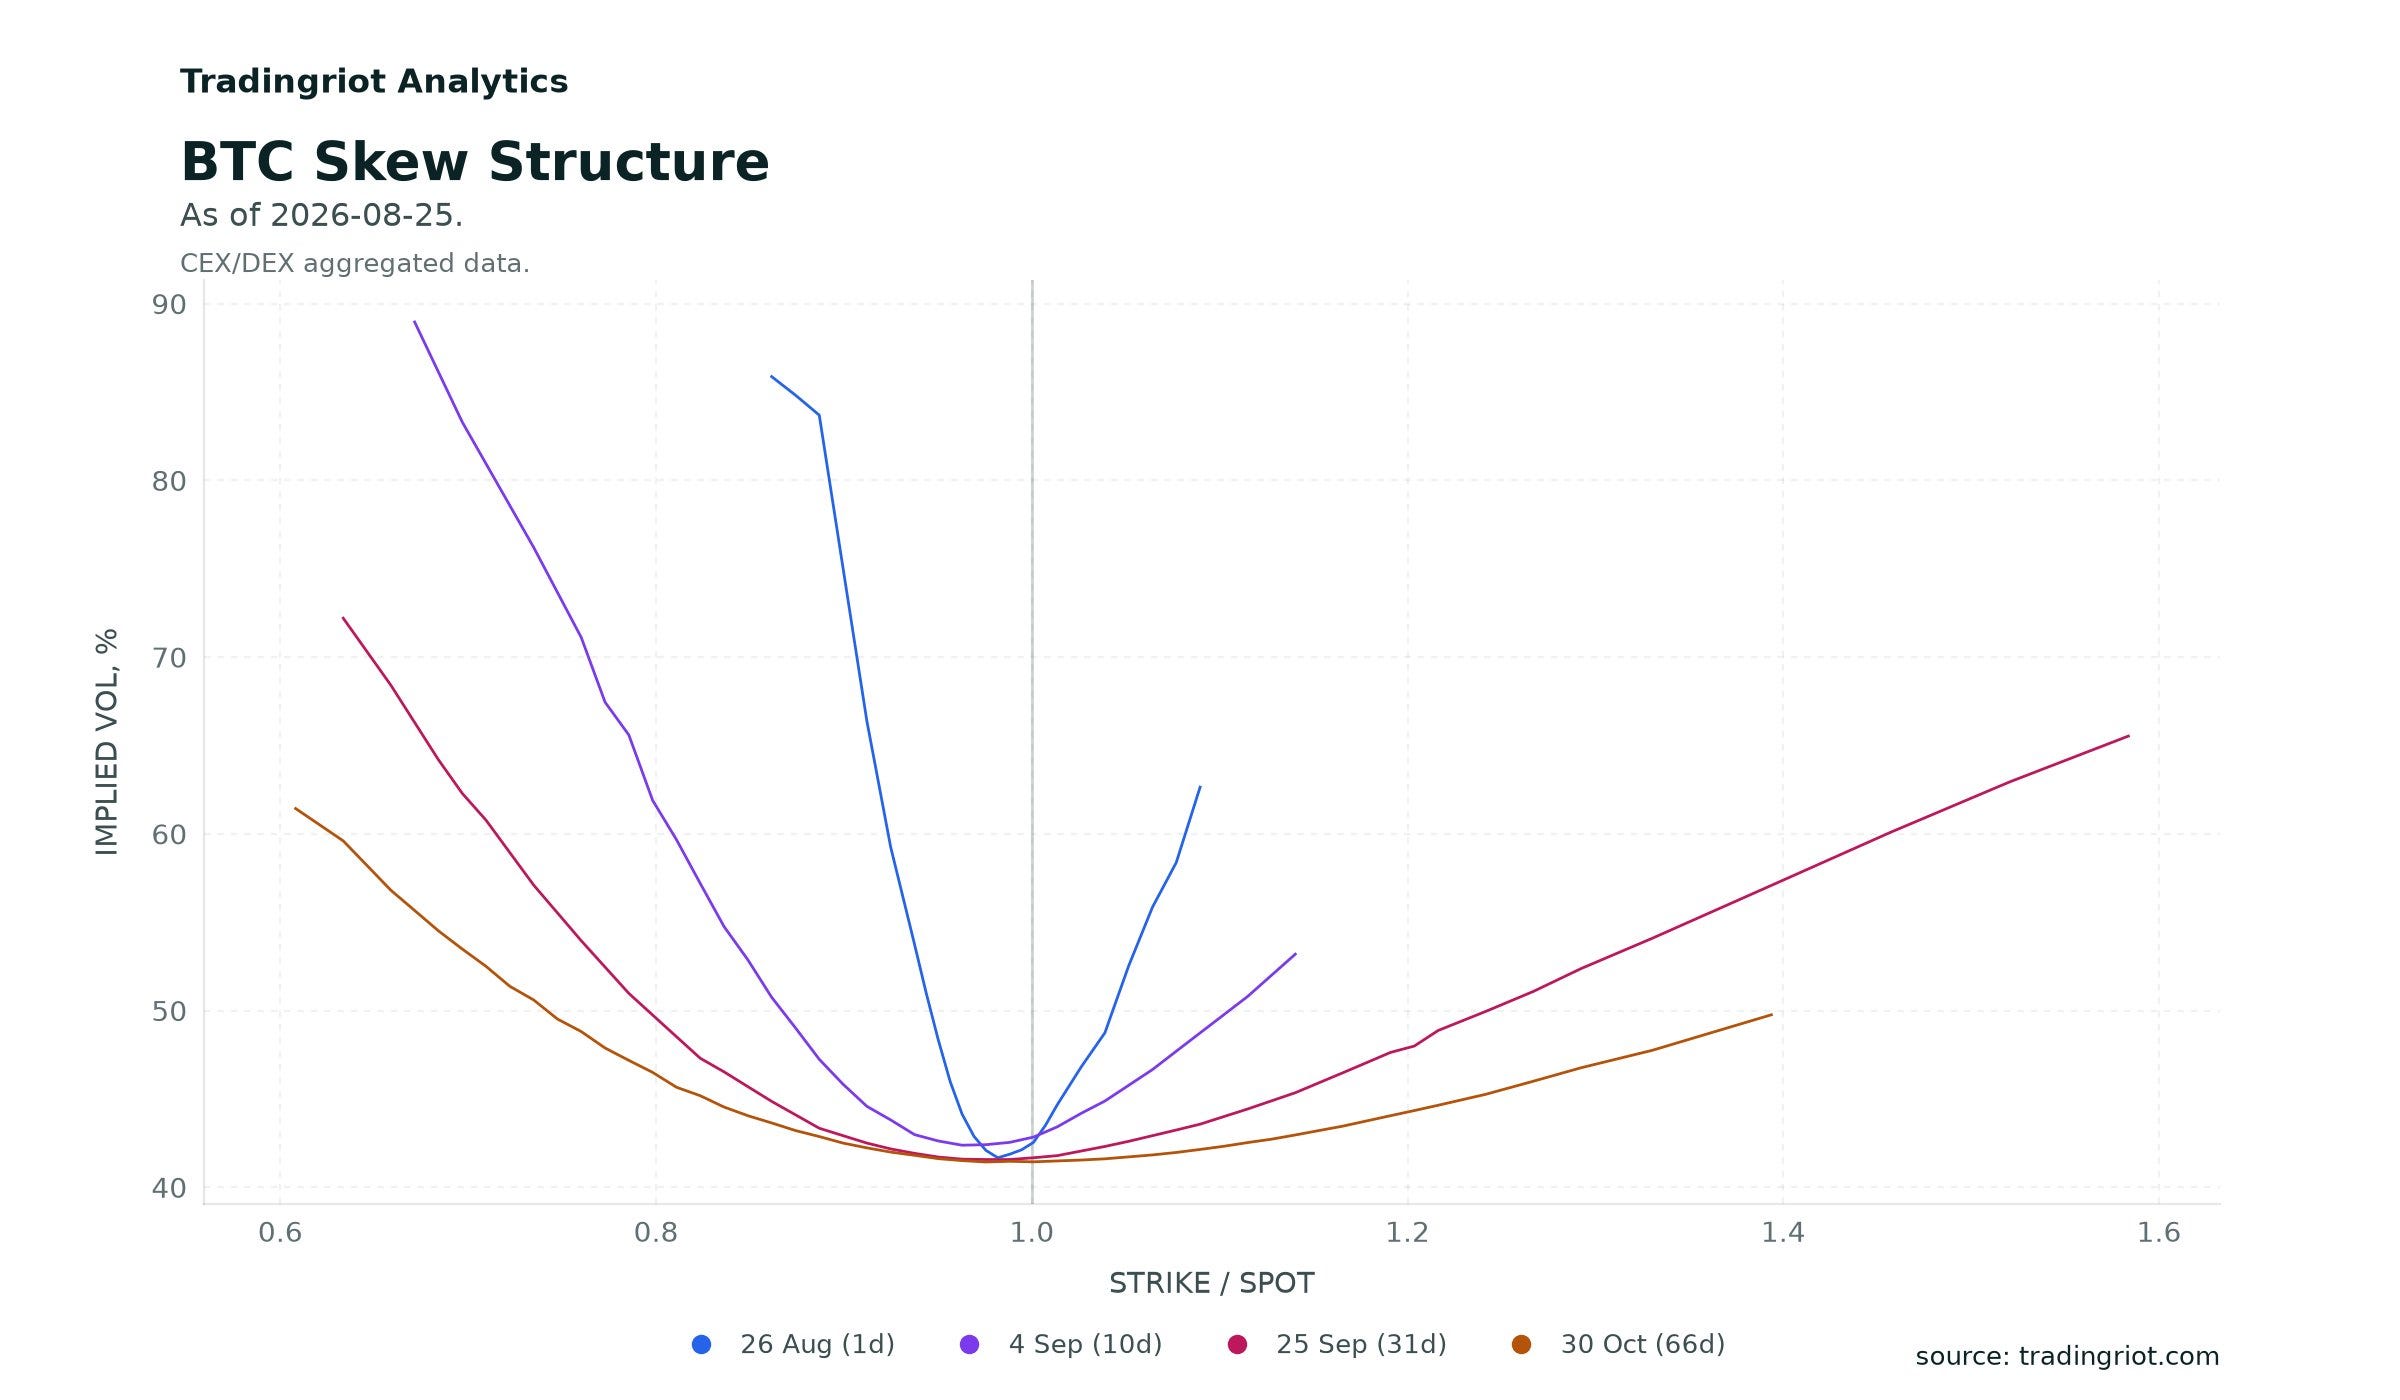
The two majors Bitcoin ran from 64k to 79k and ETH from 1.9k to 2.4k and this was apparent in options too. Bitcoin 25-delta skew closed at +4.76 vol points and ether at +6.03, the 100th and 99.5th percentiles of their years. Bitcoin turned positive on the 21st, its first positive print since 13 August of last year and ether on the 20th, its first since October. The seven-day tenor was still more extreme at +8.60 and +11.19.
Bitcoin’s seven-day realized vol bottomed on the 16th at 9.2% and the thing had basically turned into a stablecoin. It now realizes 61% over that same window against 41.6% implied. The surface is a long way behind the tape.
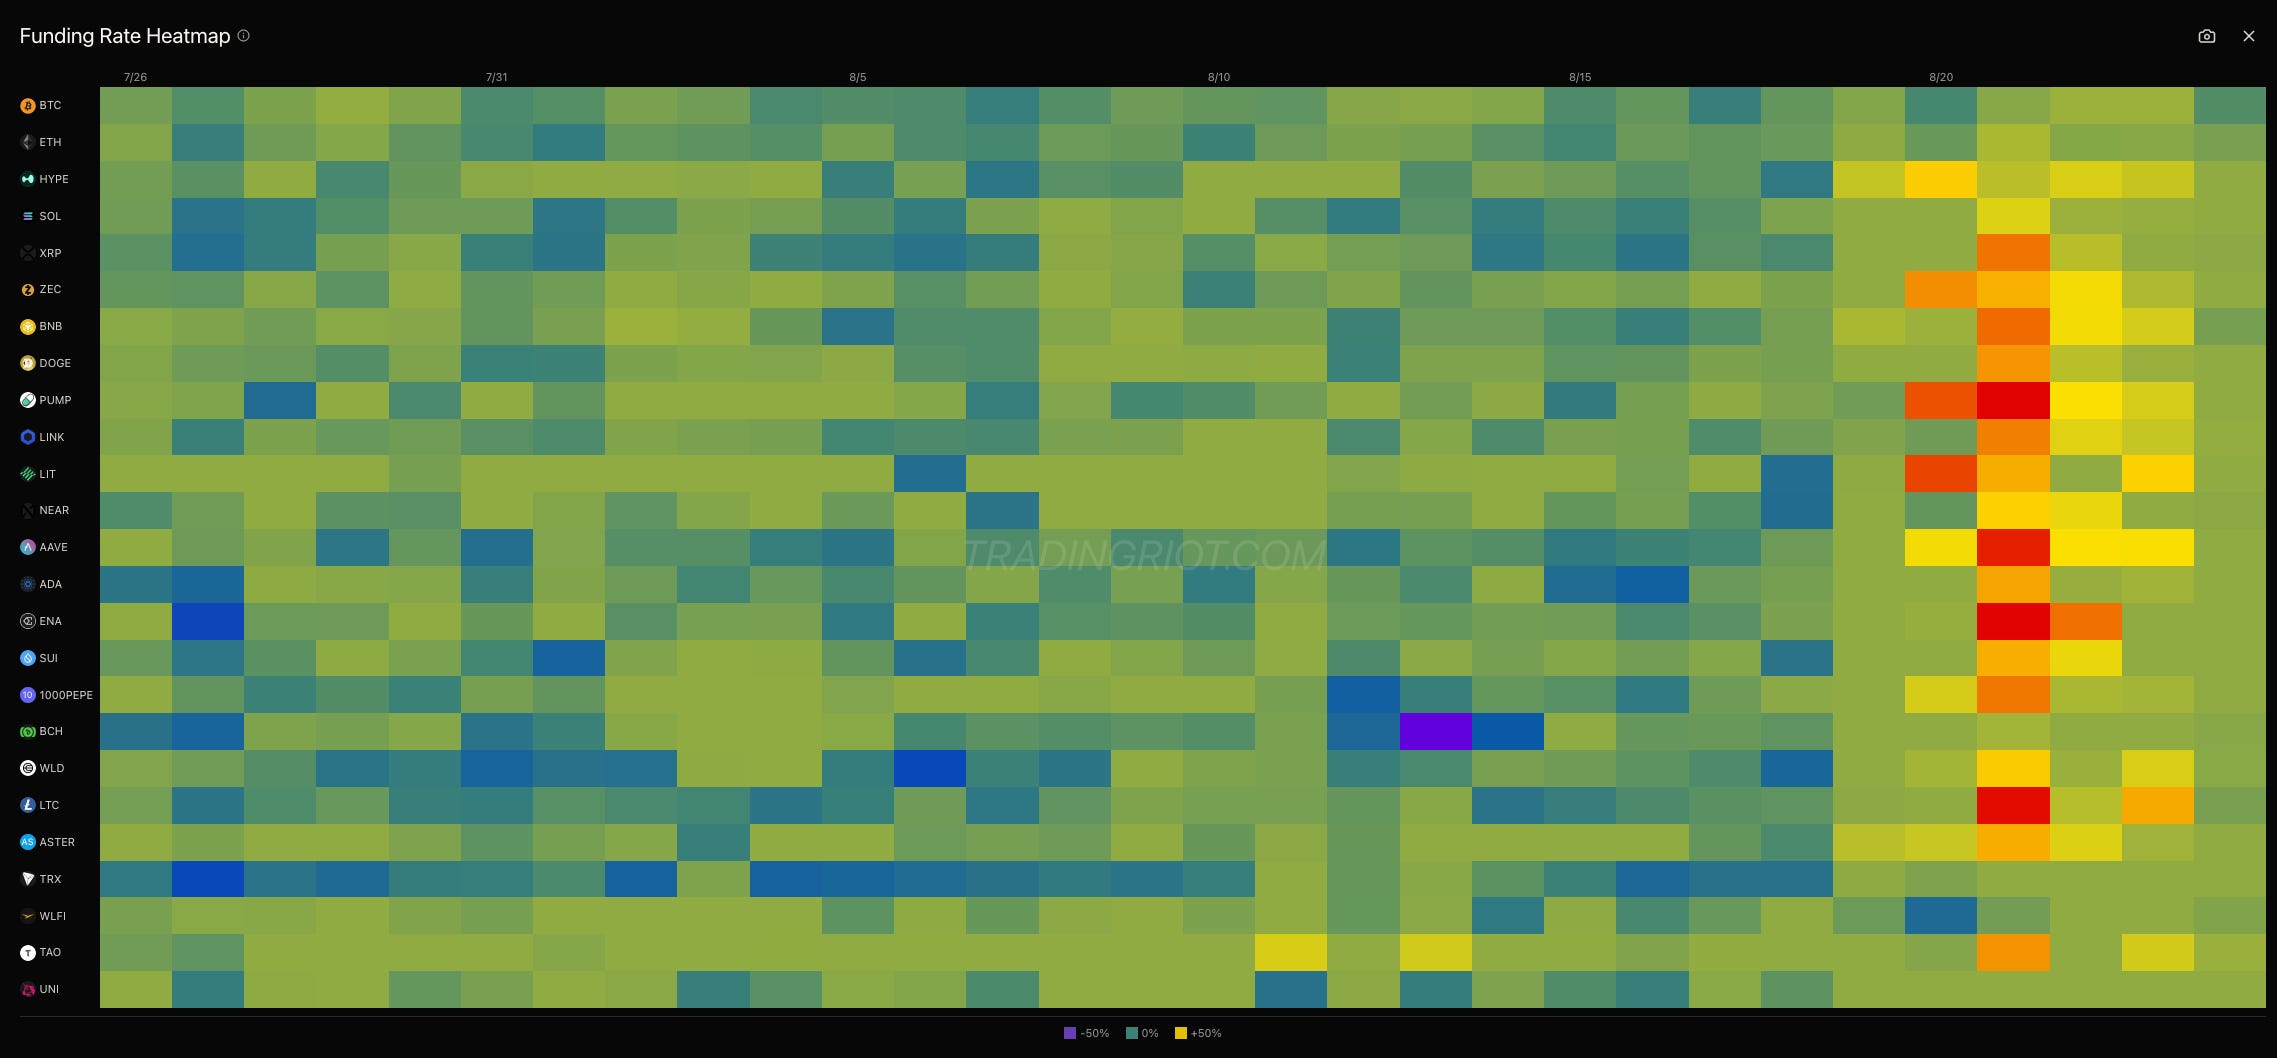
And with it went the Open Interest too. Not in entirety, this time, I suppose. Total perp book crossed & became $46.5bn, up 20.3% w-o-w. Out of the ten largest perps (above a $150m floor), open interest was added to nine of them: - $20.6bn for bitcoin, followed by ether at $12.2bn, then HYPE $2.6bn, Solana $2.3bn, XRP $1.2bn, then Zcash at $1.1bn, followed by BNB, Dogecoin, PUMP and Chainlink. In seven days, Zcash & PUMP almost doubled their books.
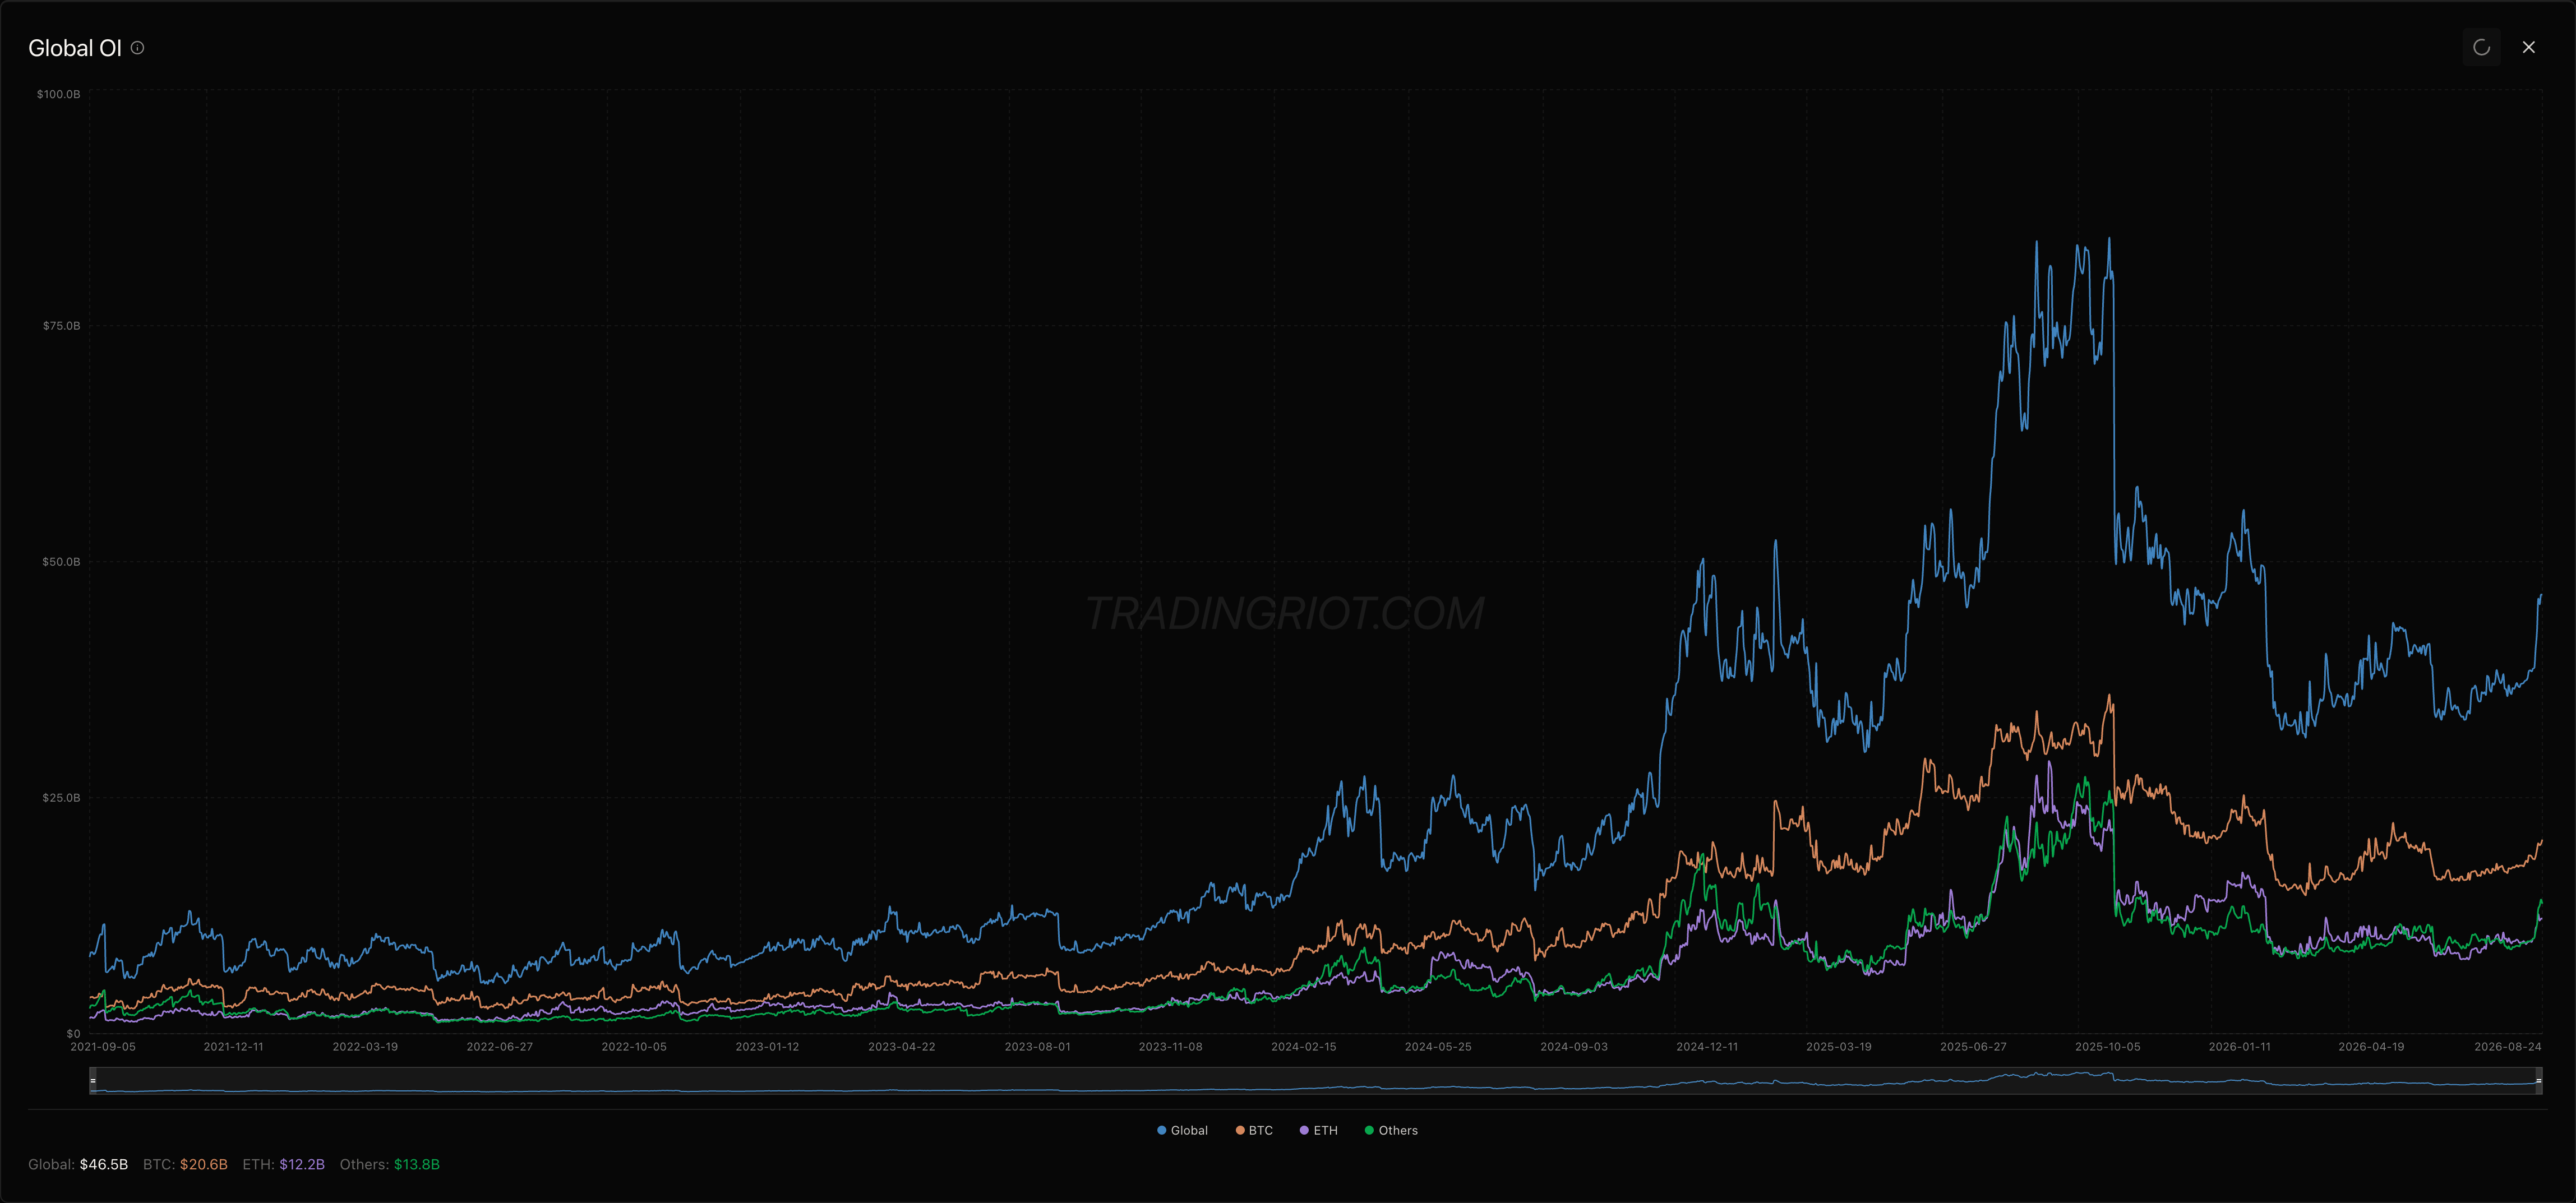
While it has made a big move, annual Bitcoin funding is hovering around 3%, with a z-score of -0.65 meaning it pays less than its norm during a 22% week. Large alts are currently sitting around 10%.
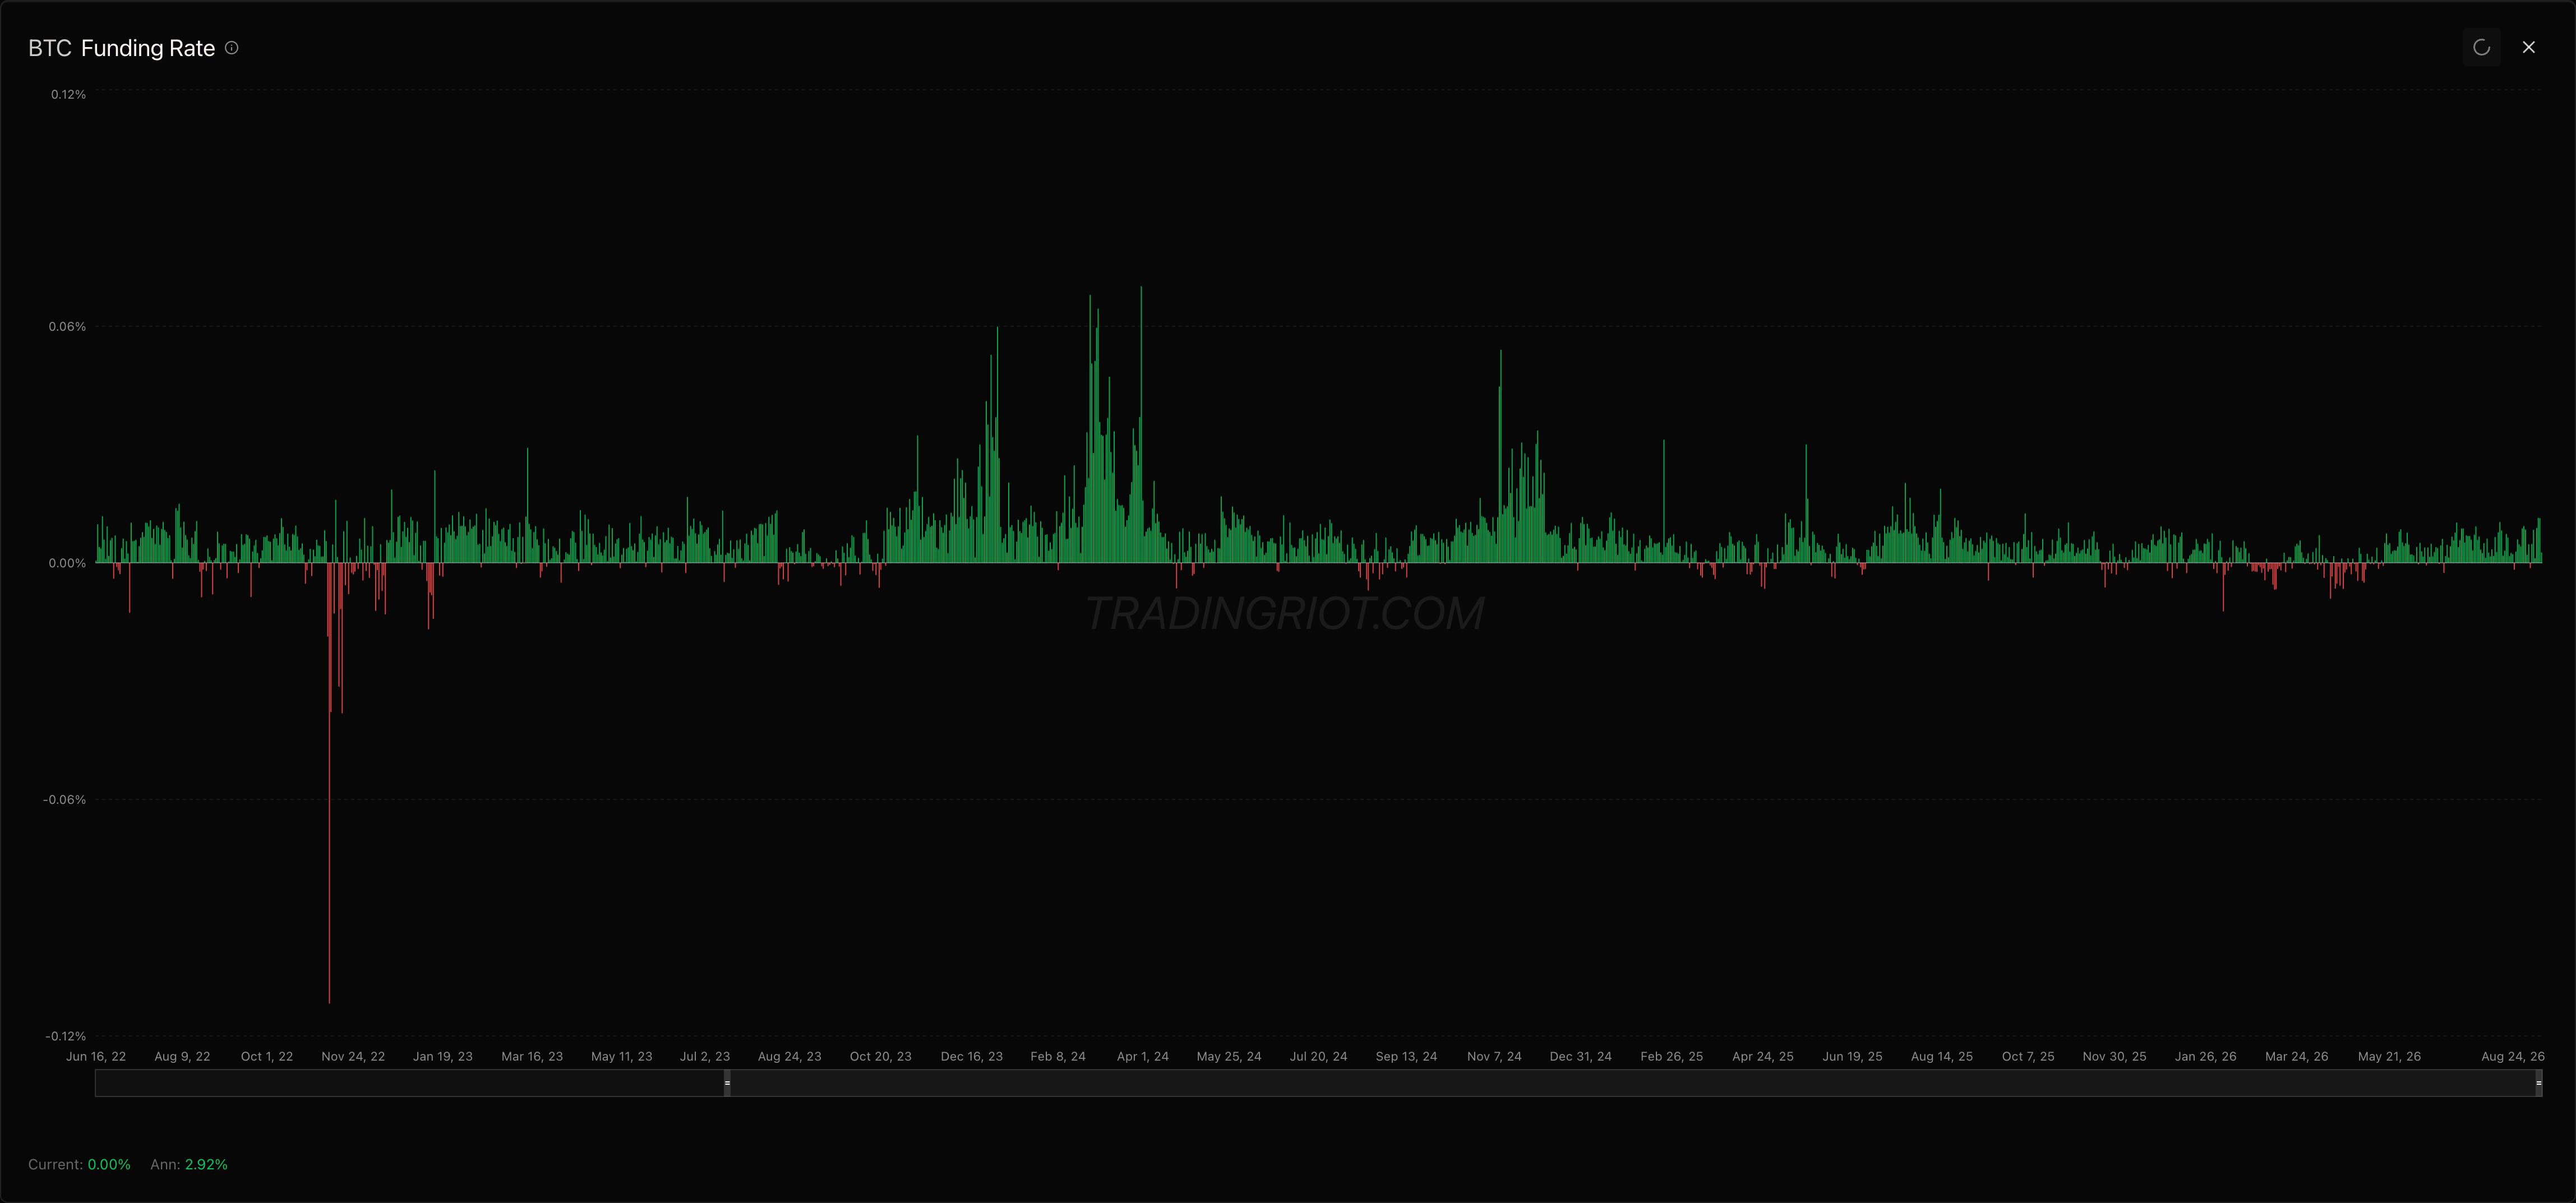
Not only four of the 137 coins have a z-score above 2, and all of them are below $50m. Most importantly, as use grew across the board, the cost of carrying it did not. This is a different setup to the squeeze and blow-off which accompanies moves like Bitcoin's latest surge.