

Whenever I am asked what I do for a living, I always respond with something around computers. I used to say I am a software engineer, but then I got once asked a software engineering question, which was really awkward but probably still less awkward than saying I am a trader.
Trading doesn’t really have a best rep these days; if you look online, you are most likely going to find some broccolihead driving a rented car claiming you can make millions by drawing a bunch of lines on a chart.
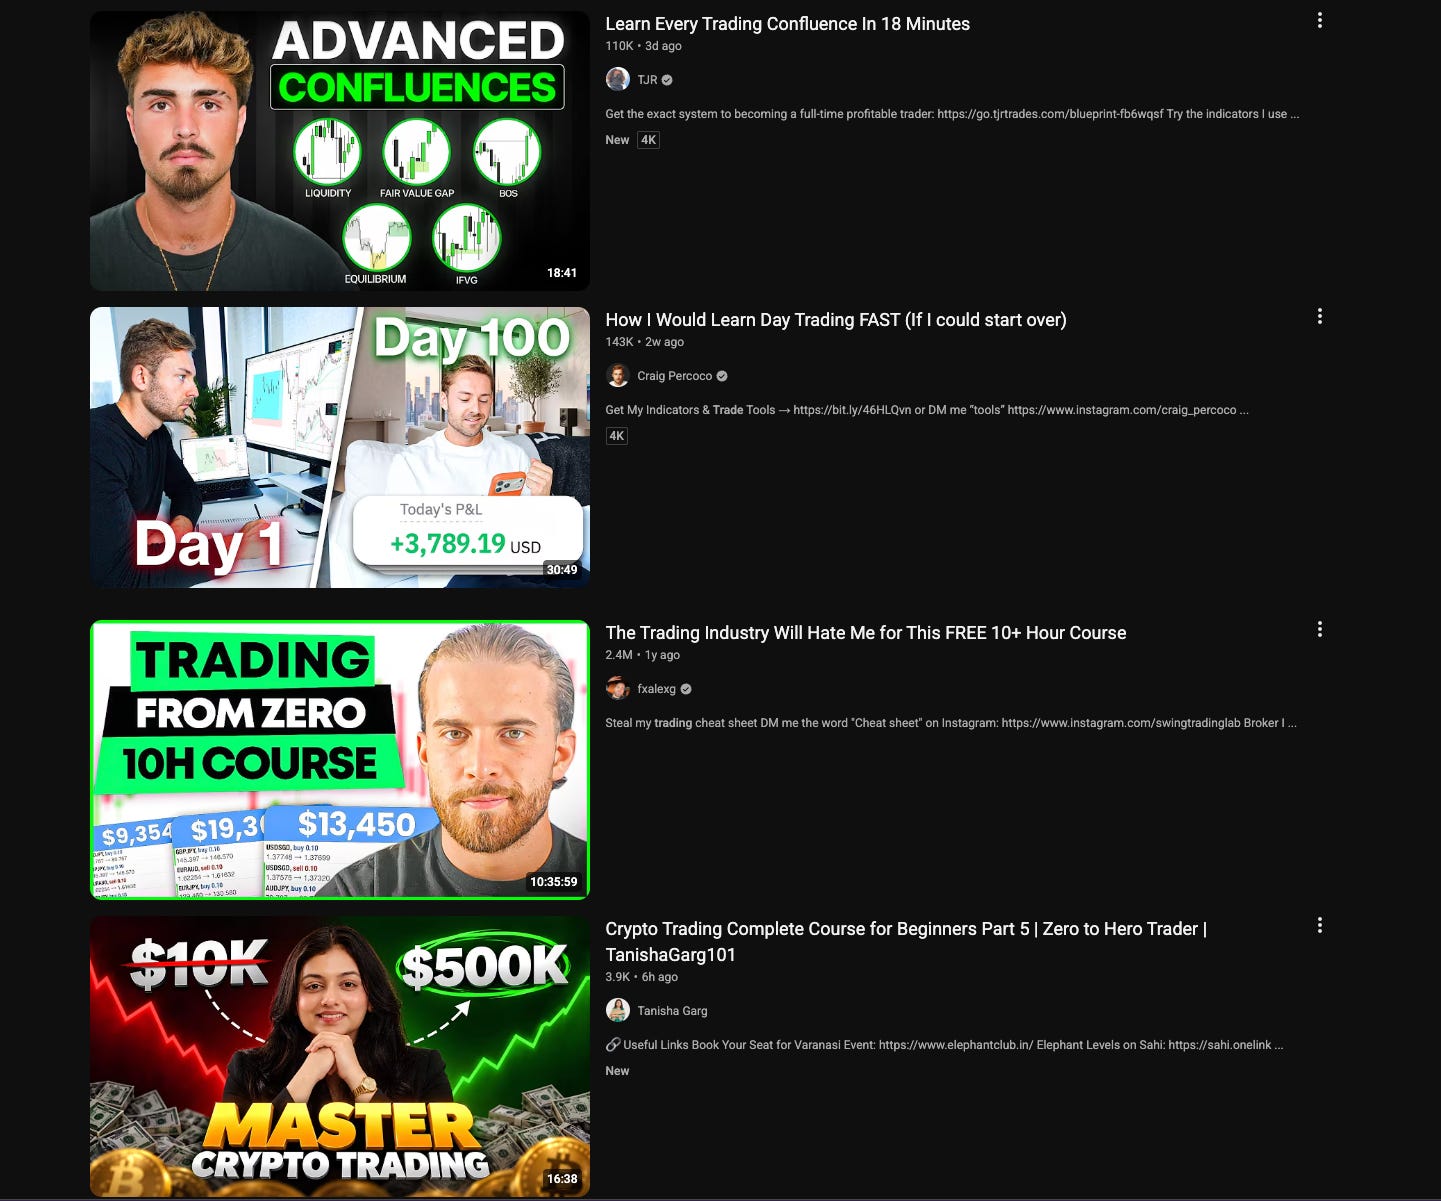
Trading is often presented as something extremely simple that you can do from anywhere in the world from your mobile device while making six figures every year. All of this simplification of financial markets also pushes people toward different ideas about why markets move in the first place.
In most cases, trading is also presented as a game of retail traders versus predatory market makers and “smart money” constantly running stops of small traders, creating liquidity in the market to initiate moves.
But is this true? Are markets this black and white, with market makers playing a hidden hand that moves the market all the time?
This is what we are going to explore in this article. Moreover, we will also dive into several concepts that I think everyone who wants to take trading seriously should understand.
It is worth mentioning that markets are definitely manipulated, and there are many ill practices happening in financial markets regardless of what market you decide to trade.
But not every single price move hides behind market manipulation. Most of them are just orders meeting other orders, which certainly does sound way less cool.
What is market microstructure?
Market microstructure is the study of the inner workings of financial markets. How they operate, how prices are formed, how traders behave, and how exchanges are structured.
Understanding it matters because you will properly understand the supply and demand dynamics behind every market movement instead of blindly buying and selling without paying attention.
Every so often you execute a trade and get filled at an entirely different price than you wanted. This is common in illiquid markets such as various altcoins or options, and it happens in liquid markets during high volatility events.
Market microstructure is a complex topic. It is lectured at universities and involves a lot of math.
Most of that math is beyond what you need, but you should understand a handful of ideas underneath it and the numbers that show those ideas at work: how these mechanics change your execution, how liquidity dries up during news, and how order book depth differs across assets.
Okay, so what is market microstructure? If you go to any exchange, it doesn't matter if it is crypto, forex, or stocks; placing a trade takes a couple of seconds. Your trade gets executed, and you are in a position.
Although this is a swift process, every market works on a system of open auctions. This means there has to be a seller for every buyer and vice versa.
Your counterparty is either another trader, an institution, an algorithm, or a market maker. Market makers especially are often presented as an evil entity that always runs the stops of retail traders.
This is not true. The market maker’s job is to stay delta neutral and capture the bid-ask spread. Delta represents directional exposure to the underlying. If you buy stocks, crypto, or options, you have a delta one position: you are directly affected when the underlying moves. If you are delta neutral, you are not.
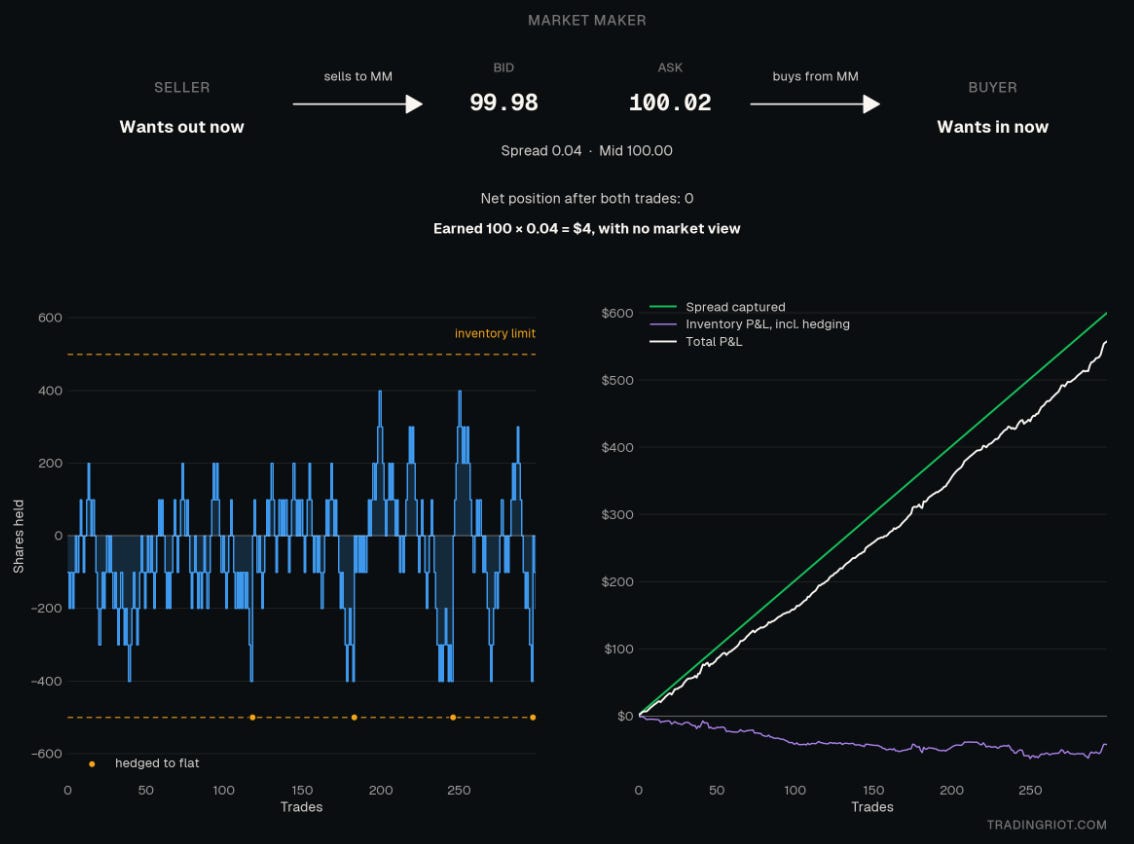
Similar to options traders, who are often delta neutral because they trade volatility, or traders who trade carry trades, market makers are delta neutral to capture spreads.
We will come back to market makers later. First, what moves the market in the first place?
What truly moves the markets?
Markets move based on supply and demand. When buyers and sellers agree on fair prices, markets are in equilibrium. In other words, they range. When there is an imbalance, markets trend.
You frequently hear that a market went somewhere because there were more buyers than sellers, or vice versa.
This is not true, because of the open auction I mentioned. For every trade executed, there has to be a counterparty. For every buyer, there has to be a seller.
What changes is the balance between two kinds of orders.
Liquidity is the number of orders resting in the order book, waiting. Volume is the number of orders that got executed. Markets move when aggressive orders (market orders) meet resting orders (limit orders), and how far they move depends on how much is resting.
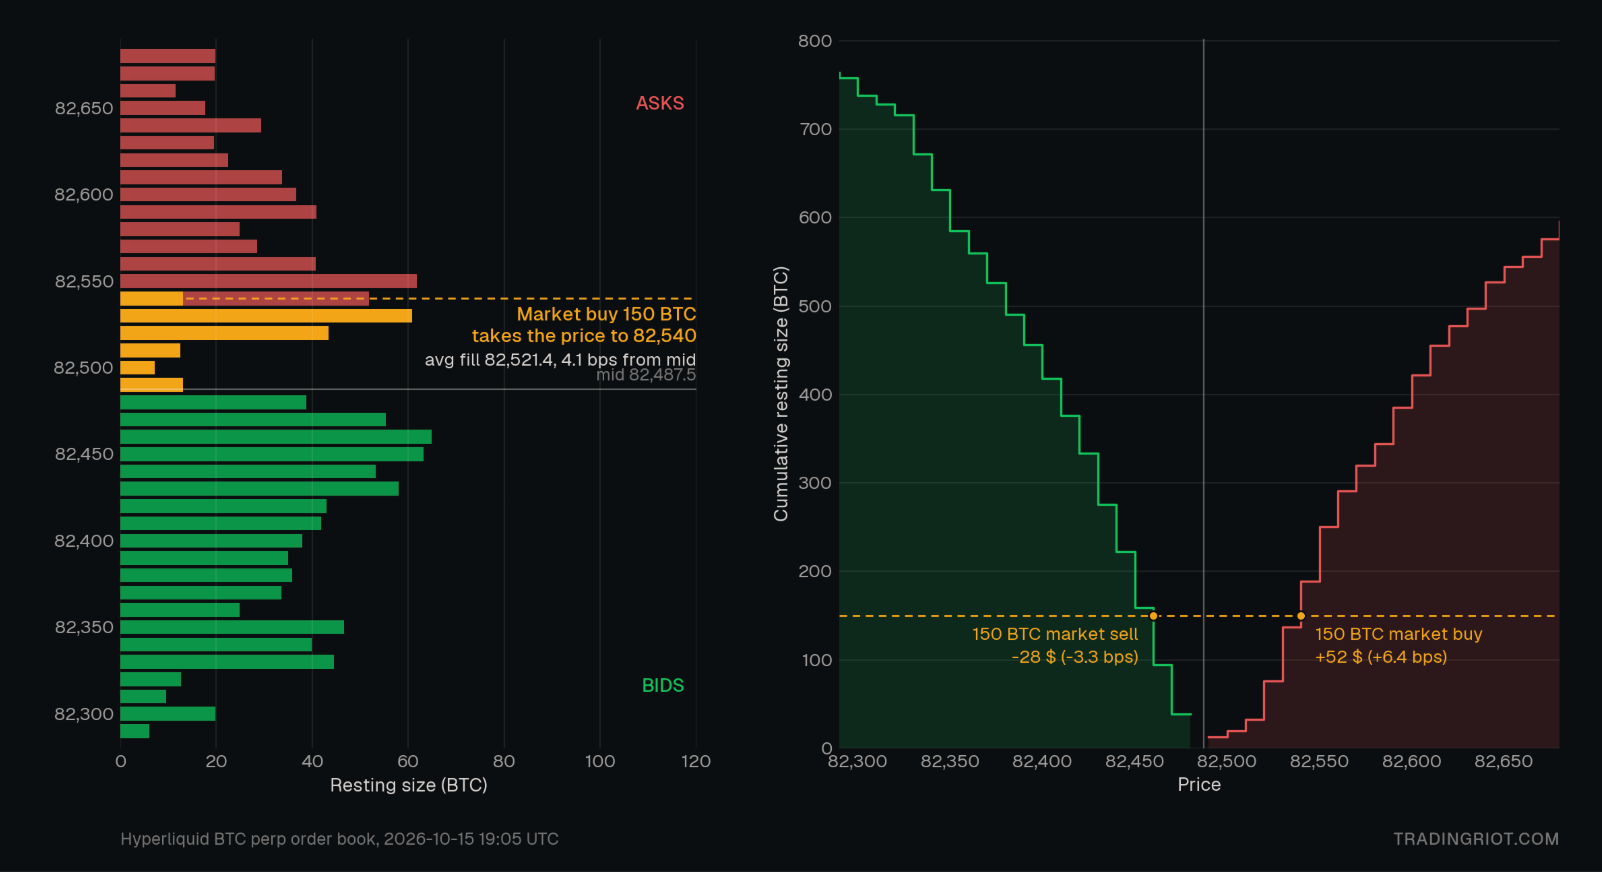
Some markets move a lot; some don’t move at all.
Imagine you bought Bitcoin and your position is up 5% on the day. That is wonderful, but you skipped buying Solana, which ended up 15% off on the day, but why?
Volatility is a function of available liquidity. Less liquid markets, with fewer orders resting in the book, get pushed around much more easily than markets with well-populated books.
If Bitcoin has $10m resting on each side within 1% of the price and Solana has $2m, the same $5m of aggressive buying moves Solana a lot more.
To see it in real data, I took a snapshot of the order books for BTC, ETH, SOL, XRP, and HYPE perps on Hyperliquid and pushed the same market buy through each one.
The left chart shows the price impact of that order as it grows. Bitcoin absorbs it with the smallest impact, and ETH comes next. Sol and XRP move noticeably more for the same size, and HYPE moves the most. The ranking follows how much is resting near the price: Bitcoin has by far the deepest book, and each coin down the list has less.
The right chart puts that depth next to volatility. The thinner the book, the more volatile the coin has been over the last six months.
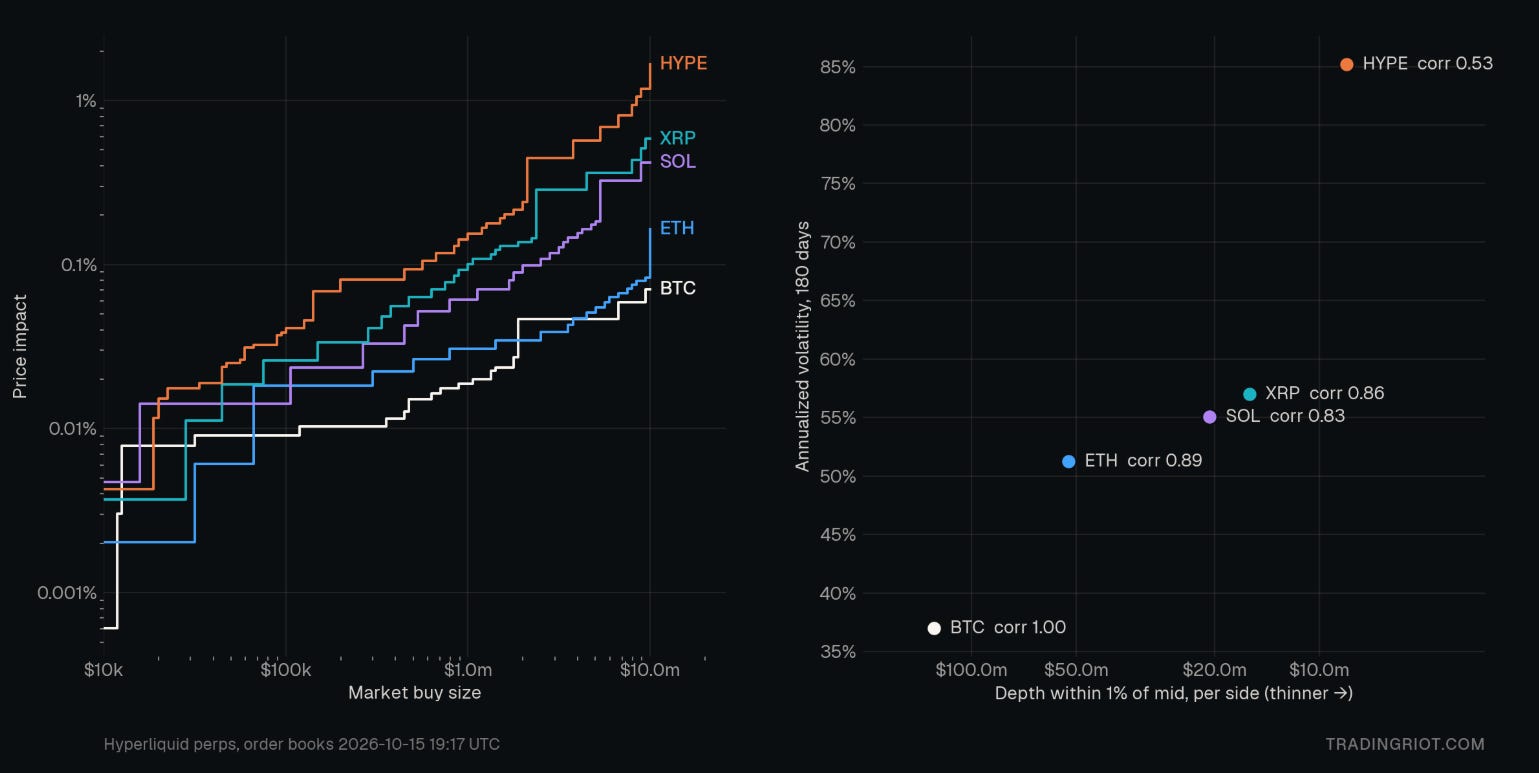
Since correlation in crypto is very high, most coins move together a lot. When macro news or something else moves BTC, the same flow hits all of them at once. The buying that lifts Bitcoin a few percent runs into a much thinner book in SOL and pushes it further. That is why altcoins tend to move more than Bitcoin in both directions.
This is also why during the fun events like the 10th of October 2025, most altcoin holders were sent four tax brackets lower since the liquidity basically disappeared when it was needed the most.
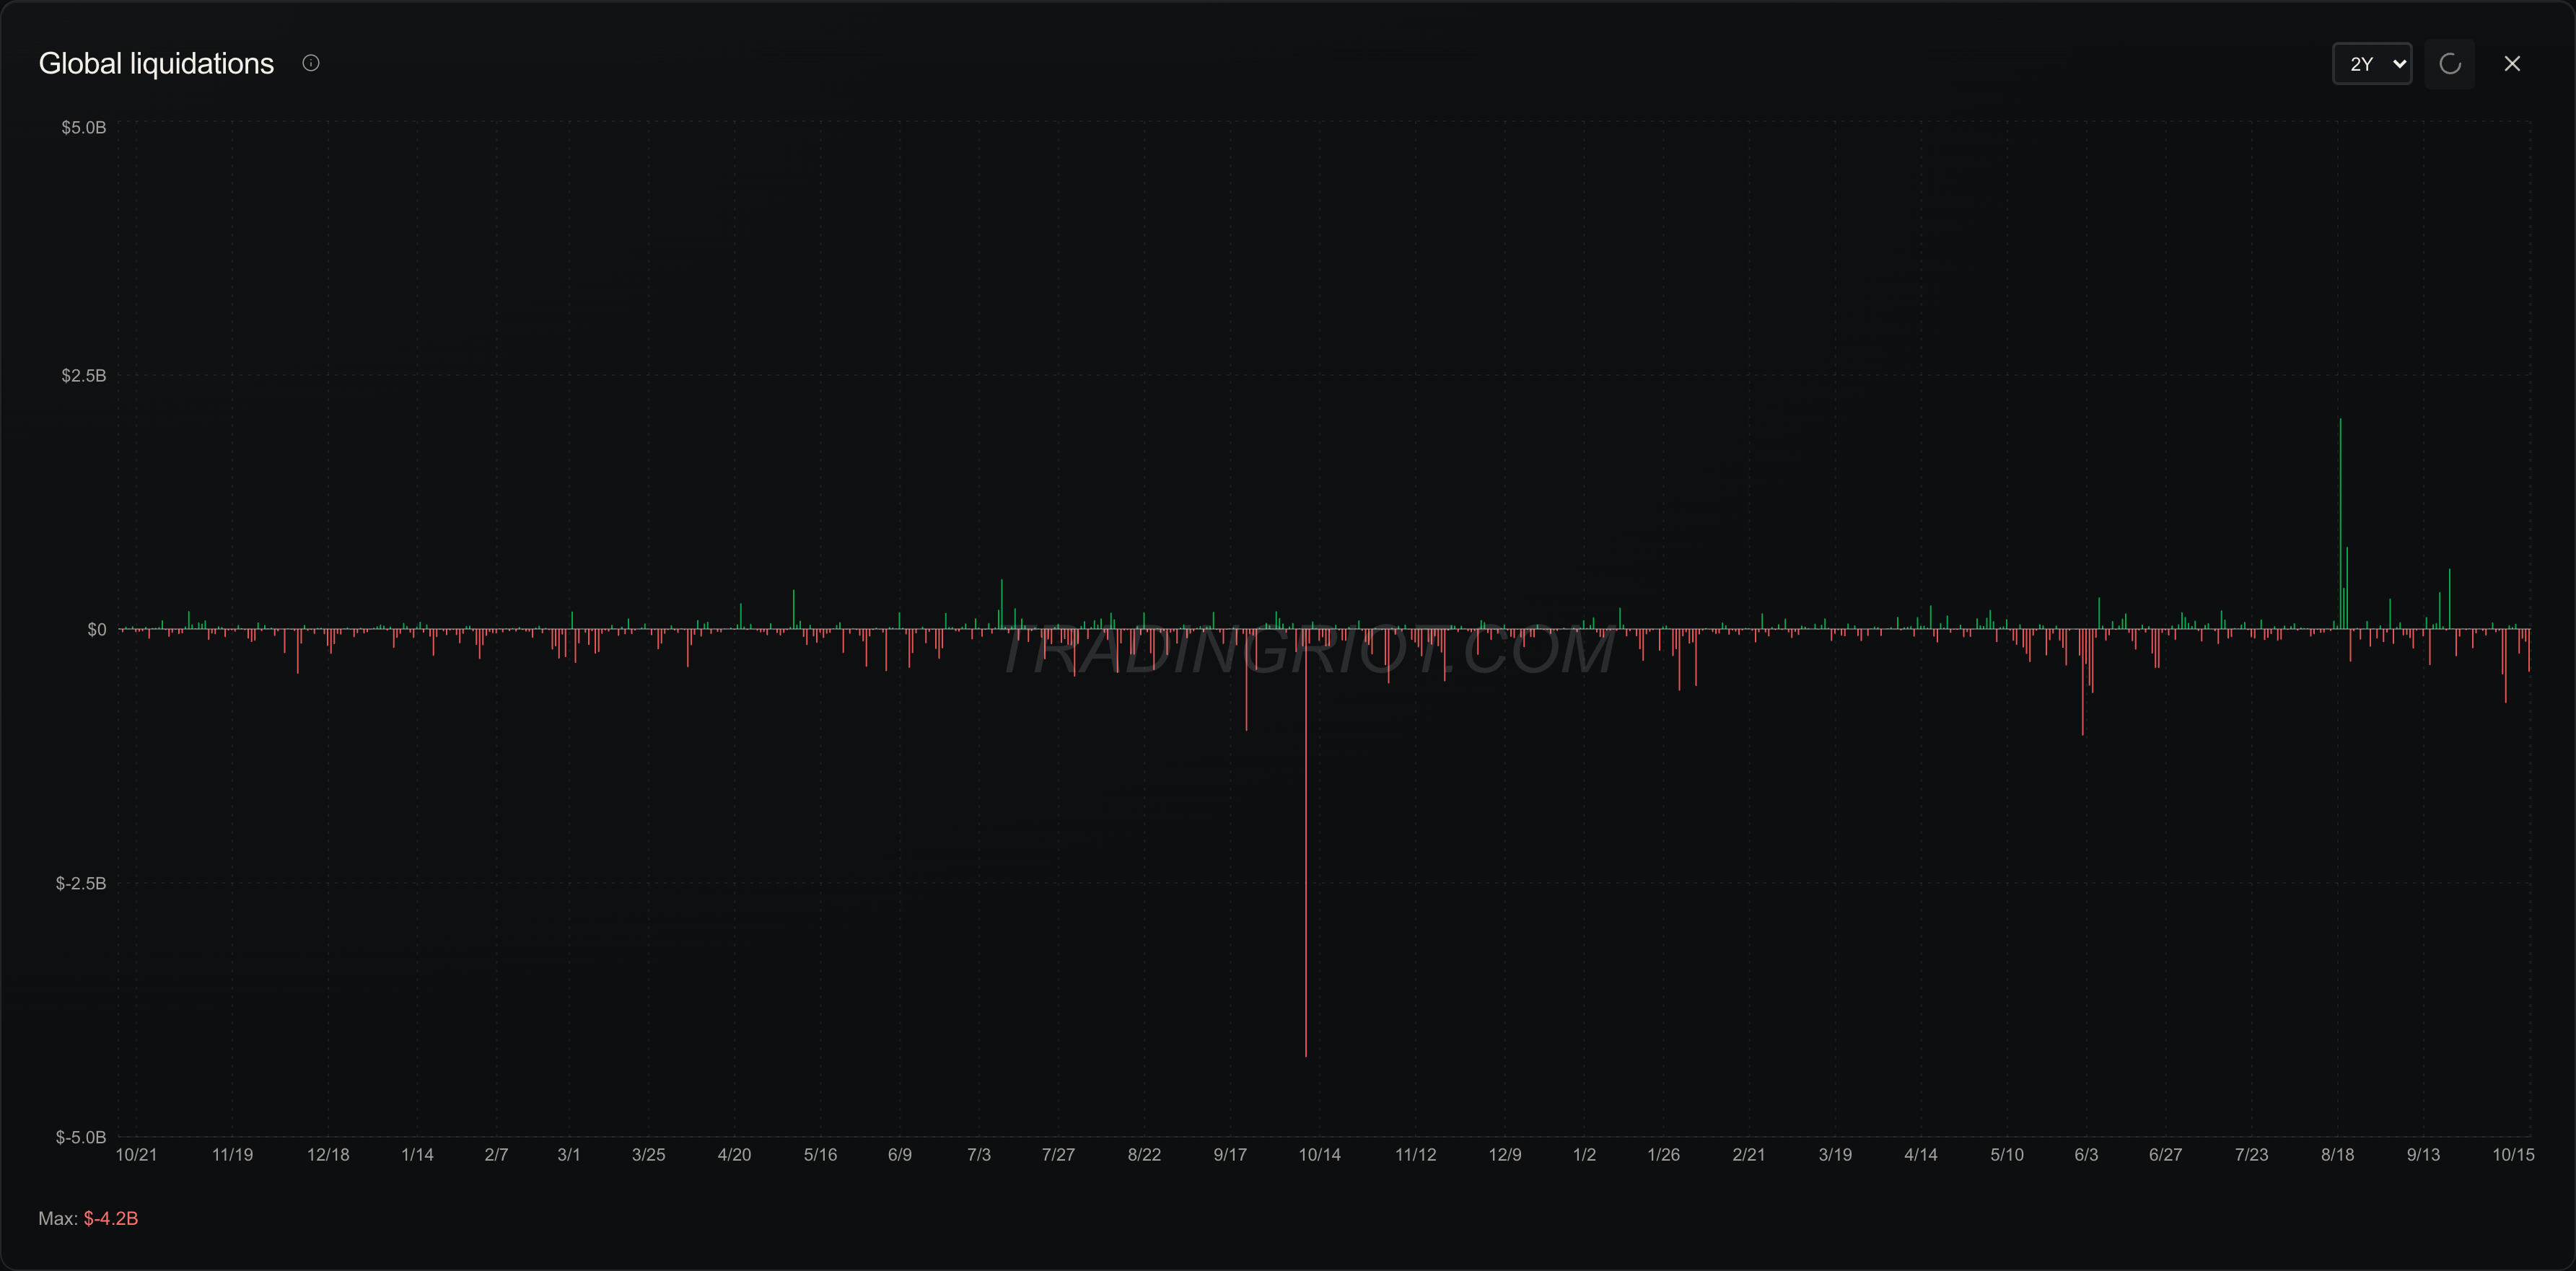
This same relationship exists in equity indices, stocks, commodities, and FX.
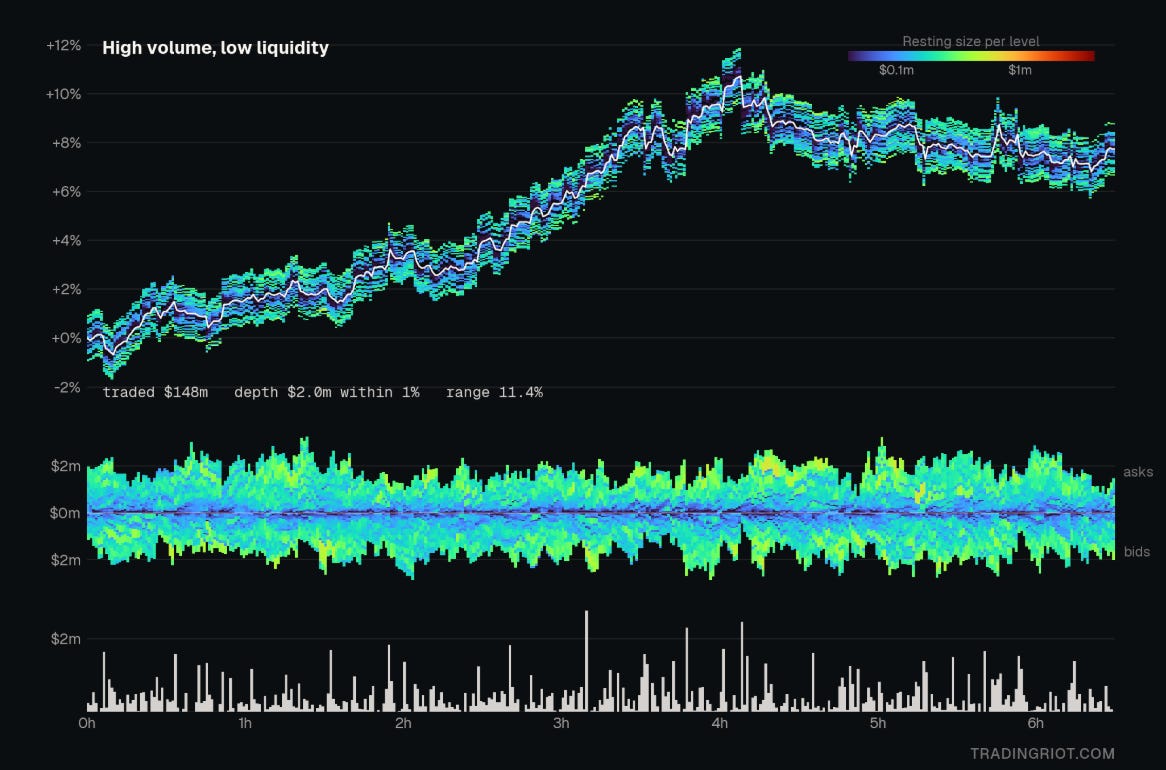
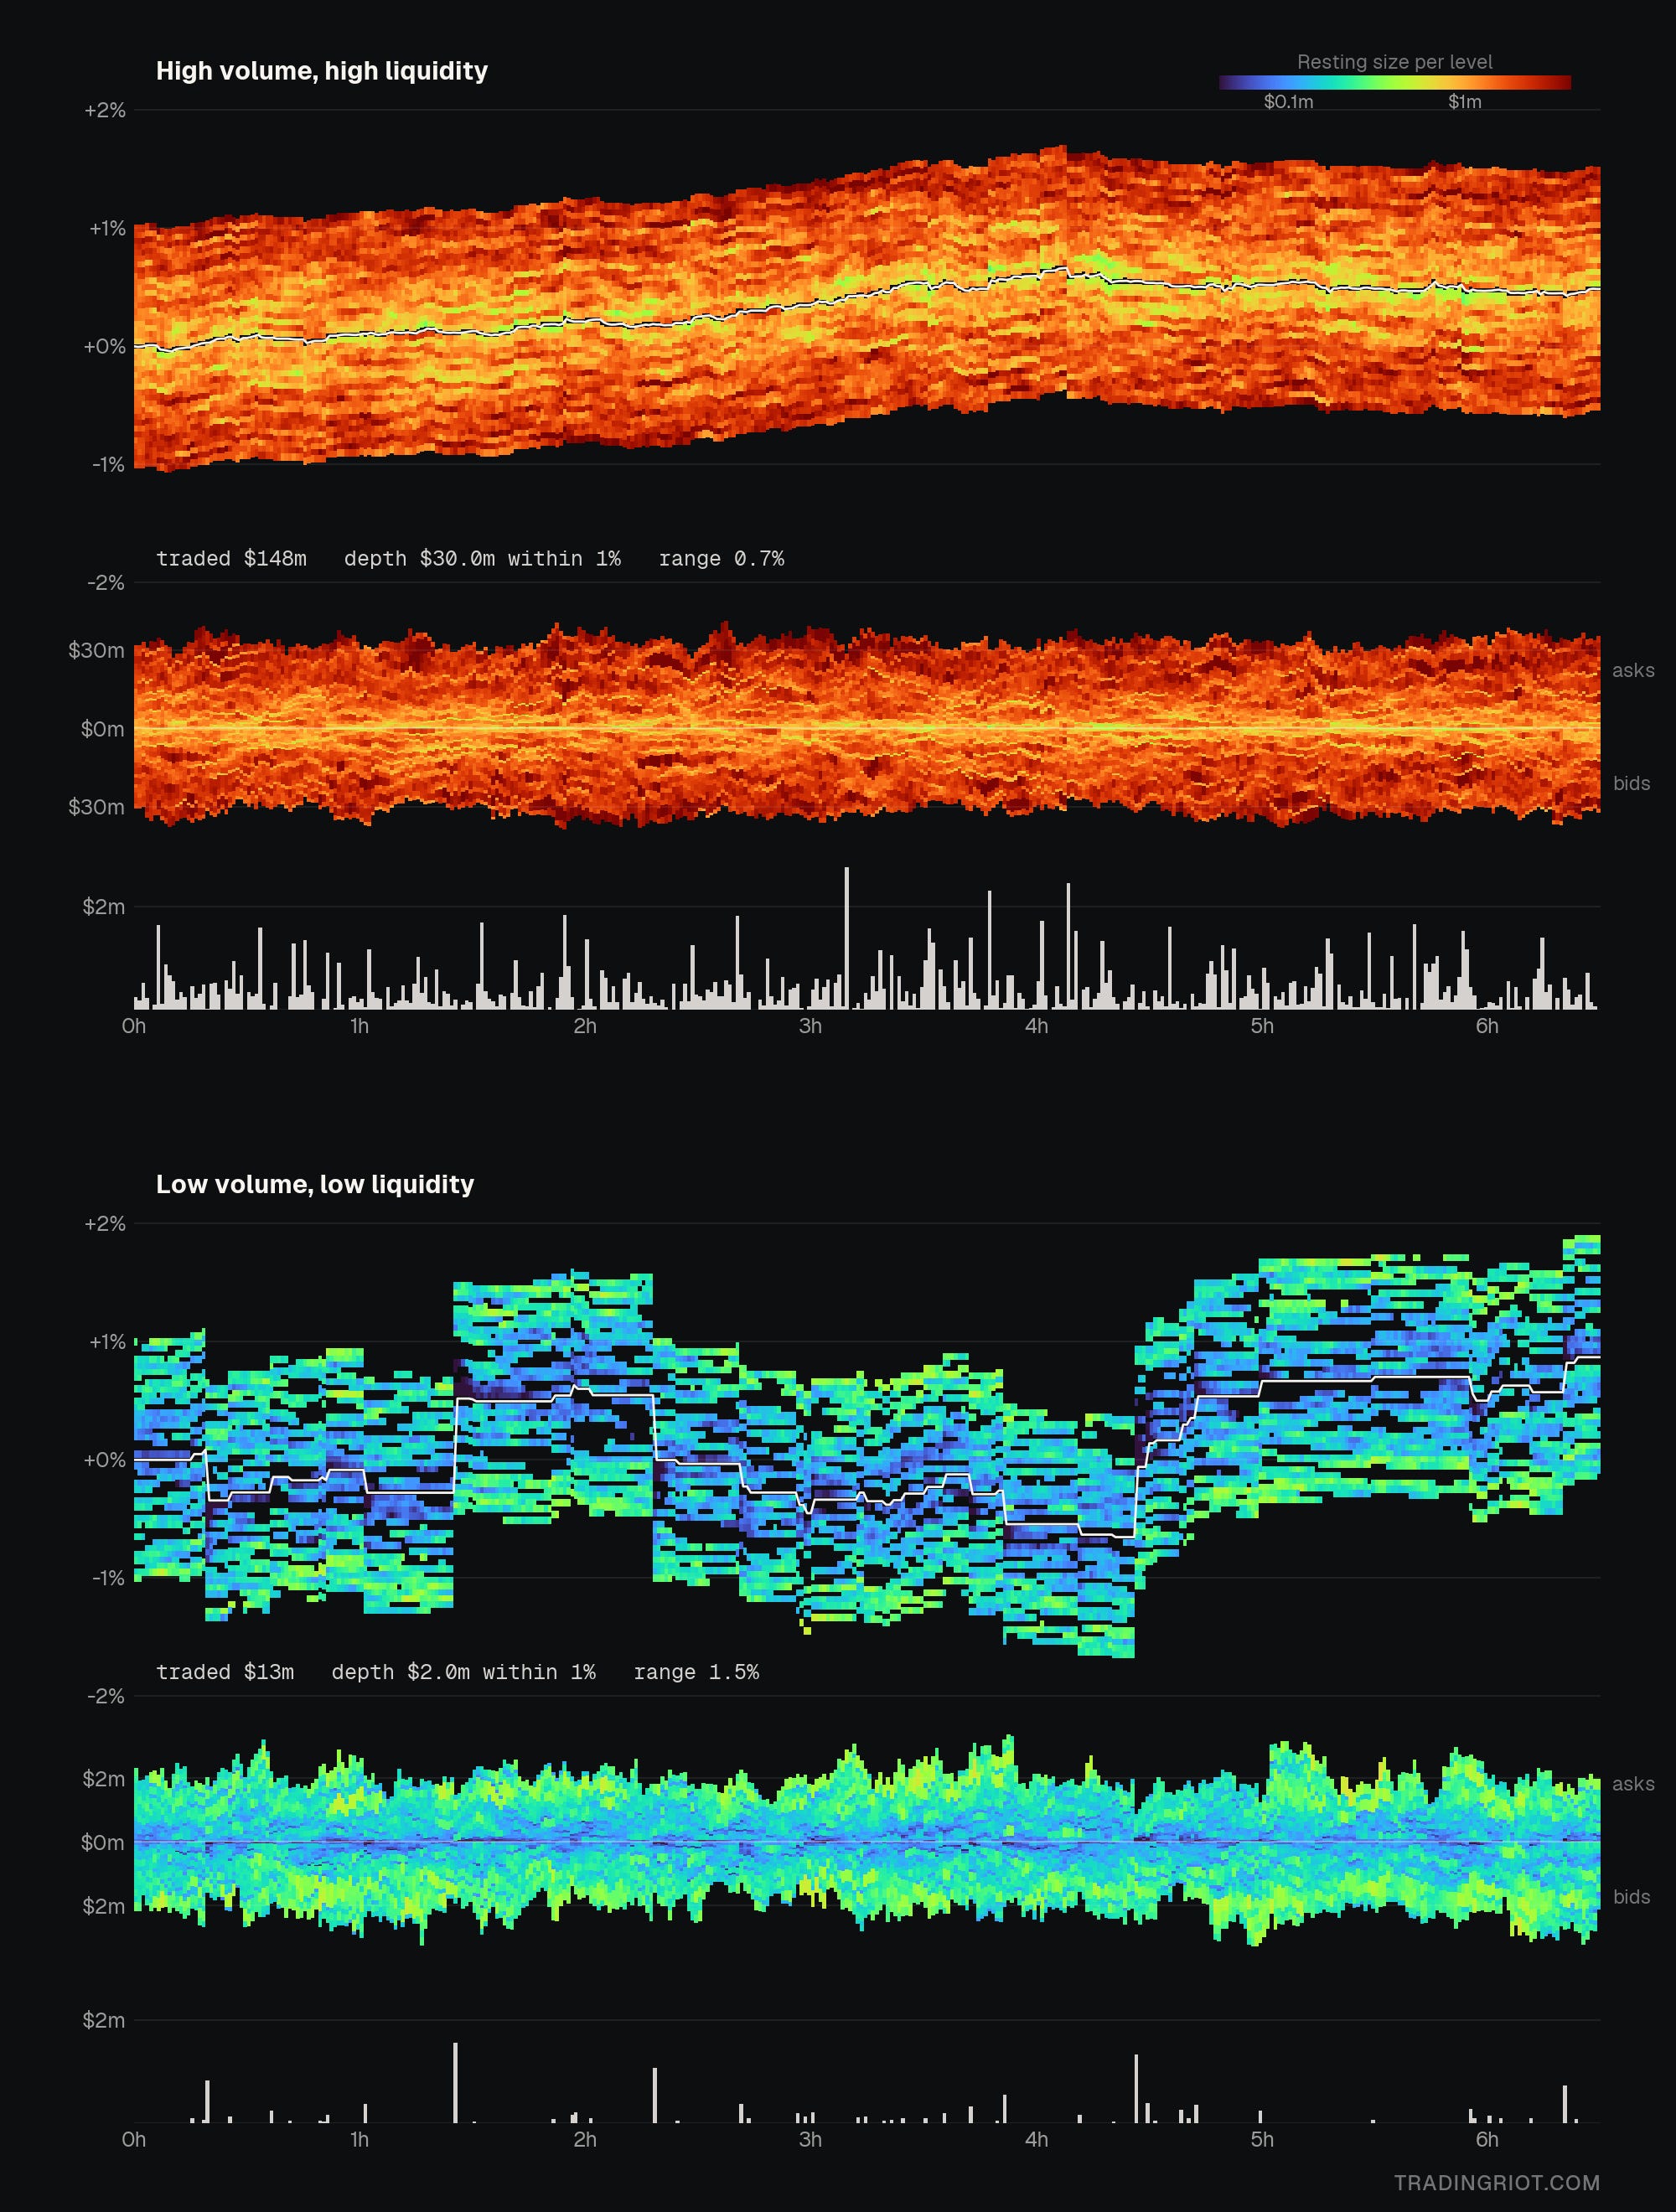
In general, markets can be separated into four categories based on their volume and liquidity.
High volume, low liquidity
These markets move a lot. There is a lot of aggression coming into a market that doesn’t have enough resting orders to take the other side. This leads to gaps and slippage. If liquidity is provided only by HFT algorithms, you get a flash crash. In crypto, you get a liquidation cascade: the only “liquidity” is ongoing forced liquidations with no real buyers on the other side.
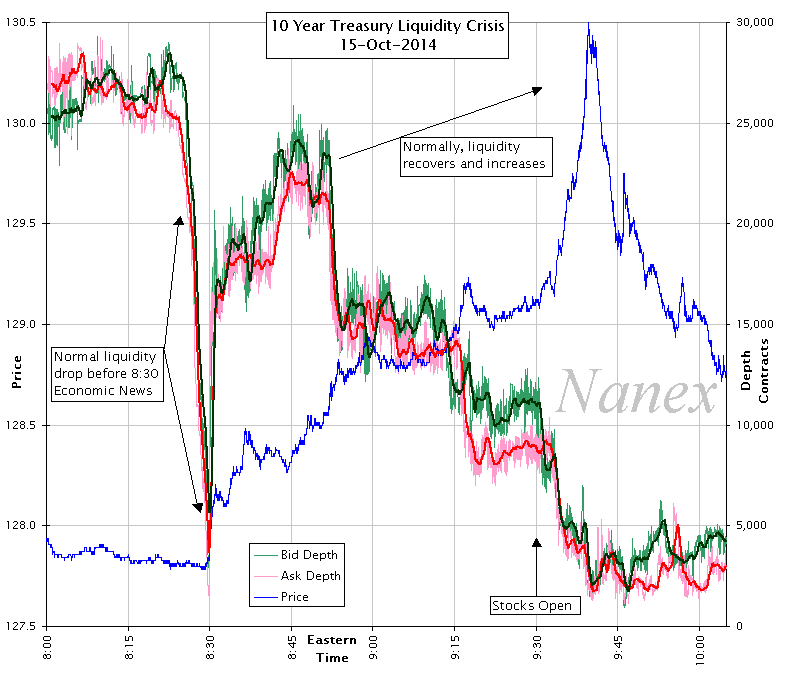
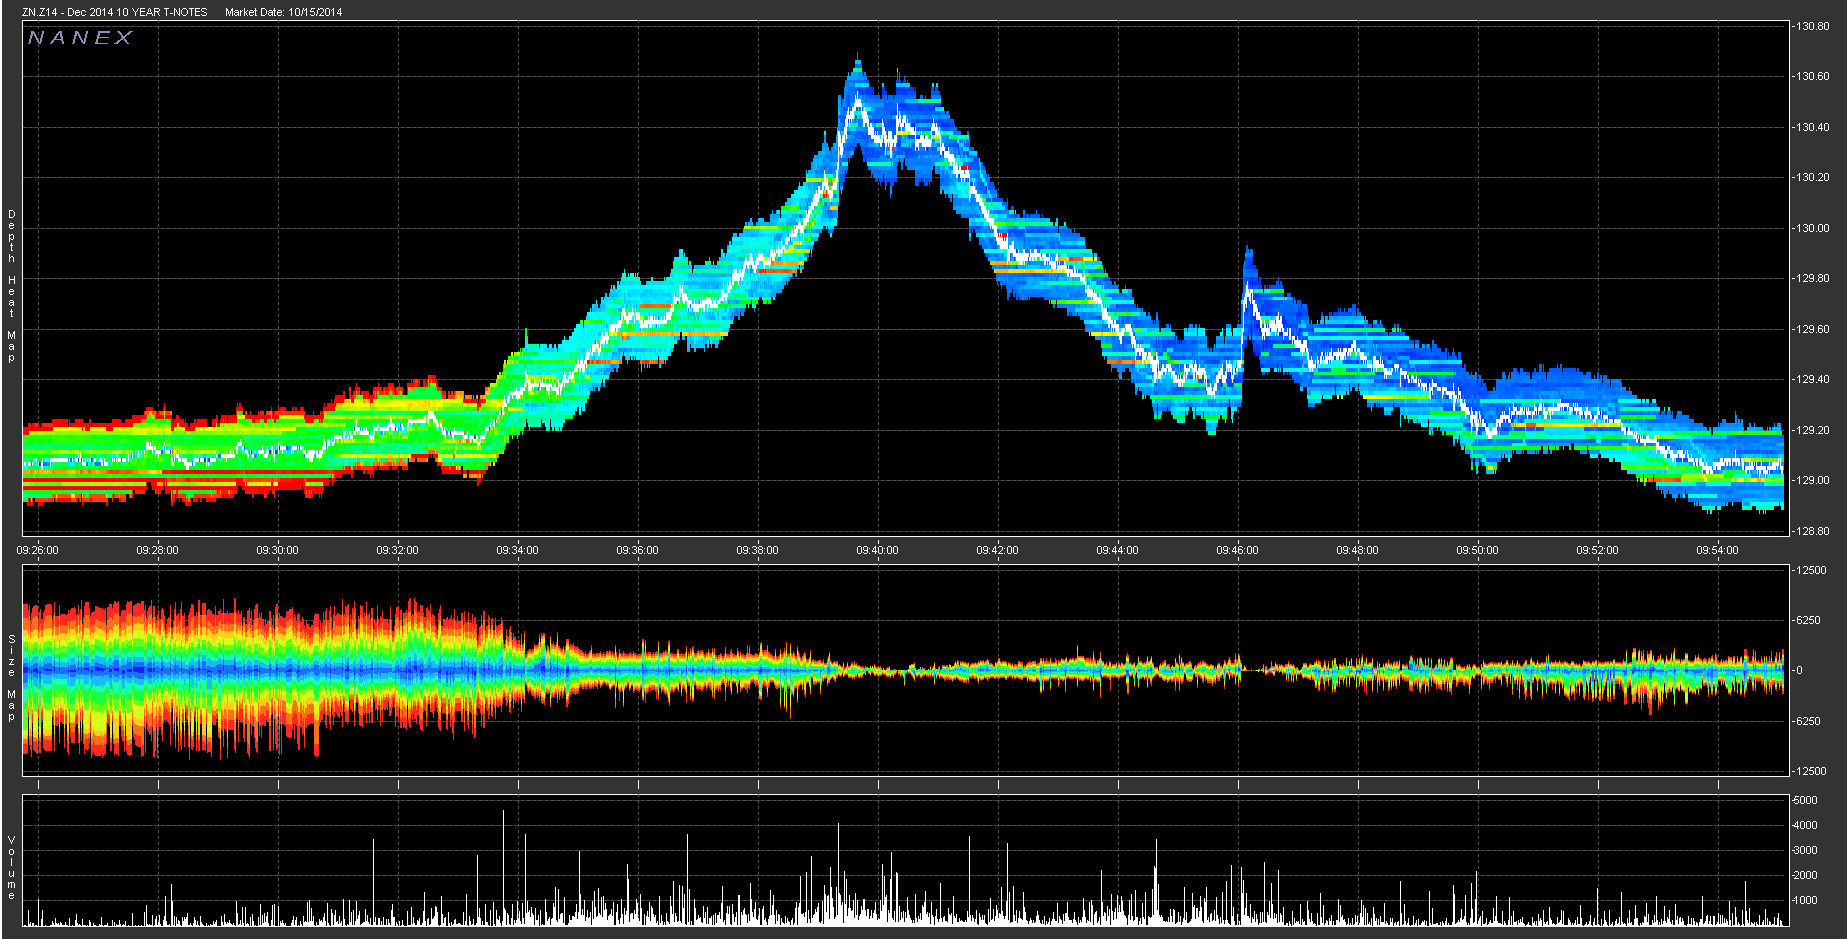
For some real market examples, here is a chart from Nanex showing the 10 year treasury futures during the high-impact news.
Low volume, high liquidity
The opposite extreme. Very thick markets such as Treasury futures. The book is so well populated that it takes a large amount of buying or selling to move the price in any significant way, and little aggression arrives to try. Each order takes a small bite out of a deep book, and the book refills before the next one comes.
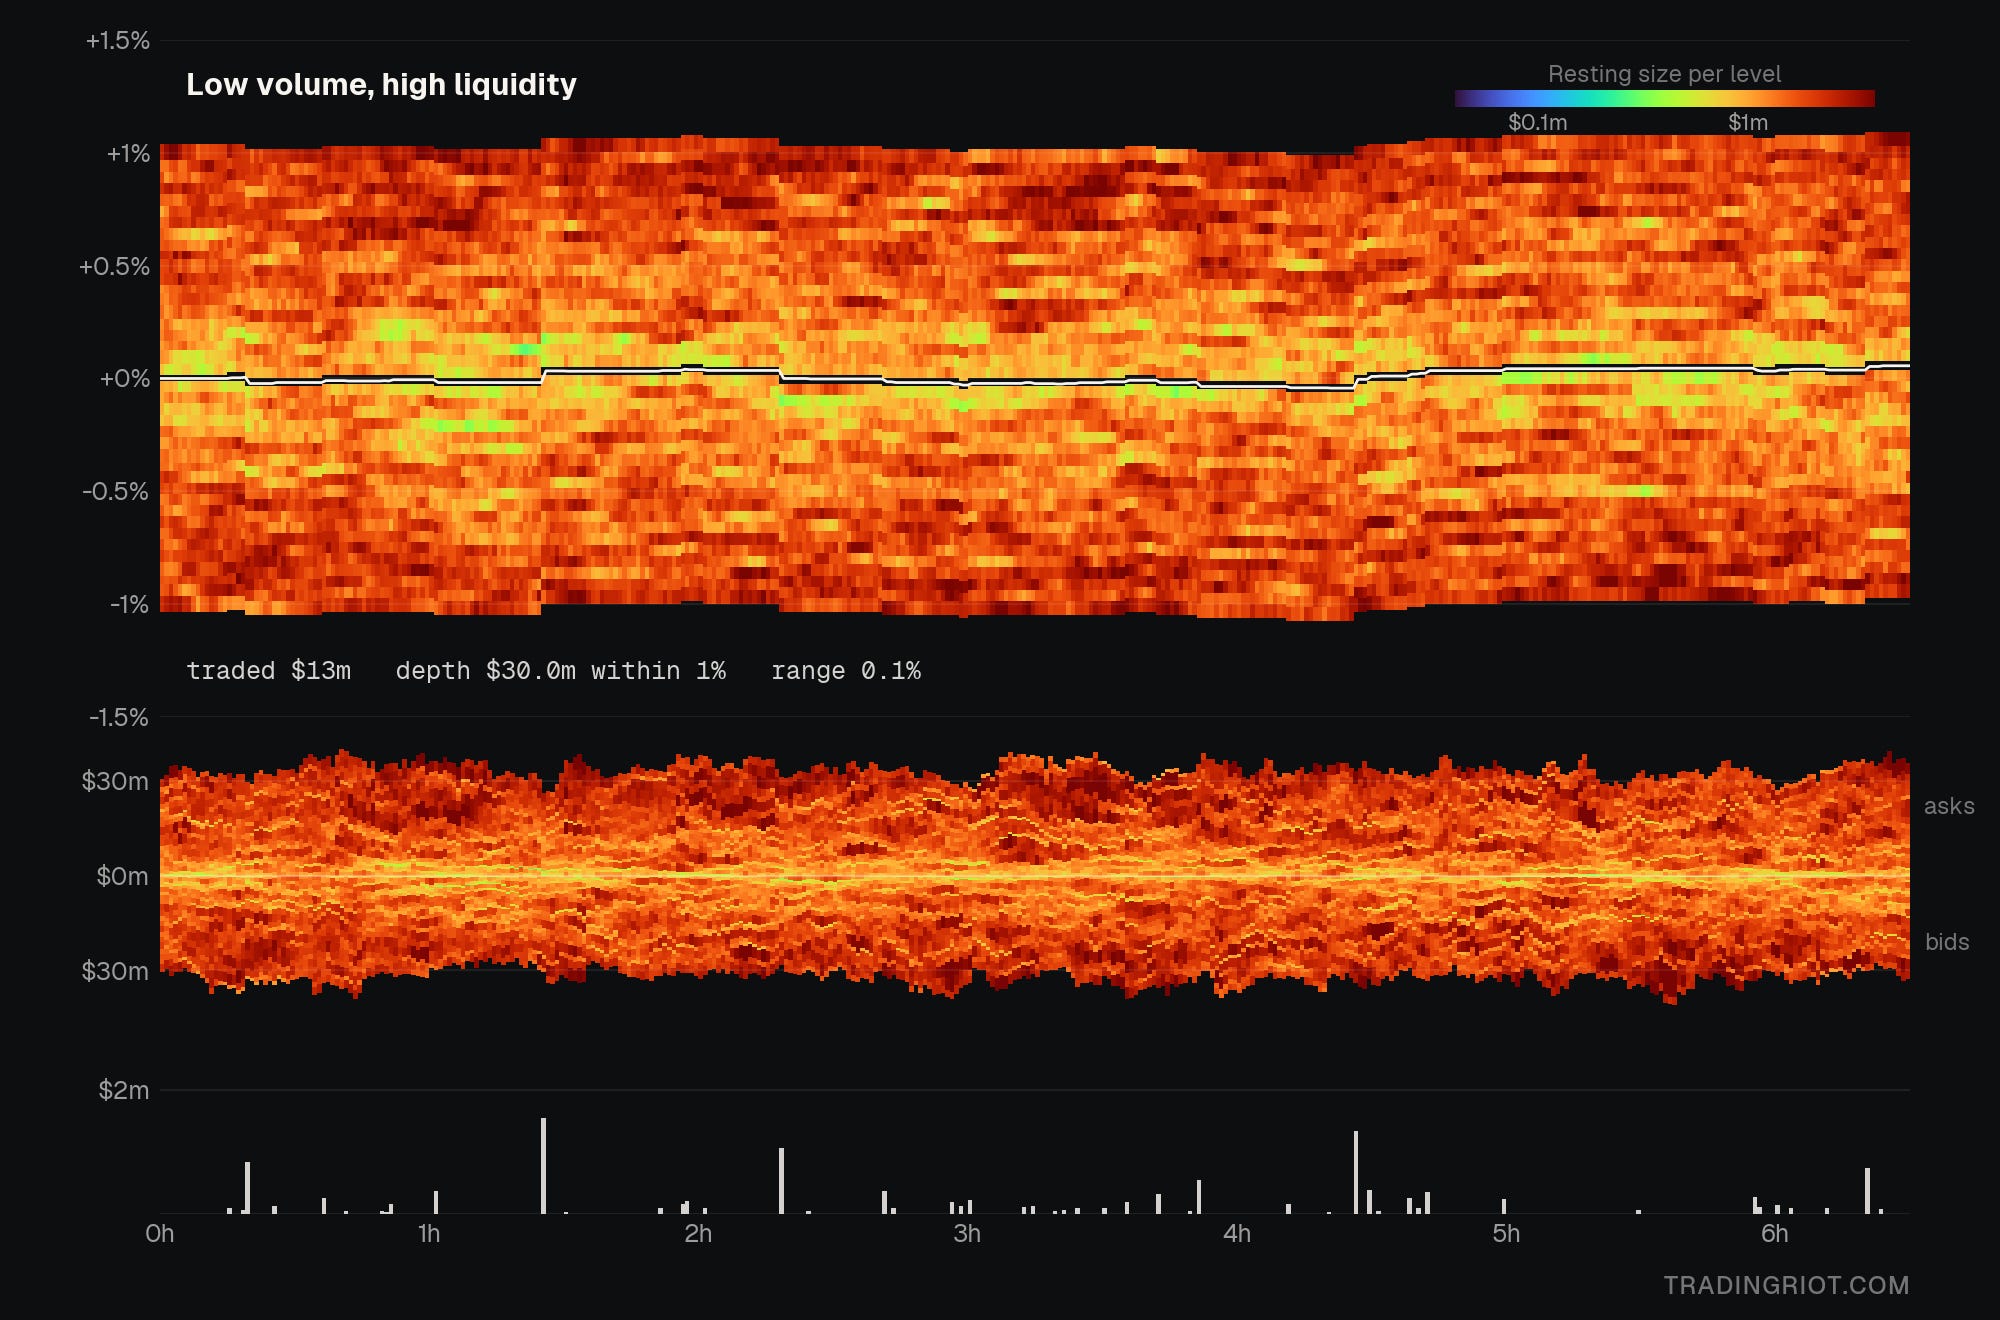
The result is prolonged, low-volatility movement. On the chart the price line is almost flat. These markets are cheap to trade size in and challenging to make money in on direction, because nothing moves far enough to pay for a trade.
High volume, high liquidity
The healthy, busy market: ES during US cash hours, Bitcoin on a weekday. A lot trades, and there is plenty resting to absorb it. Market and limit orders arrive in roughly equal measure, so price moves continuously in small steps without gaps.
The chart shows the key idea of this section. Volume alone does not set volatility. This market trades the same flow as the high volume, low liquidity case, and it moves a small fraction as much. What matters is the ratio between the aggression coming in and the depth waiting for it.
Low volume, low liquidity
Quiet but fragile. Think small caps at lunch, long-dated options, or most altcoins on a weekend. Little trades, and little rests in the book. Most of the time nothing happens, then a single order arrives, takes out a few thin levels, and the price jumps to a new level where it sits again.
On the chart this shows as flat stretches broken by sudden steps. Over a full session it can move about as much as a busy, deep market, because the ratio of volume to depth is similar.
Another Nanex chart shows multiple of these states at once, as these can exist in one market during different parts of each day.
Auction theory
If you spend your time on X or YouTube, you are going to meet many traders who like to express their opinions on the market.
“The market is at this level of support. Therefore, we are heading higher.”
“We just retraced to this level, signalled by this indicator, so we are heading this way.”
The truth is that most retail traders don’t understand why the markets they trade are actually moving. All the overbought/oversold RSIs, supports and resistances, or moving averages look cool on the chart, but 99% of traders lack the understanding of orderflow dynamics.
Auction Market Theory breaks down the market’s primary purpose and how market participants interact to fulfill this purpose. The main idea is that financial markets are no different from any other auction where buyers and sellers meet daily.
There are two things to be achieved: facilitate trade in the two-way auction process and seek the fair value of the asset. Two-way auction means that the end of the “up” auction is followed by the beginning of the “down” auction and vice versa.
This process is represented by tools such as market profile or volume profile. These bell-shaped curves represent 68% of the trading as one standard deviation from the mean. This is what we know as the value area. Inside the value area is also the point of control, the level where the market traded the most volume or spent the most time. Market profile builds this from time; volume profile builds it from volume.
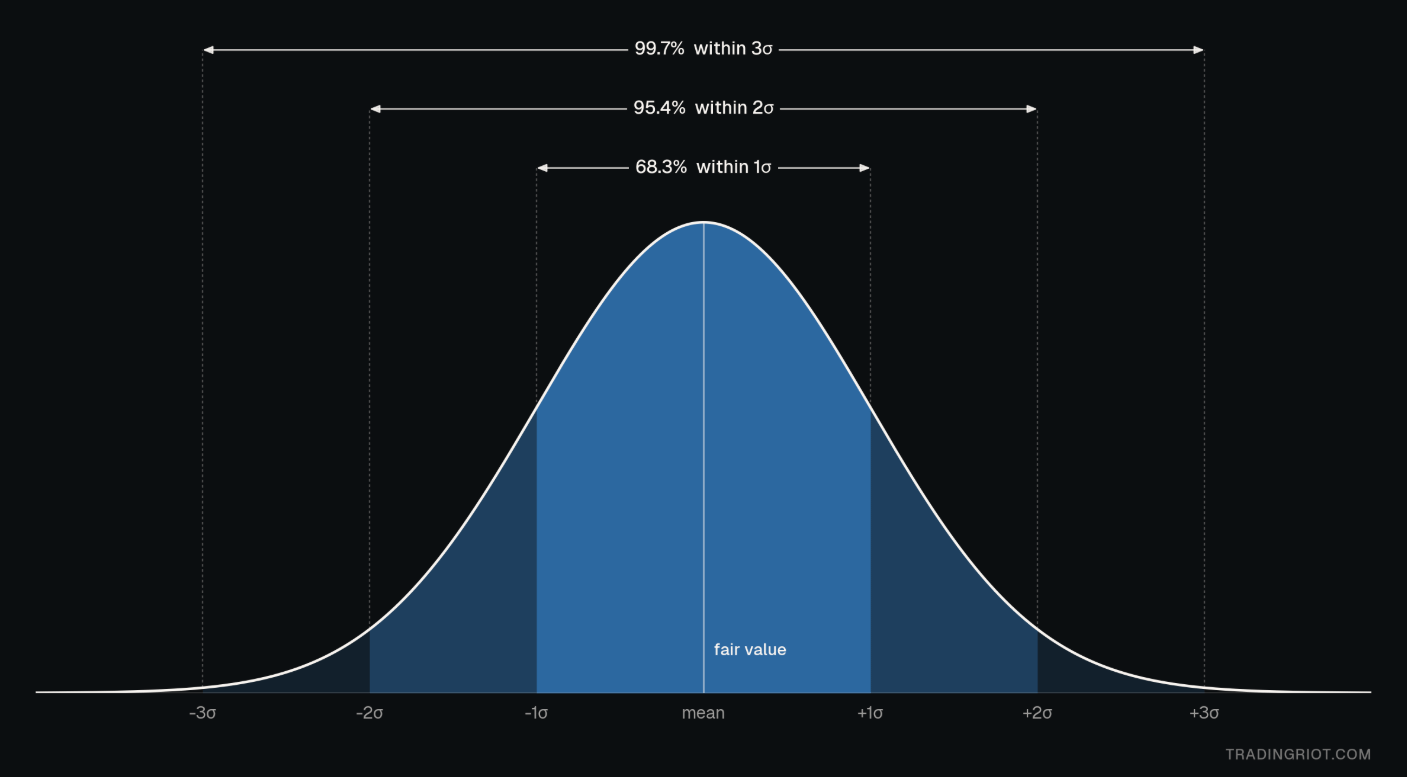
A hypothetical example. One share of Samsung trades at $50. A new Samsung phone comes out, and it’s terrible; the battery is not working, and it’s overheating. The stock starts dropping until it finds new buyers at, let’s say, $30. This is where the new value area is created. After some time, phones get repaired, and the stock starts to rise again. Where is the market likely to stop? The previous value was around $50.
This is eventually what every market does. Participants negotiate prices between balanced and imbalanced values.
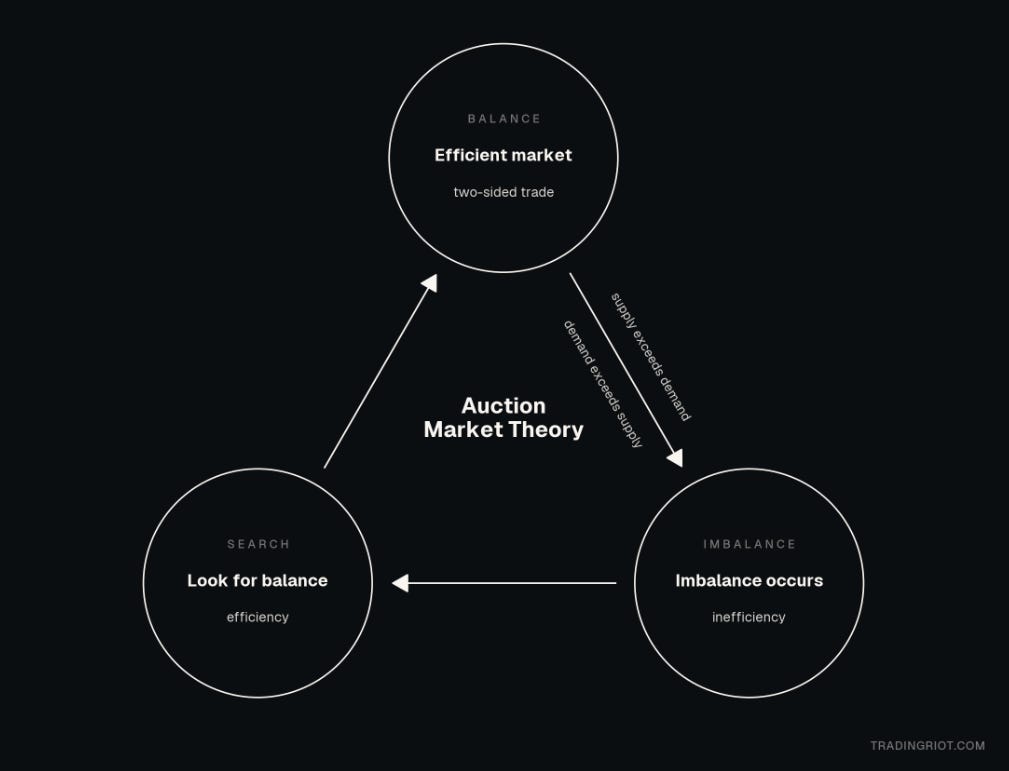
Auction Market Theory is not a trading strategy, and you don’t necessarily have to use a market or volume profile in your trading, but understanding these concepts is useful. It is visible on every timeframe in the form of trends and consolidations.
Is your size size?
There has been a lot of research done 1 on what happens to price when a large order is worked through the market. The result is the same across stocks, futures, options, and crypto; impact grows with the square root of order size instead of going up in a straight line.
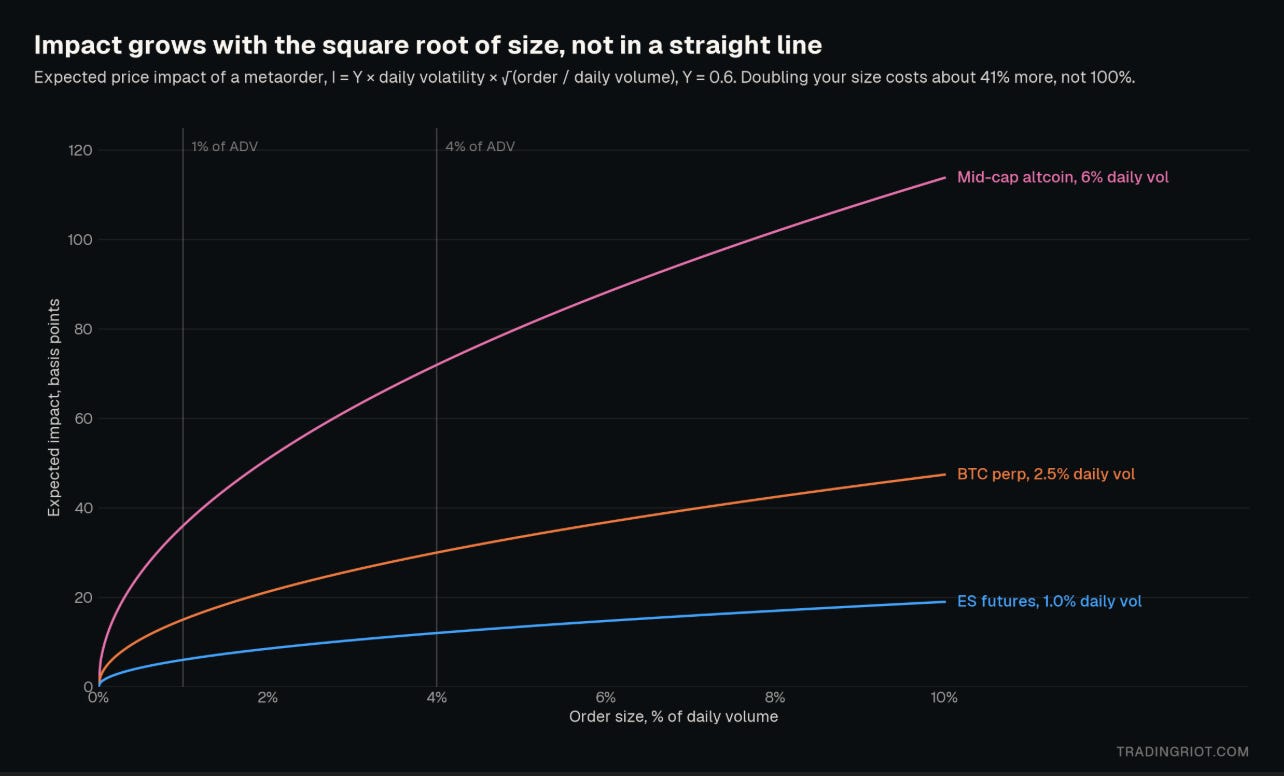
In plain terms, the expected price move caused by your order is roughly 0.5 to 1 times the daily volatility times the square root of your order as a fraction of daily volume. The exponent comes out between 0.5 and 0.6 in every dataset anyone has looked at.
This won’t be an issue for a lot of you, especially when you are starting out, but you will be surprised how easy it is to end up in some illiquid market where the execution matters. If you end up in these deep parts, remember that your size is relative to volume, not your size in dollars.
Say you buy $30,000 of BTC. Daily volume is around $30bn, so your order is 0.0001% of the day. Run the formula with Y of 0.6 and 2.5% daily vol, and you get an expected impact of about 0.15 basis points. Since that is basically part of the spread, you won’t notice that at all.
Now take the same $30,000 into a small-cap altcoin that does $3m a day and moves 8% on a normal day. Your order is now 1% of daily volume. Same formula: 0.6 × 0.08 × √0.01 = 0.48%, or 48 basis points. You will quickly find out this sucks, as you need to figure out how to execute your trade well, and it will also suck even more if you want out rushing.
While all this might sound too complex and something that probably won’t really matter to you, it will; being able to execute trades well can be the make or break of the range of different trading strategies.
Liquidity
The main buzzword you see constantly circulating online when it comes to trading, often tied to resting stop-losses and the market constantly hunting them.
This is not what liquidity actually is, liquidity much much less exciting terms represents resting orders you see inside the orderbook, stop orders like stop losses are not included in this view.
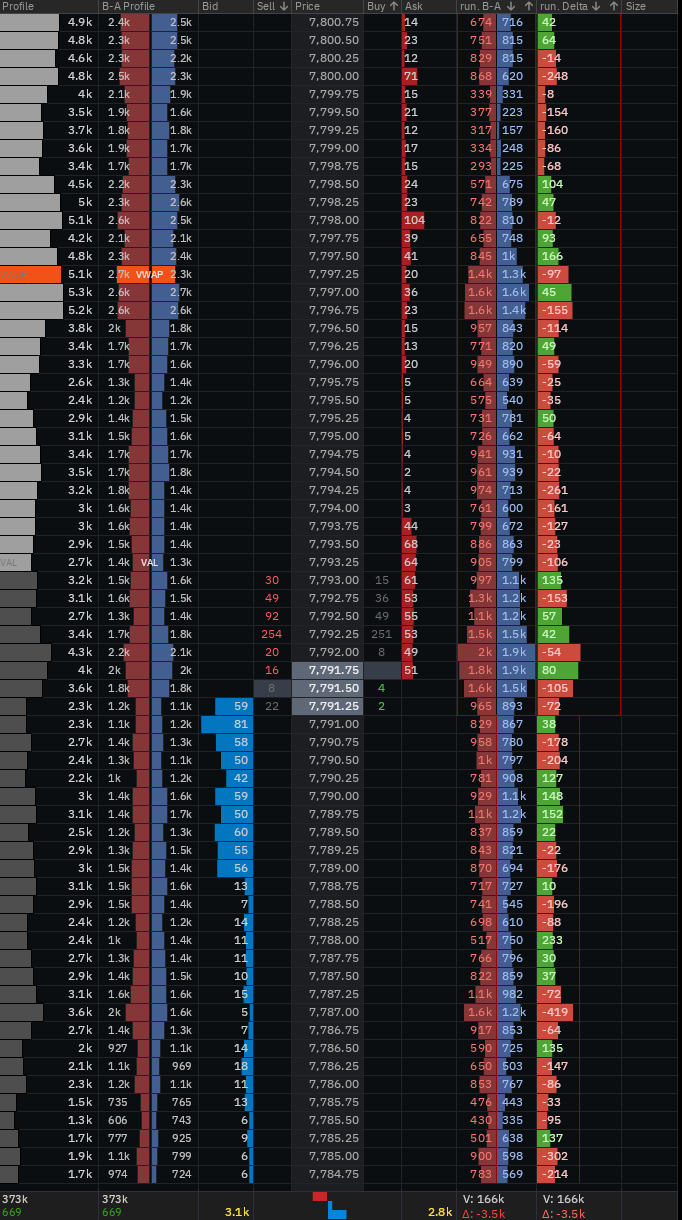
The chart above shows the depth-of-market (DOM) of S&P 500 futures ES. In the middle you have the current price; on its left there are pending buy orders sitting at the bid, and on the right side there are sell orders waiting on the ask.
As you can notice, there is also a price difference between them, in this case 7,791.50. Despite buyers sitting at 91.25, if I would rather not wait and want to immediately buy the ES futures and I click the market order, I will have to cross the spread, and my buy order will open at 91.75.
The same goes for selling, while sellers waiting to sell at 91.75, if I want to be short immediately, I will be crossing the spread and getting filled at 91.25.
Can you trade directly from DOM without looking at anything else? This is how I actually started trading years ago and was doing it mostly in European bonds. Back then all markets were much thicker and slower, so it was much easier. A lot has changed since then; markets got faster, and high-frequency trading got more popular and advanced, so these days it will be much much harder.
But even if we are not going to use DOM for trading, we probably won’t have access to any advanced DOM like you see above. I look at the depth of the market before every single trade I am about to place. I watch for three main factors.
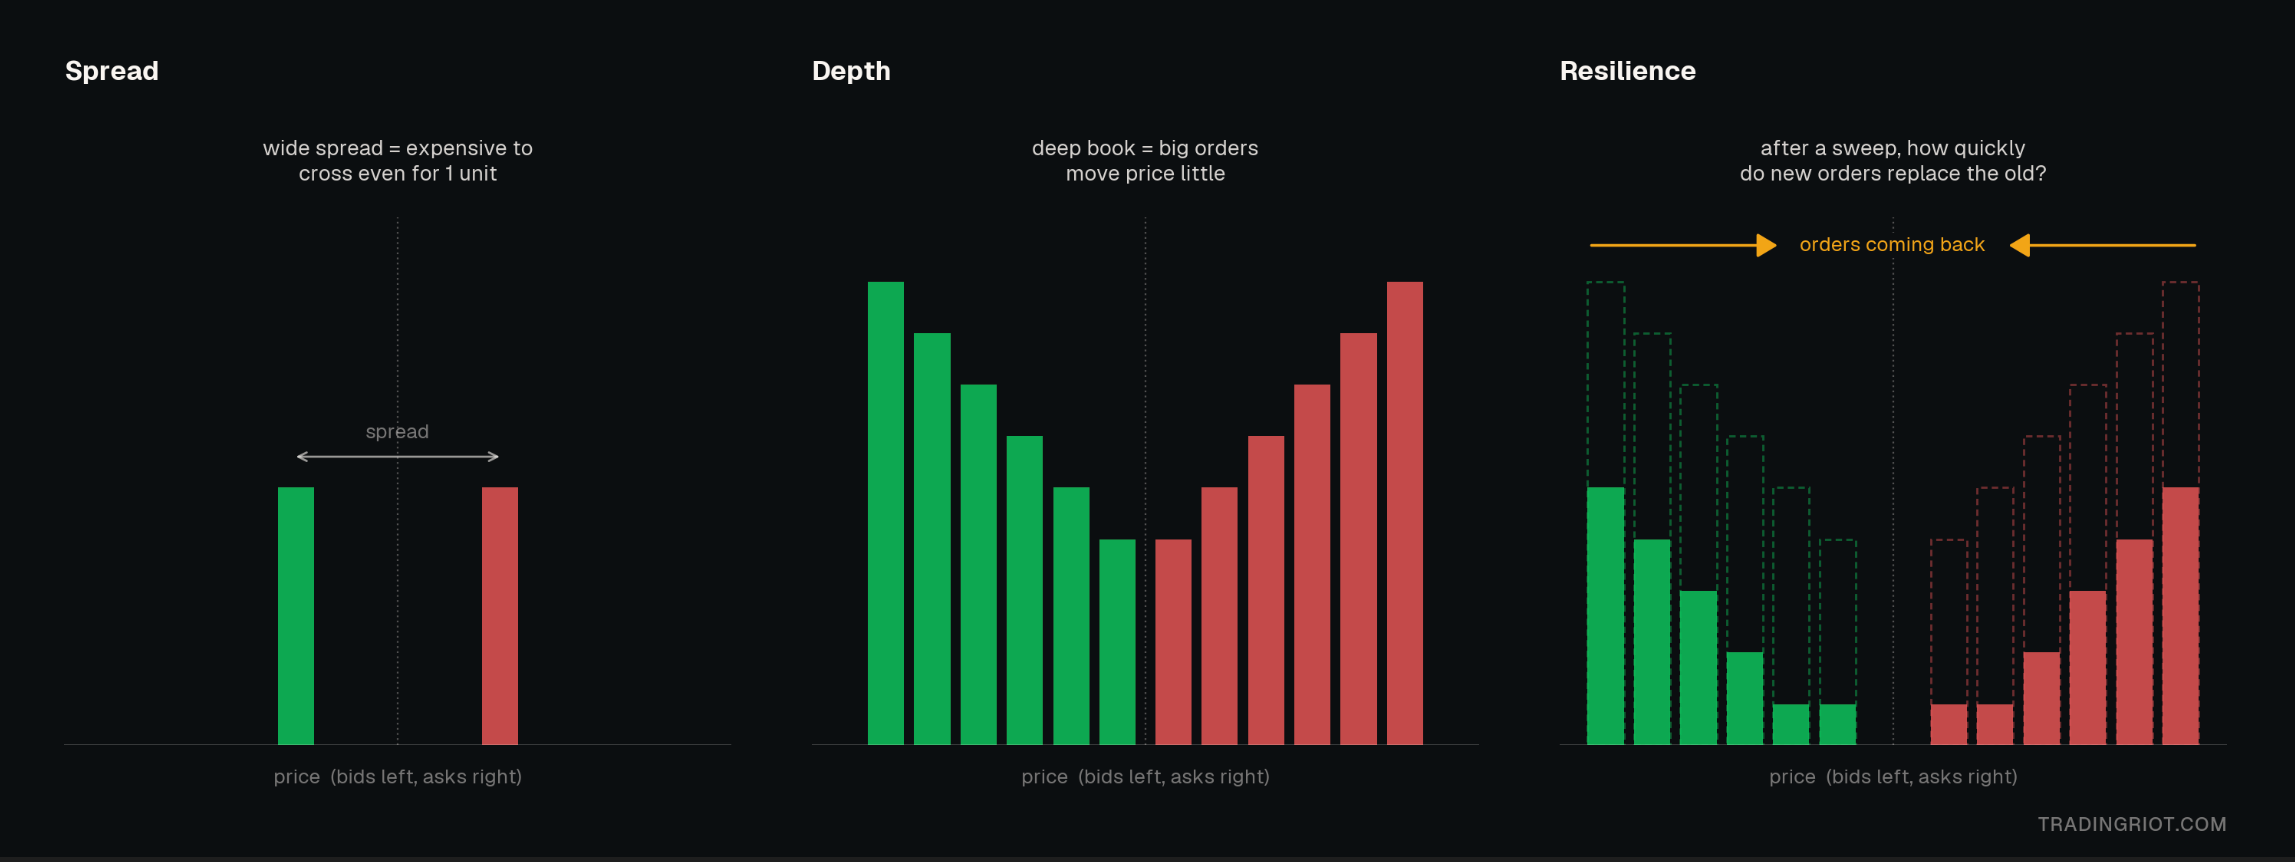
The spread is arguably the most important, as it tells you the cost of crossing the bid-ask. We all know we want to be in trades as soon as possible, but as I mentioned, crossing the spread can make or break many trading strategies.
While it will probably be a non-issue if you only trade ES, Bitcoin, or other very liquid assets, it can cost you a lot for any less liquid market, especially if you are trading a lot.
For that reason, it is always well advised that even if you want to get into trade right away, start working on your orders from bid to mid if you would like to buy. Or ask down to mid if you would like to sell. Especially if spread exceeds one tick.
Depth will tell you information about how much size you can get; you might be looking at a market that has a very tight spread, thinking that you can trade whatever size you want. But only by looking at the full depth will you know where your order lands and how much slippage you will get if you execute the desired size.
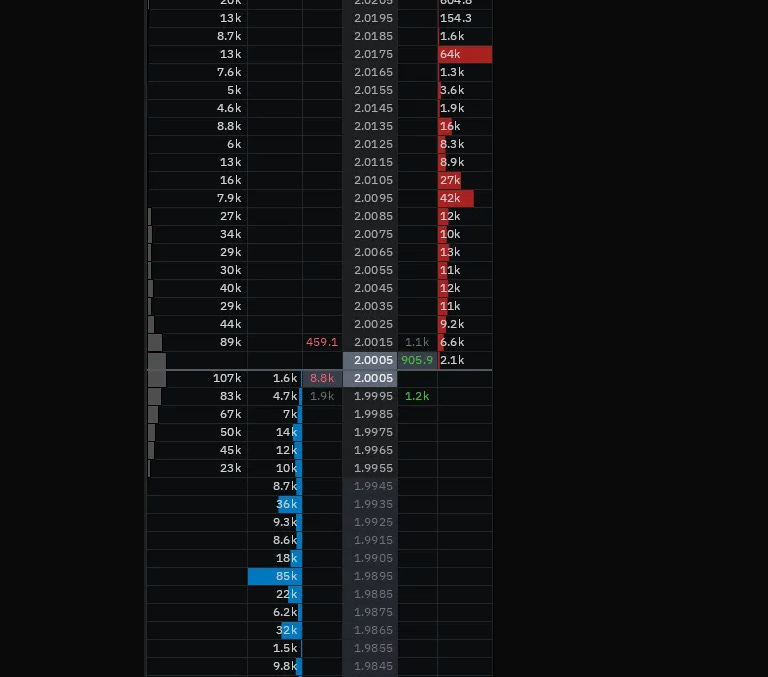
This is the order book of ZROUSDT on Binance. The spread is only one tick, but if I want to short 100k ZRO tokens ($200,000 notional) at market, the order consumes every bid all the way down to approximately 1.9895. My average fill ends up around 1.9927, which is 0.0078 below the best bid, so I am down roughly $800 before the price even does anything. This is obviously not ideal, especially since I decide 5 minutes later that I don’t like the trade anymore and want out.
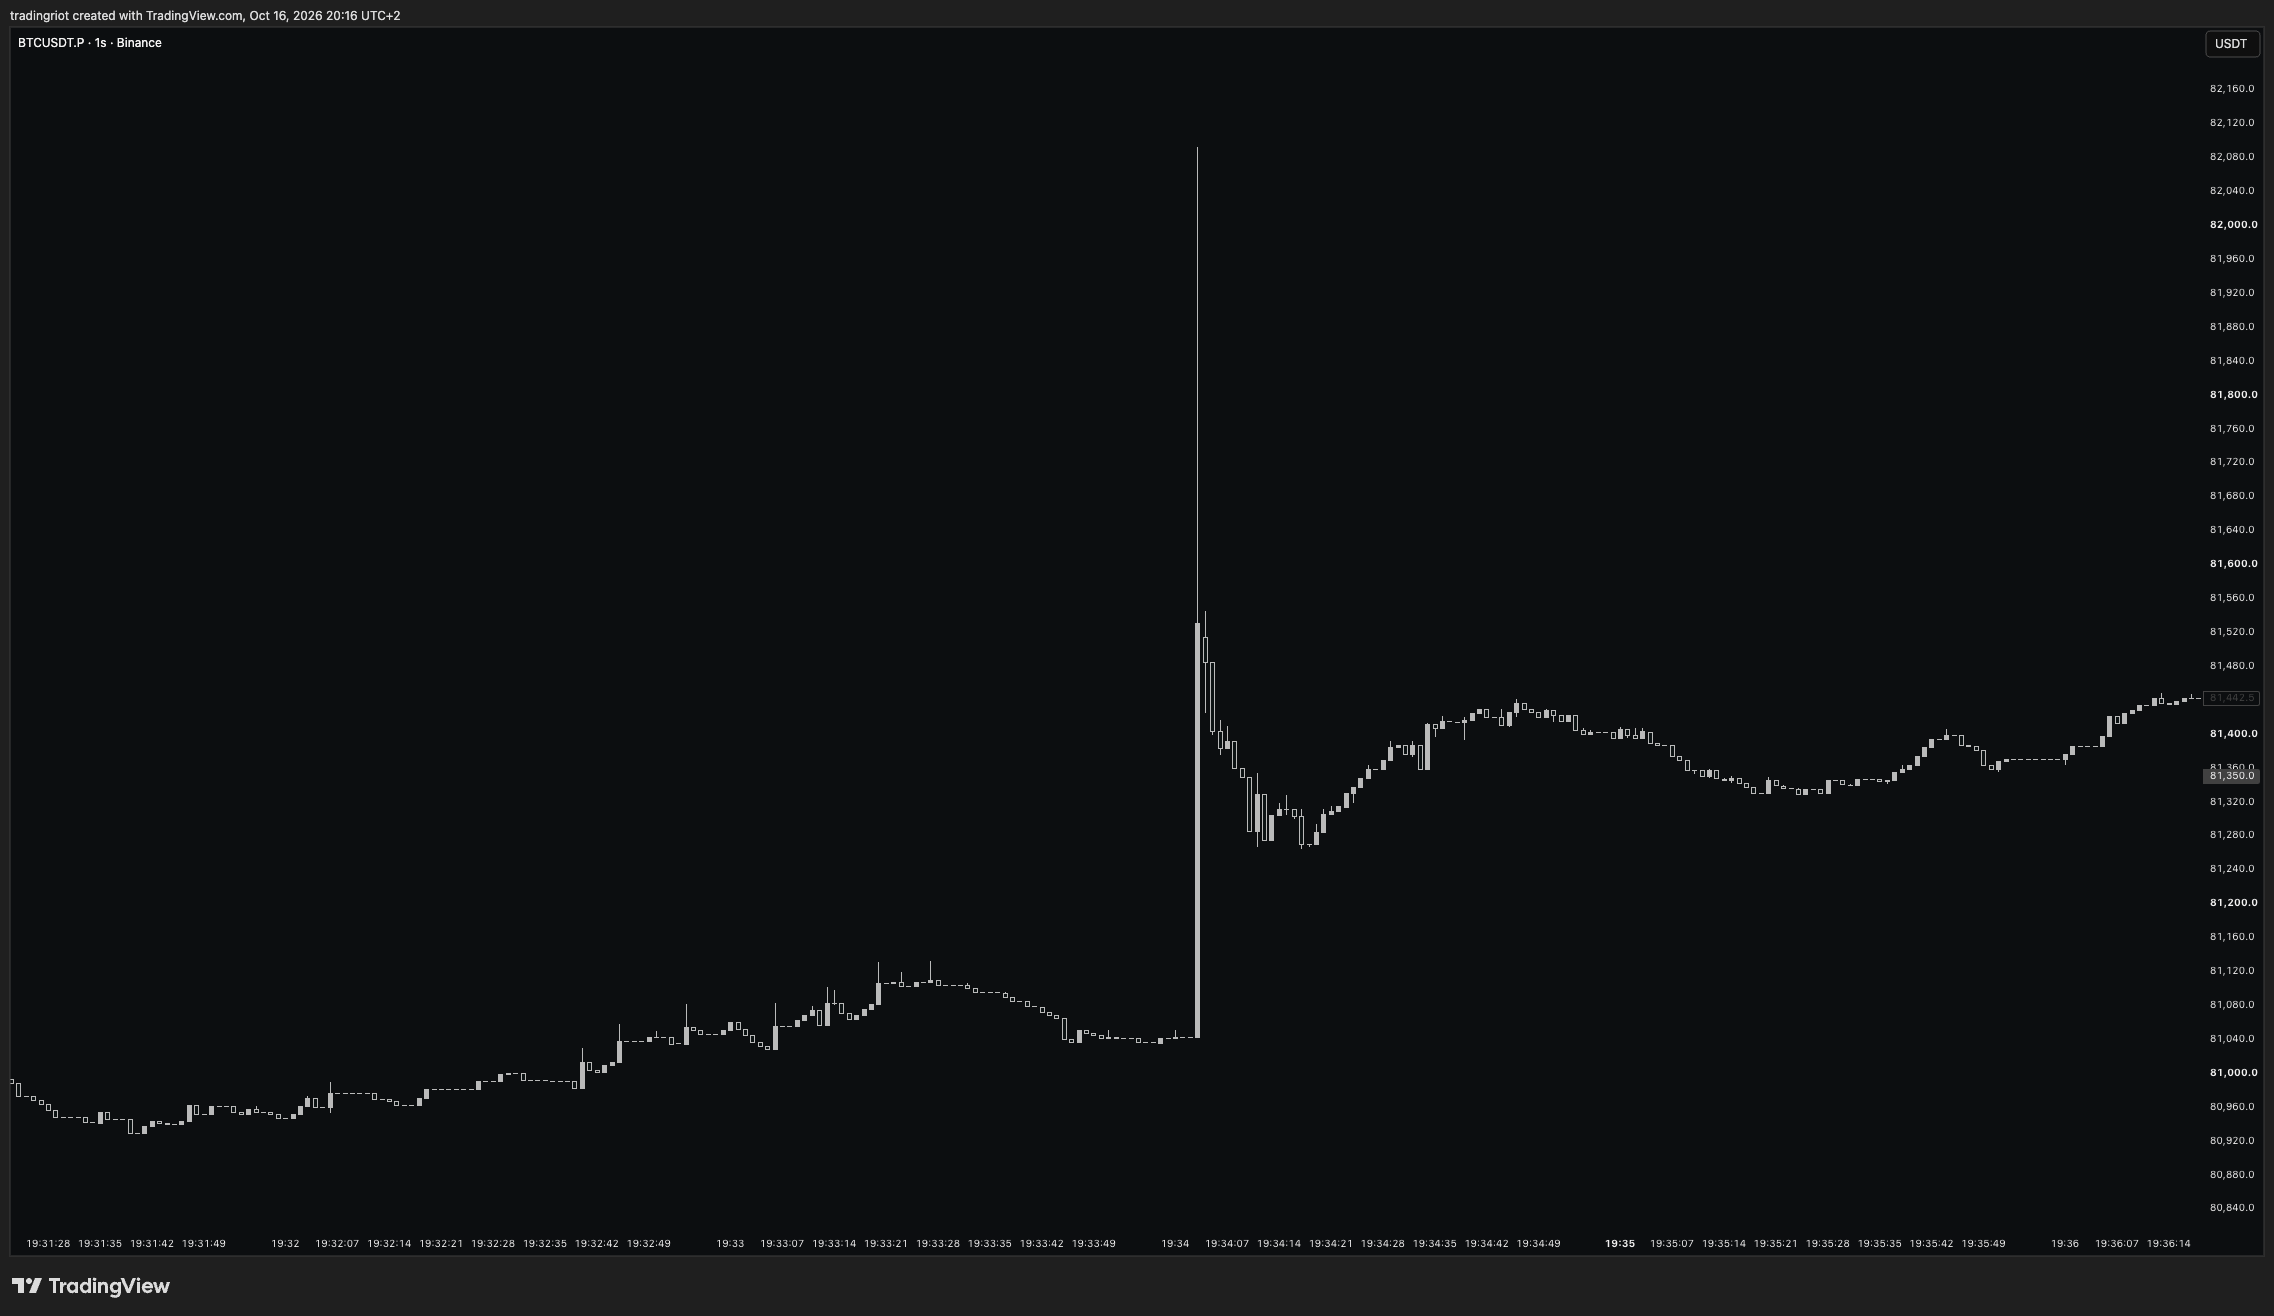
If you are observing lower timeframe charts, these can pop up from time to time, like this Bitcoin 1-second candle, which moved $1,000 as someone presumably fat-fingered a large market order.
The resilience is not that important and is probably something you won’t really observe unless you really decide to go deep into trading using the order book. It shows how orders are getting reloaded, which can provide some insights about underlying supply and demand.
In general, don’t get too hung up on watching order books the whole day. Most resting orders cancel before they are traded, and for any sophisticated market participant who wants to execute a large size, there are many ways to do that without showing their hand to everyone; I will come back to these later.
And beyond the book entirely, there is latent liquidity, the traders who would sell if the price got 1% higher but have not bothered to post an order. They show up as price moves. This is the real reason the impact is square-root-shaped rather than linear as your order executes.
Depth also changes throughout the day; while most markets trade 24/5 or even 24/7 these days, the liquidity will change as the day goes on.
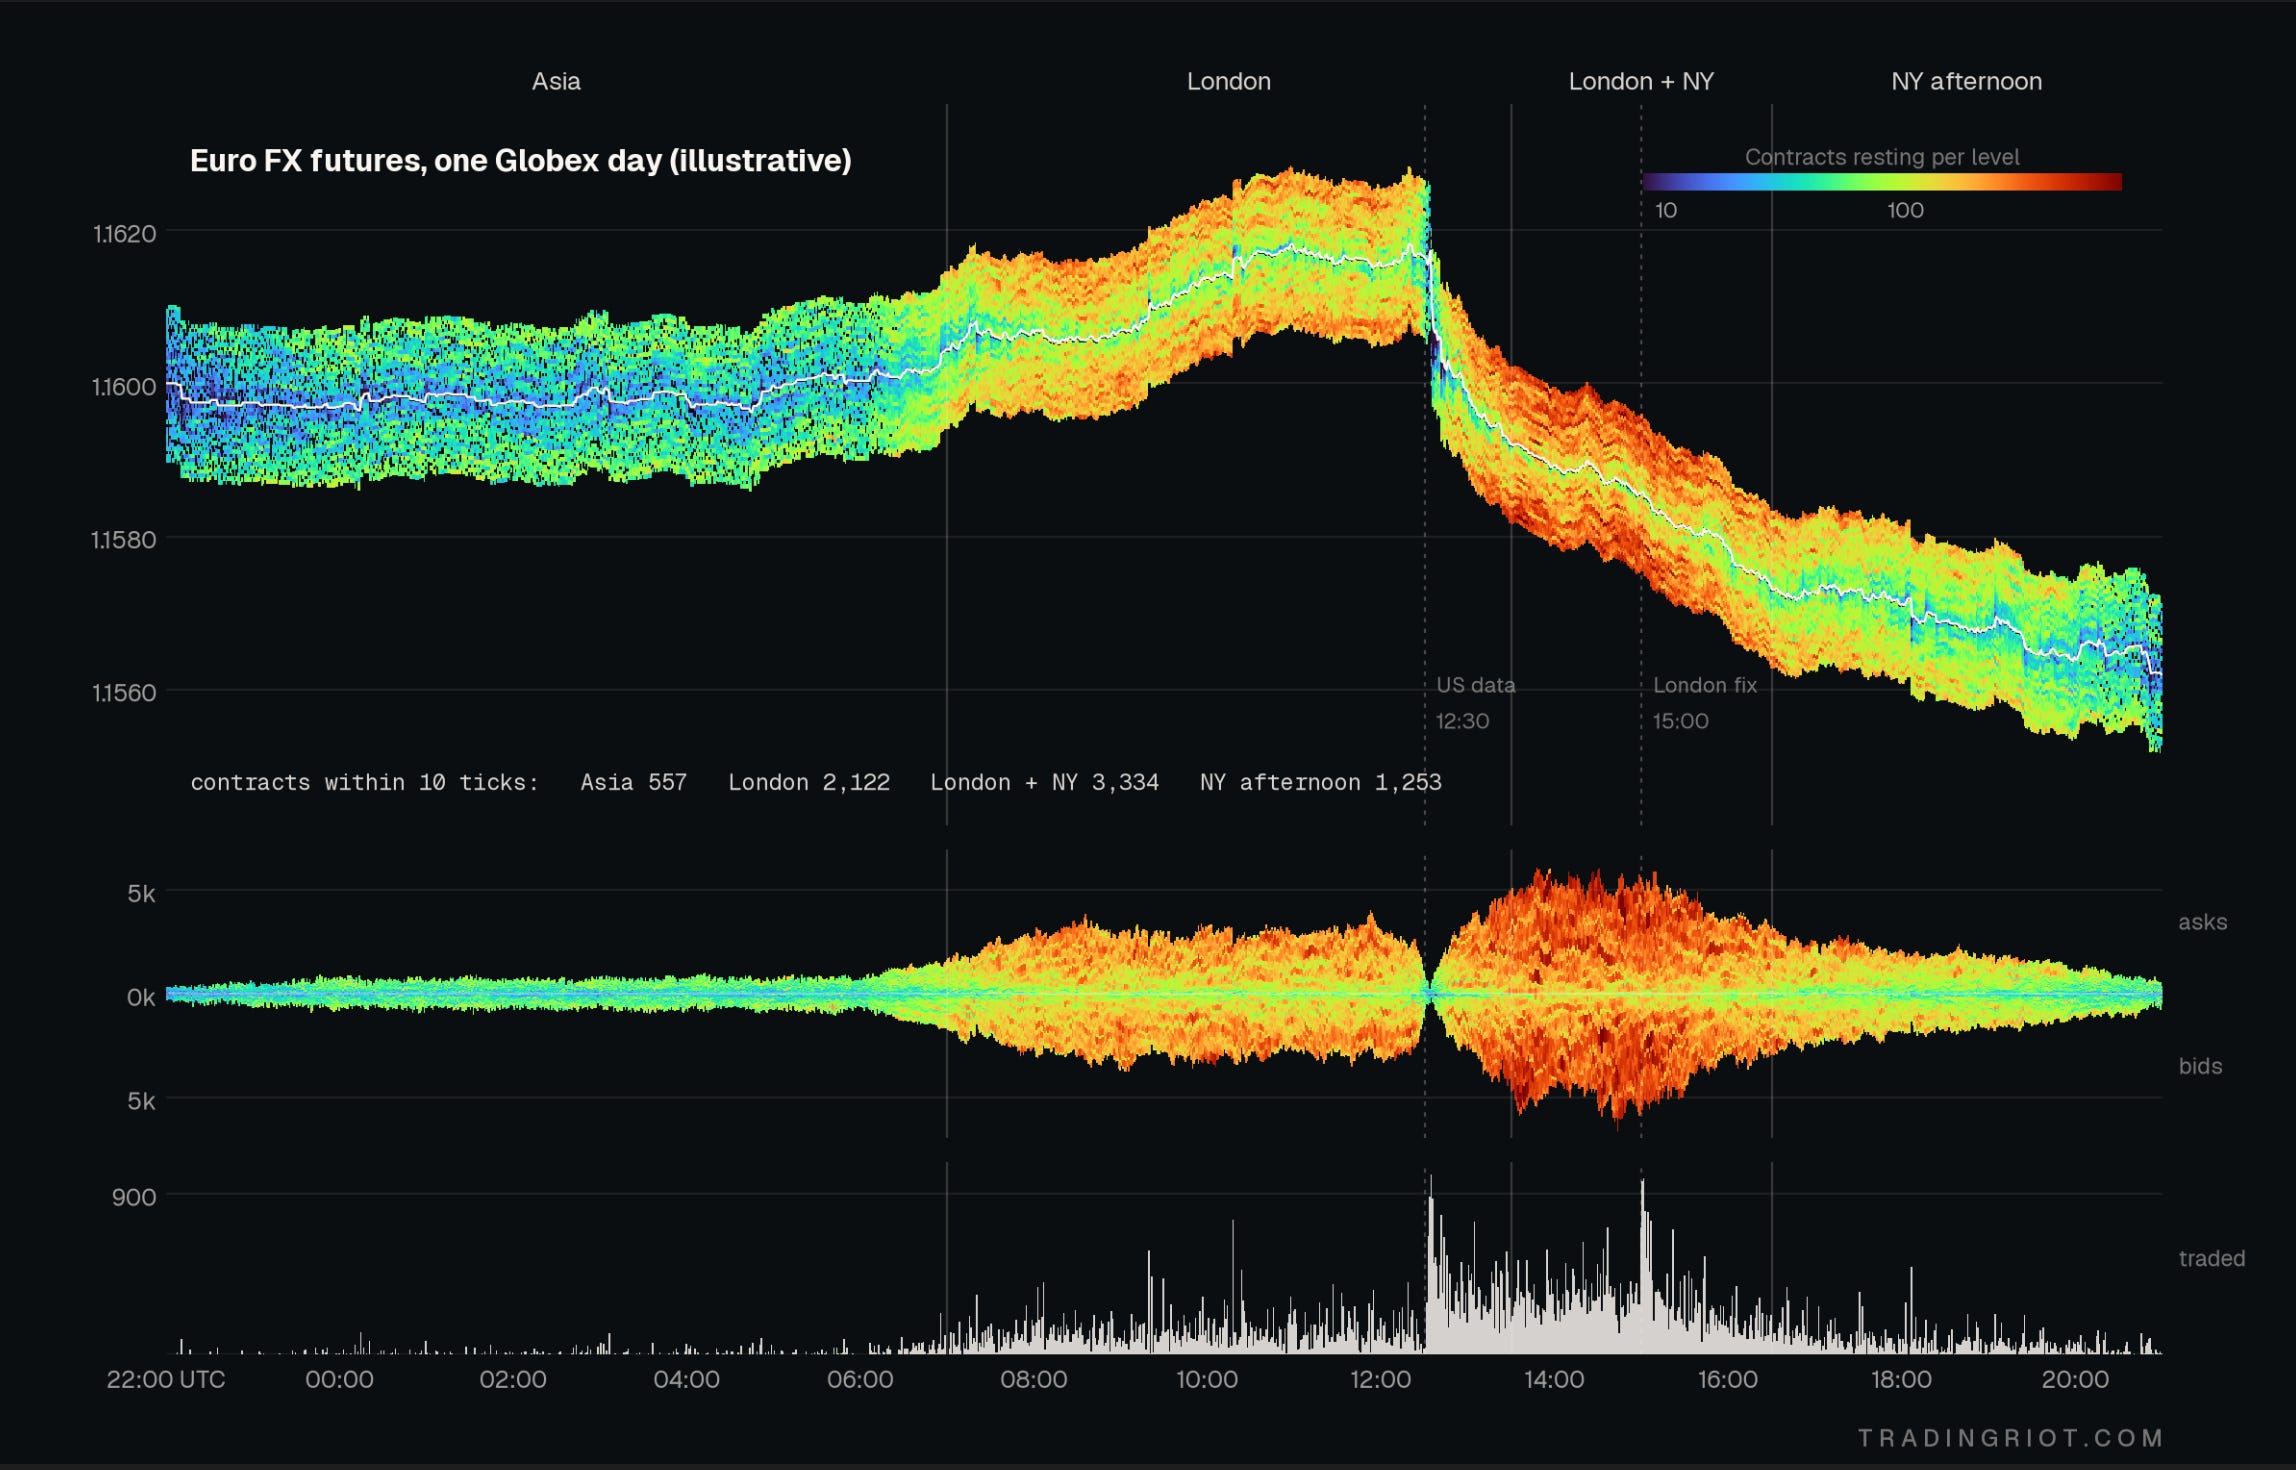
The issue with available liquidity is that it often disappears when you need it the most. This does not only happen intraday during the high-impact market news but also during the increased volatility due to panic selling or buying.
There has been research published last year by CME monitoring the liquidity in the S&P 500 over the several weeks during the tariff selloff.
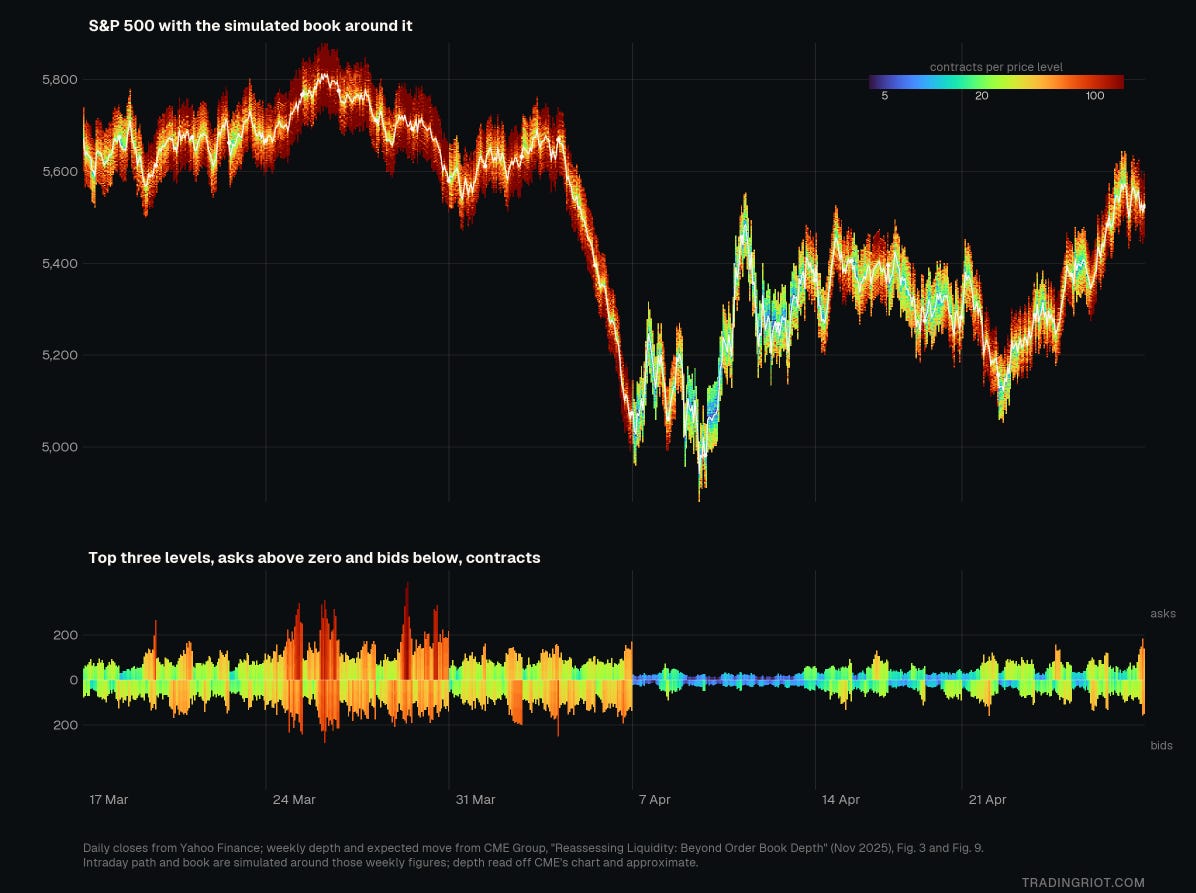
As you can see on the chart above, the liquidity does not only dry up intraday at high-impact news but also gets progressively lower when volatility increases.
The same goes for other markets, especially crypto, where the liquidation cascades are extremely common due to the high leverage perpetual swaps offered. There is a great article by @ltrd_ on X that breaks down the 10/10 liquidation cascade.
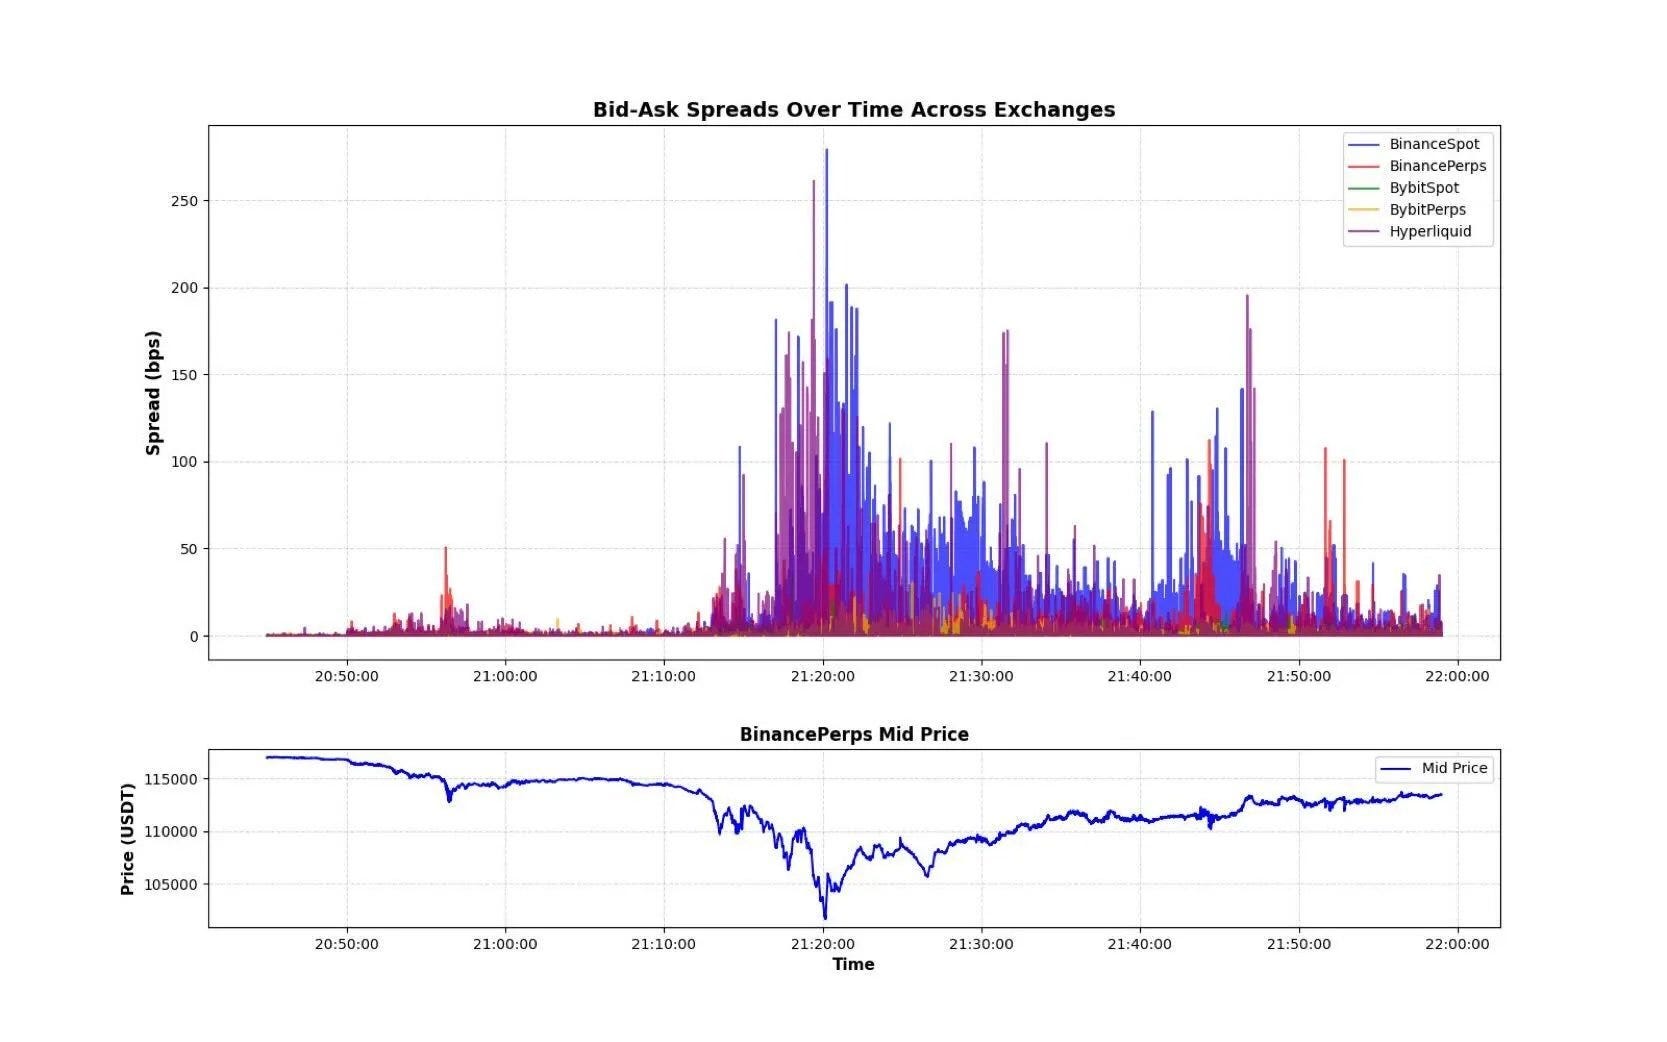
Why is there no depth when you need it the most? It is mostly because the liquidity is provided by market makers who pull quotes when uncertainty rises, and whatever aggressive flow shows up next hits an empty book and directs the move.
Where Does the Spread Come From?
As already mentioned, market makers make money from the spread, but why is there a spread in the first place?
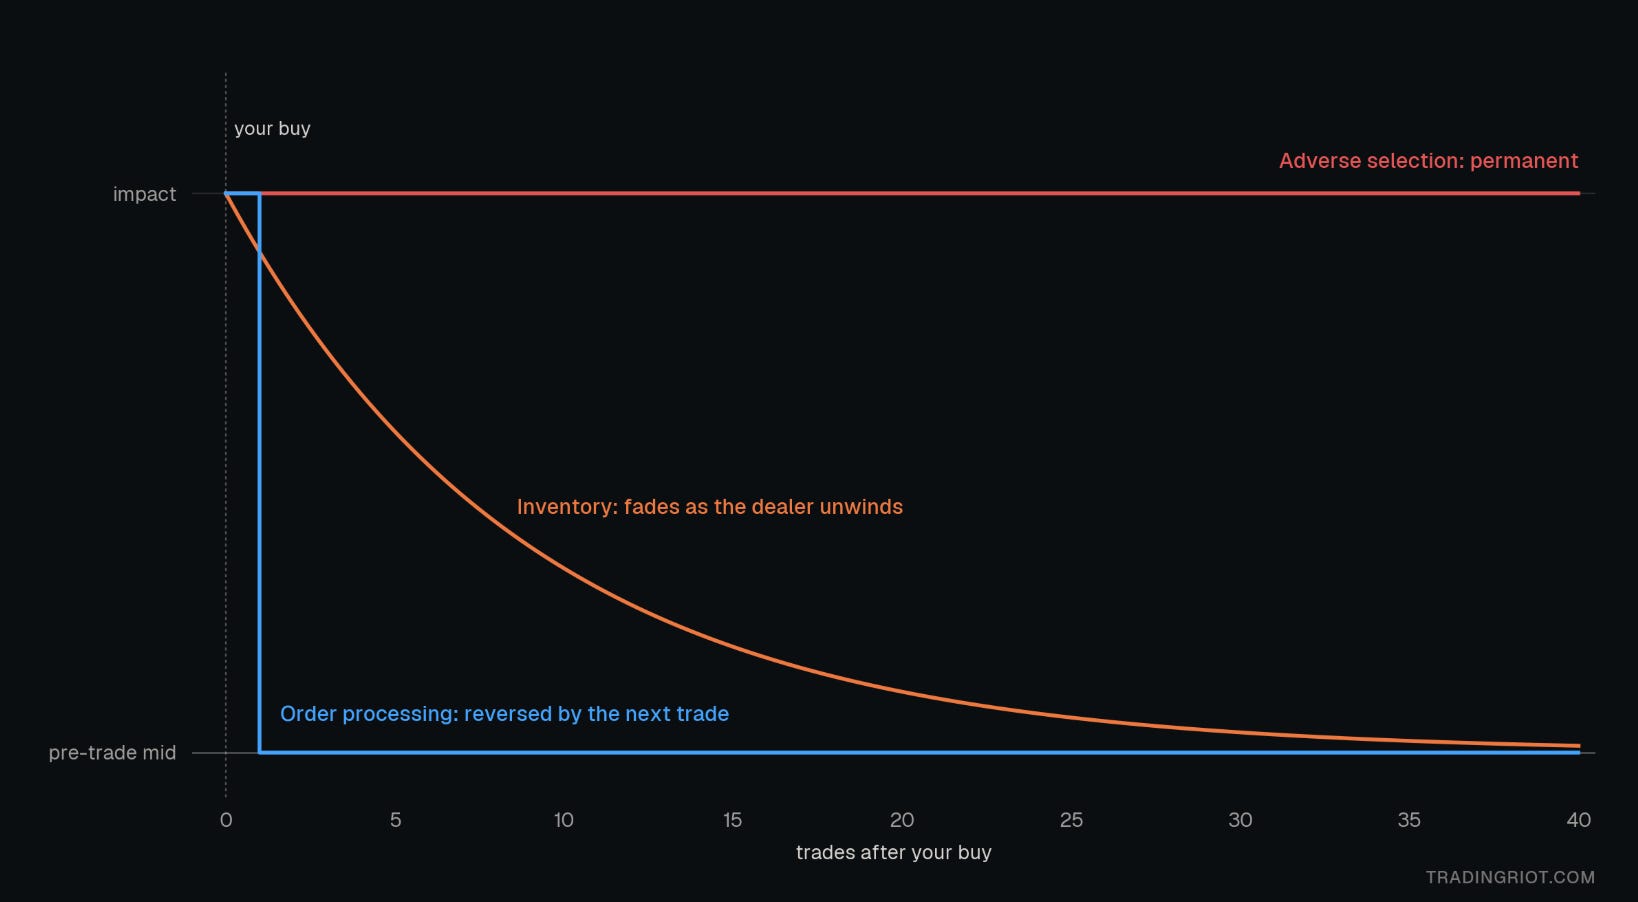
Three separate costs make a spread that leaves the mark on a price. The first is plain order processing: exchange fees, clearing, technology, the market maker’s overhead, and whatever margin they can squeeze out on top.
Your buy nudges the price a tick or two; the next sell undoes it, which provides no information about where the market might be heading.
The second is inventory risk. Once they fill your buy, the market maker is short and wants to get flat again, so they shade both quotes down a little to tempt the next seller. Over the next few minutes they work their way back to neutral, and the price that got pushed around drifts back to where it was.
The last and arguably most important is the adverse selection. When someone lifts their offer, they have no way of knowing whether they know something they don’t, and some people trading with them do.
So they price their ask at what the asset is worth given that someone just bought, which is a little higher than what it was worth a moment earlier, and do the same on the bid in reverse.
The spread is their insurance against informed traders, and they would need it even if trading were free and they didn’t mind risk at all. It also leaves the only mark that lasts: the informed flow snaps back almost immediately, similar to inventory fluctuations, but when an informed buyer moves the price, it stays moved.
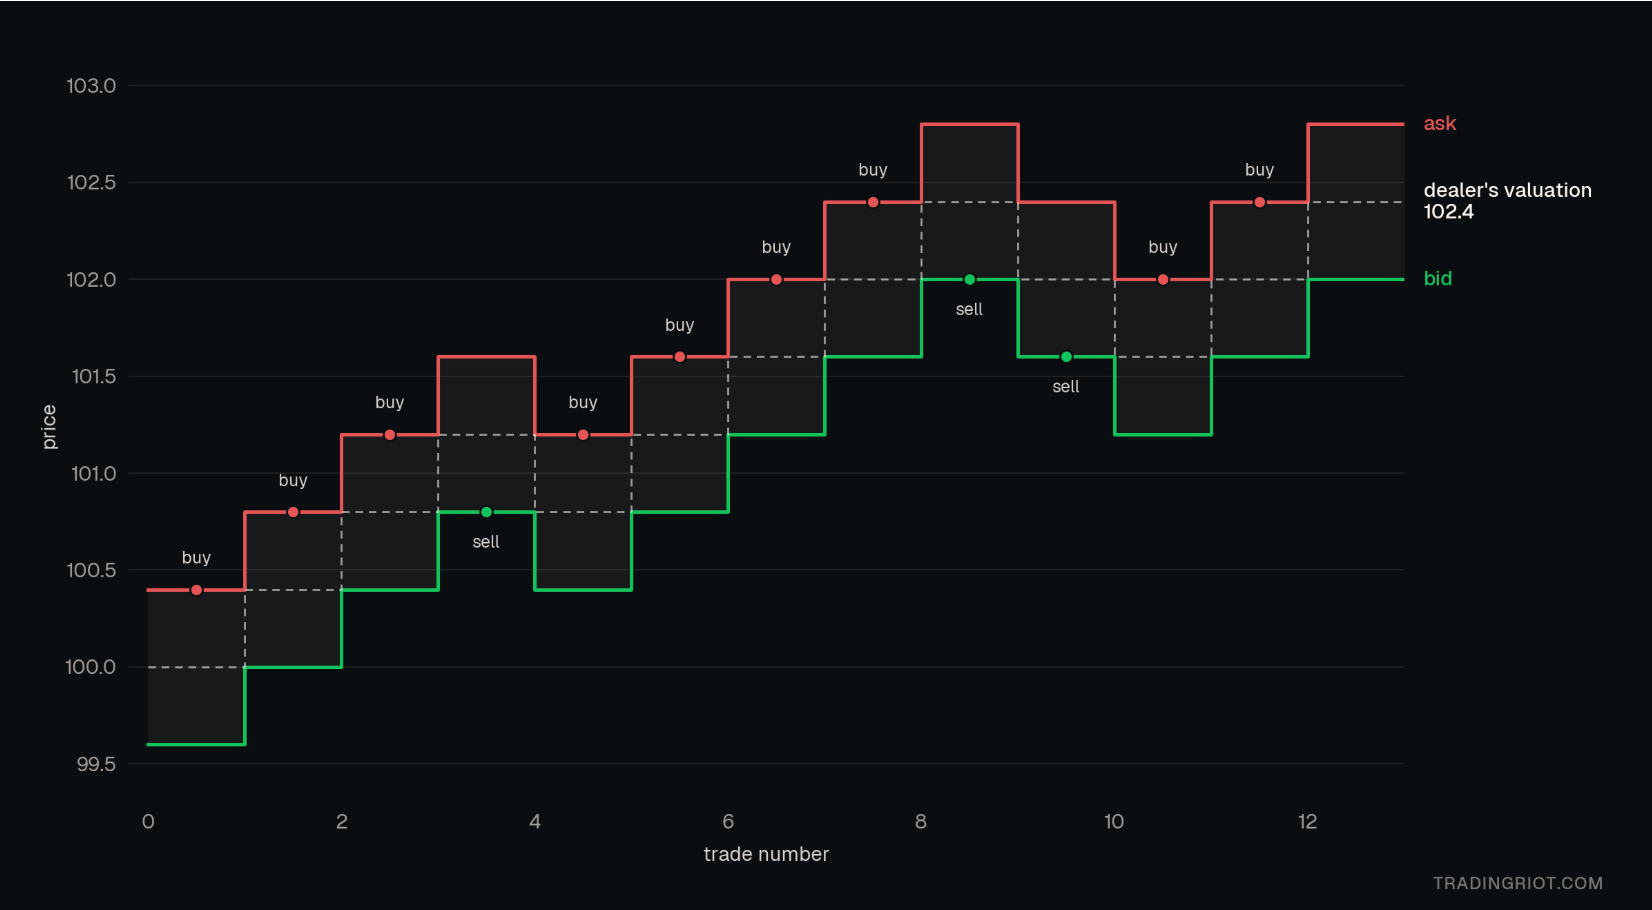
This is the mechanical reason your market order tends to move the quote against you. The market maker's pricing treats every aggressive order as partly informed, so the quote steps away from you whether anyone noticed your order.
Because most of the liquidity in any market comes from market makers (their job is literally to make a market), during high-impact news and uncertain events you see the books get much thinner.
They pull their orders to avoid carrying inventory into a move they can’t price. This is why your stop loss during these events might not fill where you wanted.
Can you make markets? Proably not. Market making these days is done by high-frequency trading firms and is extremely competitive and infrastructure dependent. You can try some very niche markets where competition is low, such as stablecoins to stablecoin markers or some shitter altcoins no one wants to touch with a ten-foot pole.
But I hope this helped debunk the “market makers running stops” myth, since in reality they don’t really need to.
Orders and the Book
As already established, traders willing to buy and sell an asset place orders in the order book. These resting orders are what we call liquidity or limit orders.
In crypto exchanges you often see maker and taker fees. You are a liquidity maker if you put orders into the book (a limit order). You are a liquidity taker if you take liquidity out of the book (a market order). Since most crypto exchanges have their own CLOB (central limit order book), they offer drastically lower maker fees compared to taker fees, so traders add liquidity into their book.
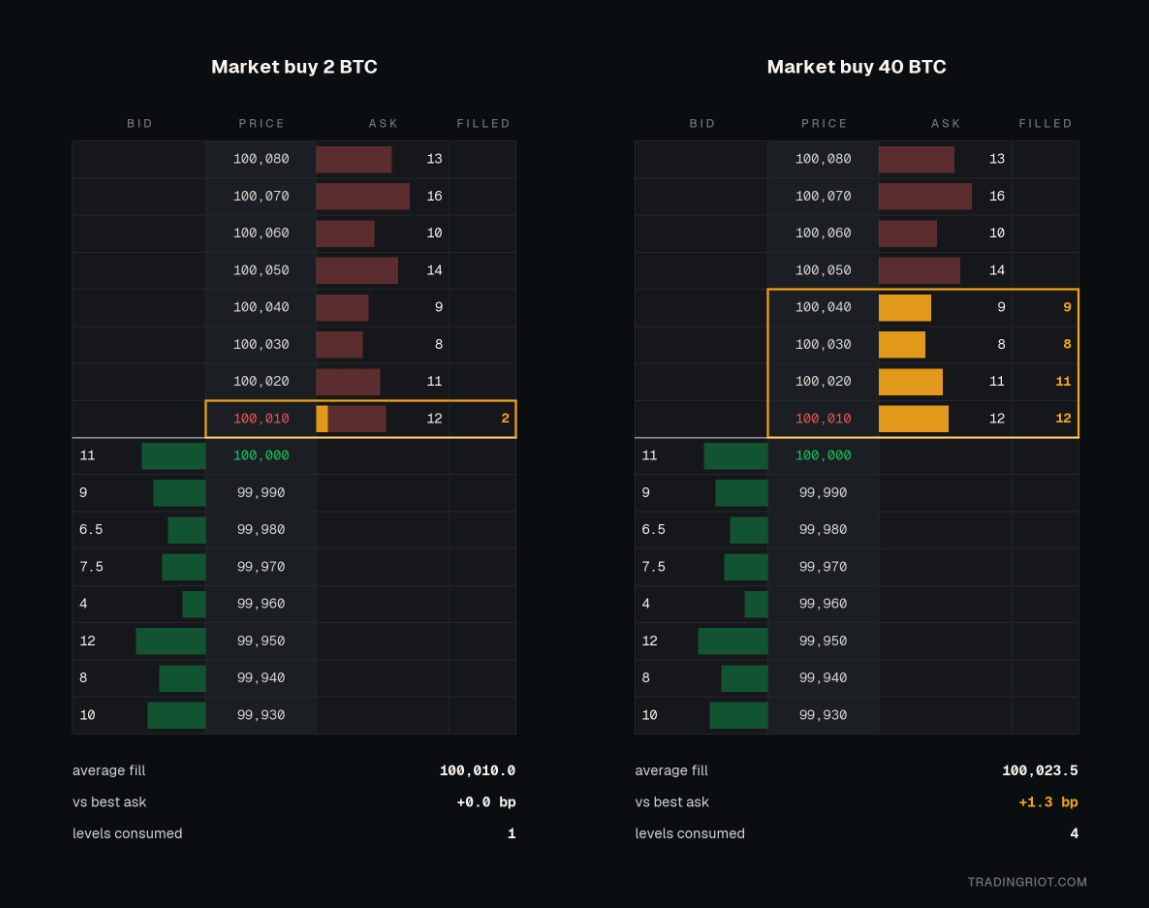
The resting bids and asks are not horizontally next to each other but diagonally. The gap is the spread. For the market to move one tick higher, someone has to buy everything resting at the best ask. For it to move one tick lower, someone has to sell into everything at the best bid.
In the ladder above, the 2 BTC buy takes a small slice of the 12 BTC resting at 100,010 and fills at the best ask, so it pays only the spread. The 40 BTC buy clears 100,010, 20, 30, and 40 in one go. Its average fill is 100,023.5, 1.3 basis points above the best ask, and the next buyer finds the cheapest offer at 100,050.
Limit Orders
Anyone can place a limit order in the book. For that reason, they are sometimes called advertisements or passive orderflow. Buy limits sit below the market; sell limits above.
Limits are the patient and cheaper approach and therefore are often used by larger players. Paying the spread might not matter for a small retail trader, but any large player would rather wait than use a market order that costs much more.
The downside is not only that you might not get filled, but also that you might get picked off.
If you were around during the FTX days, there was this very popular saying that “if your limit order gets filled on FTX, you know it’s a losing trade.”
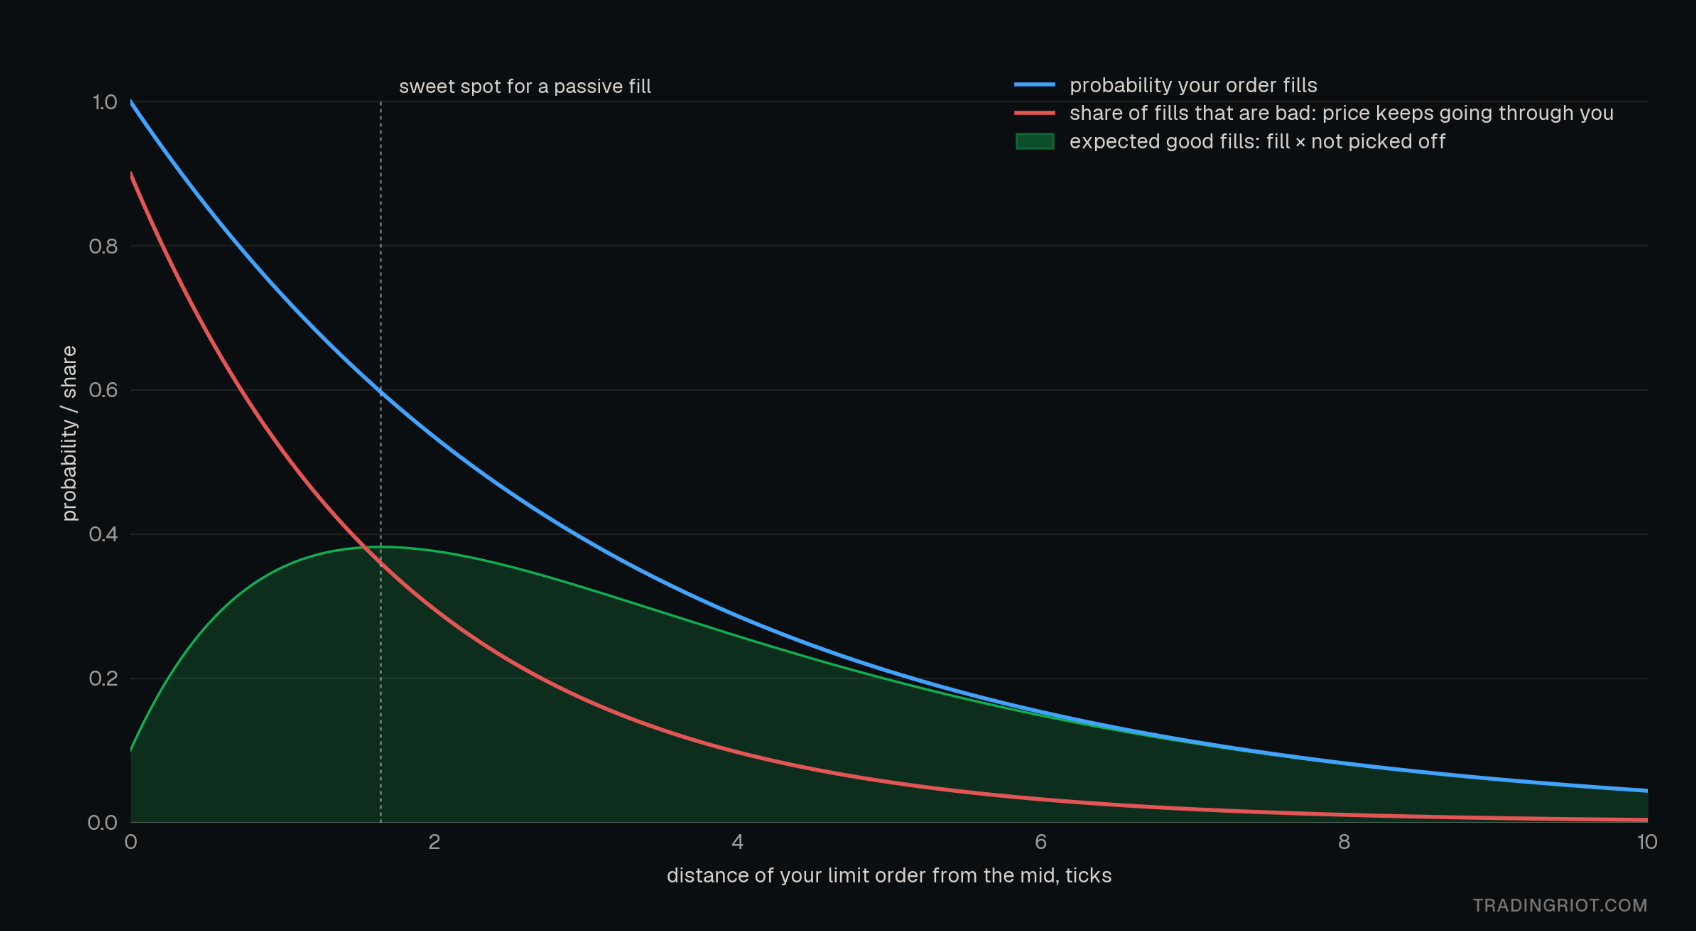
A resting limit order is an option you have written to whoever has information. If the price moves through your level because something changed, you get filled right before the move continues against you. The academic name is the winner's curse. Traders call it getting picked off.
The closer you rest to the mid, the more often you get filled, and the larger the share of those fills that are bad. This is very relevant, especially if the spread is wide; often in options or less liquid markets, you should always work the entry and try to get the best fills you can, despite the possible option of missing out on the trade completely.
Market Orders
The so-called impatient approach, as you aren’t concerned about the price and want to be in (or out) now.
This comes at the cost of paying the spread, usually higher fees, and if you trade a thin market with too much size, a fill is nowhere near the price you see on your screen.
In crypto this is especially costly, where taker fees compound it. On Hyperliquid the base schedule is 0.045% taker versus 0.015% maker. On Binance futures it is 0.05% versus 0.02%. For an active trader doing 50 round trips a week, always taking instead of mostly making costs about 3% of the traded notional every week. While you might not think about it at the moment of taking the trades, this makes or breaks many short-term strategies.
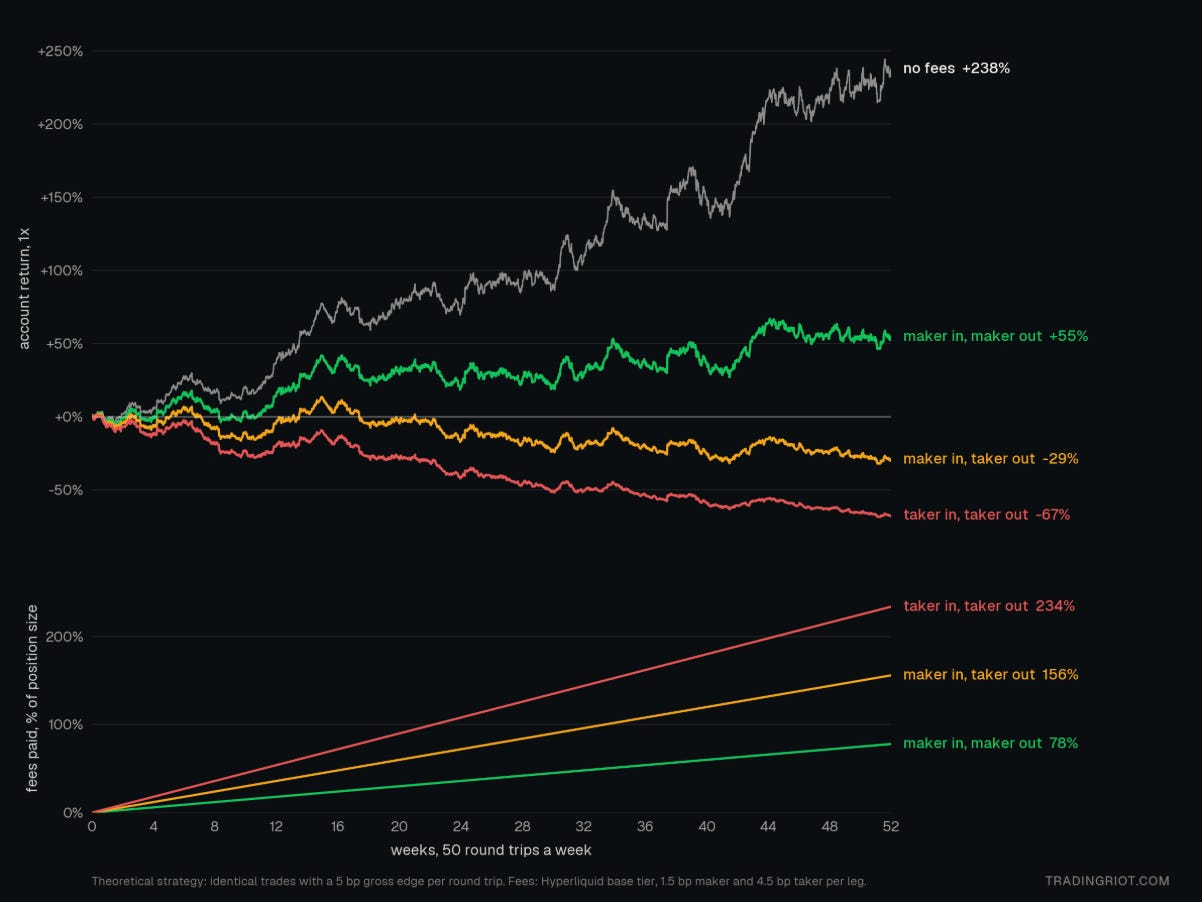
When comparing market and limit orders, you often hear the term “delta,” which is the difference between finalized executions at the bid and the offer.
Stop orders
Finally, the infamous stop hunting: first, as I previously mentioned, stop orders are not visible in the orderbook, they are trigger market orders that activate above the price for buying and below for selling. Traders use them for stop losses, and breakout traders use them to enter.
So why do markets reverse below the key highs and lows?
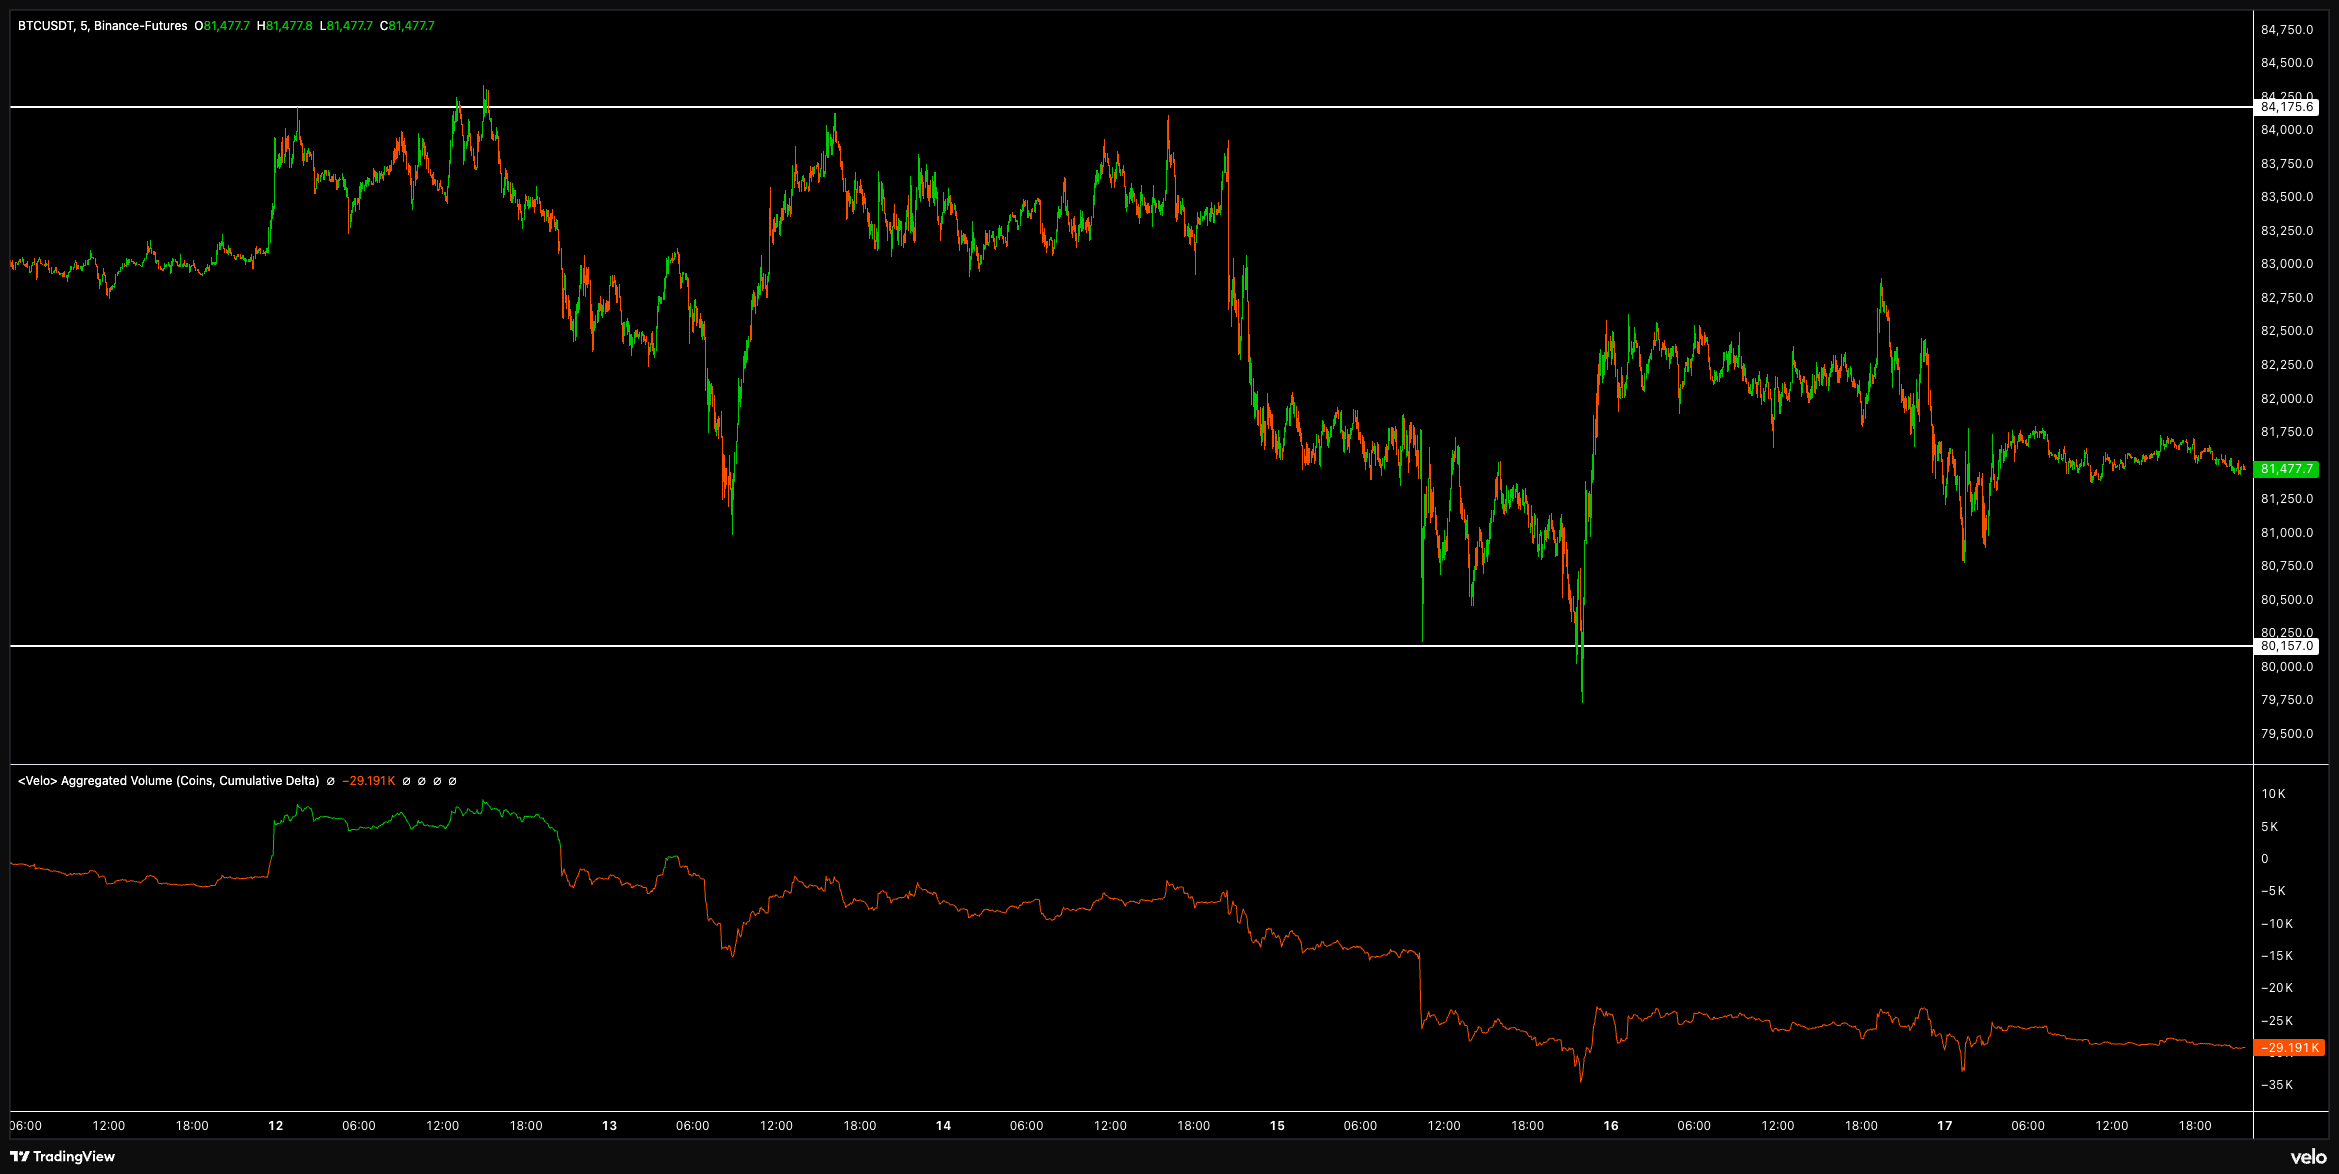
Everyone is looking at the same chart; for this example we will use a Bitcoin chart where the white lines above highlight key support and resistance areas, so you know I am not just making this up. For the sake of the example, here is the zoomed-out chart that shows support and resistance lines someone with very little experience could identify.
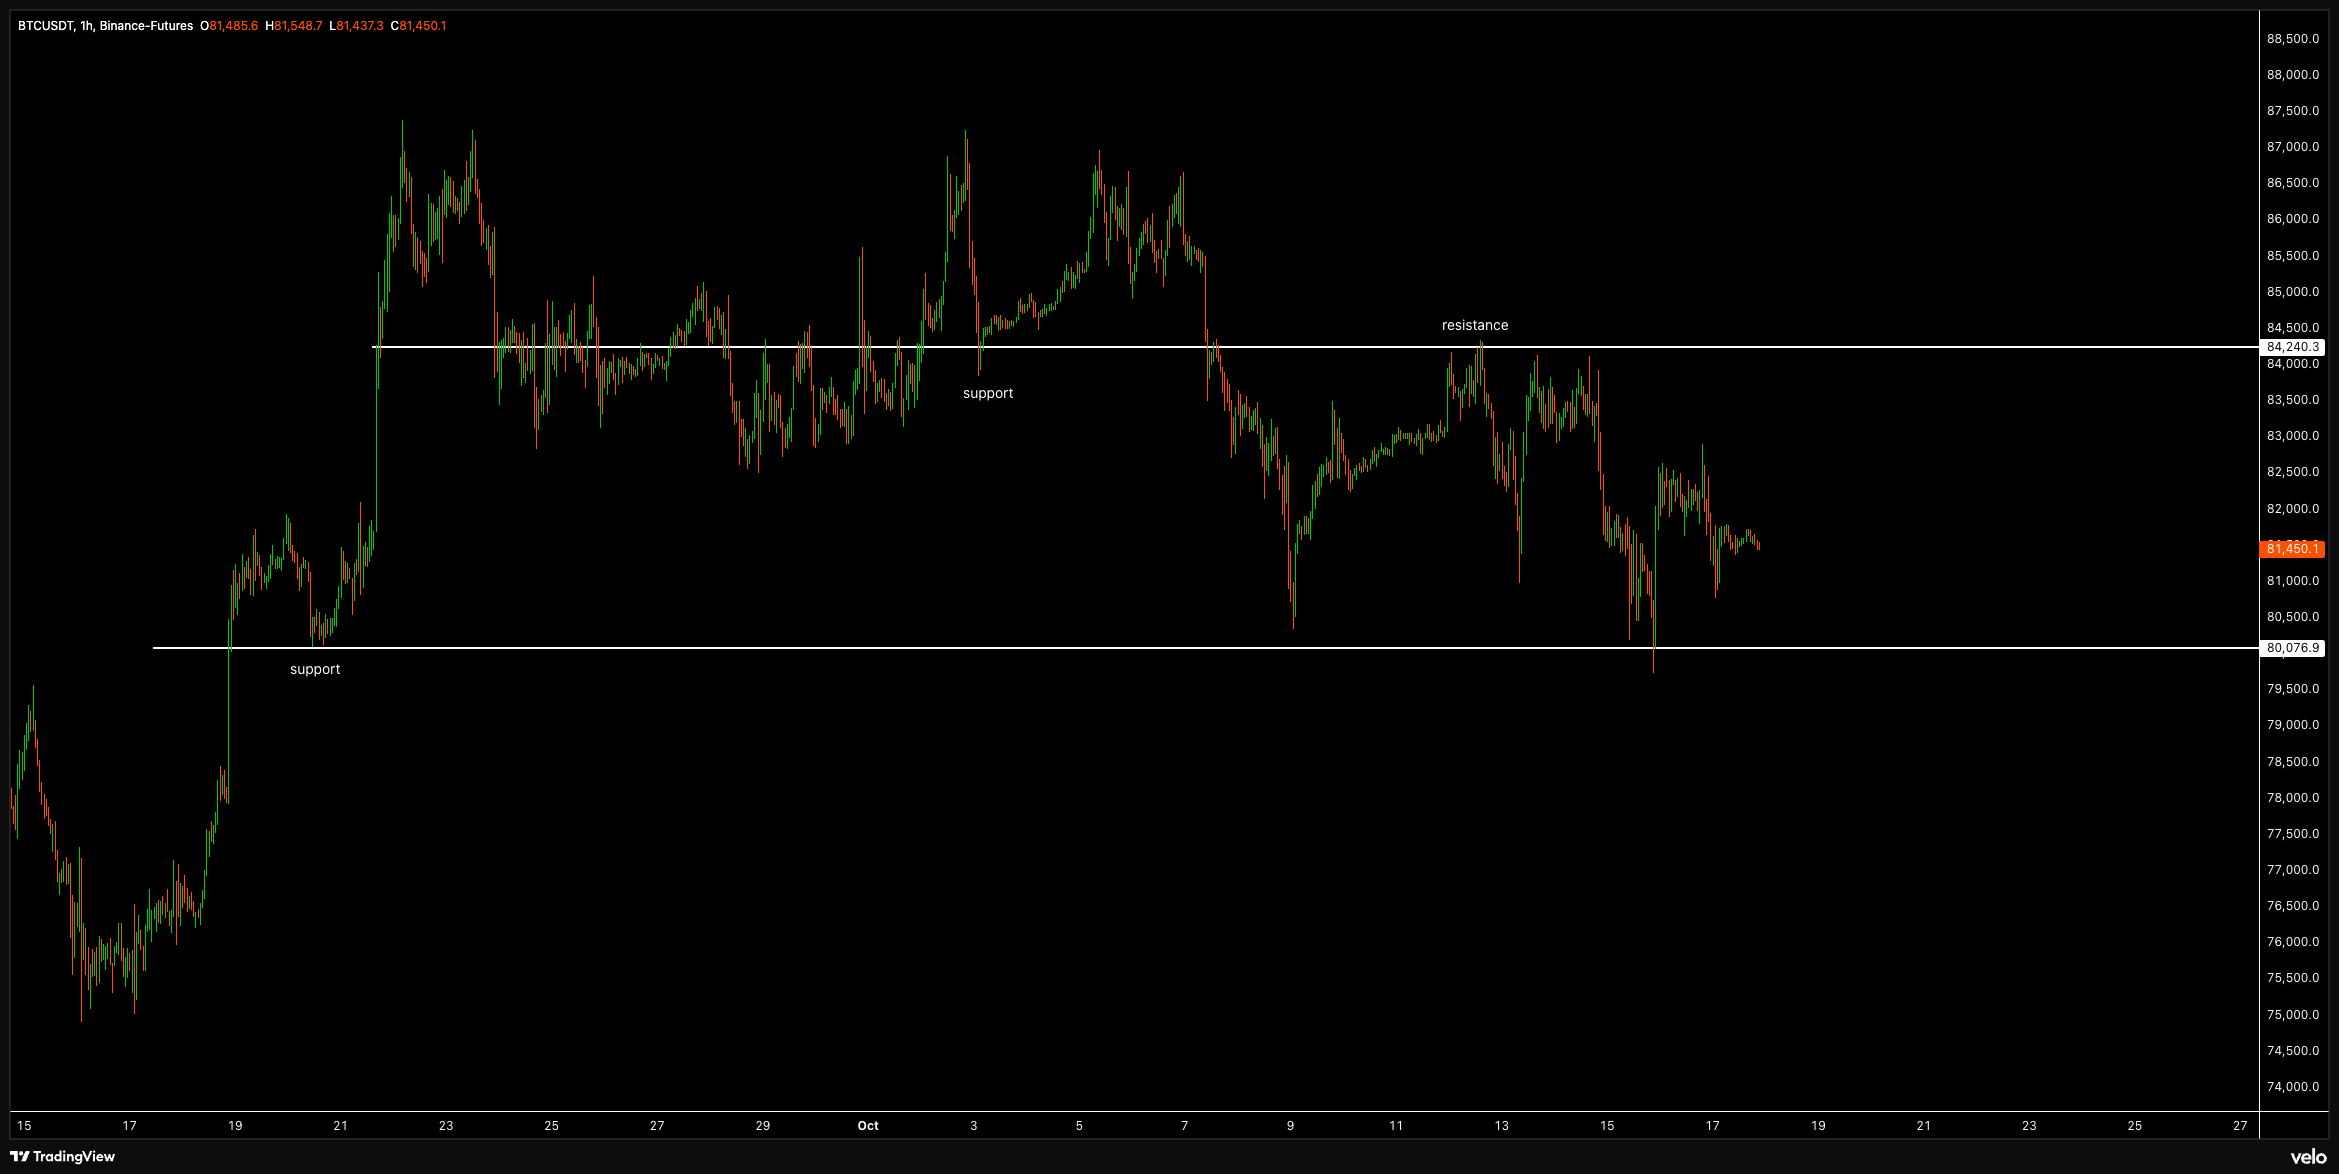
I am going to zoom in slightly more into the support case that happened very recently to break this down a little further.
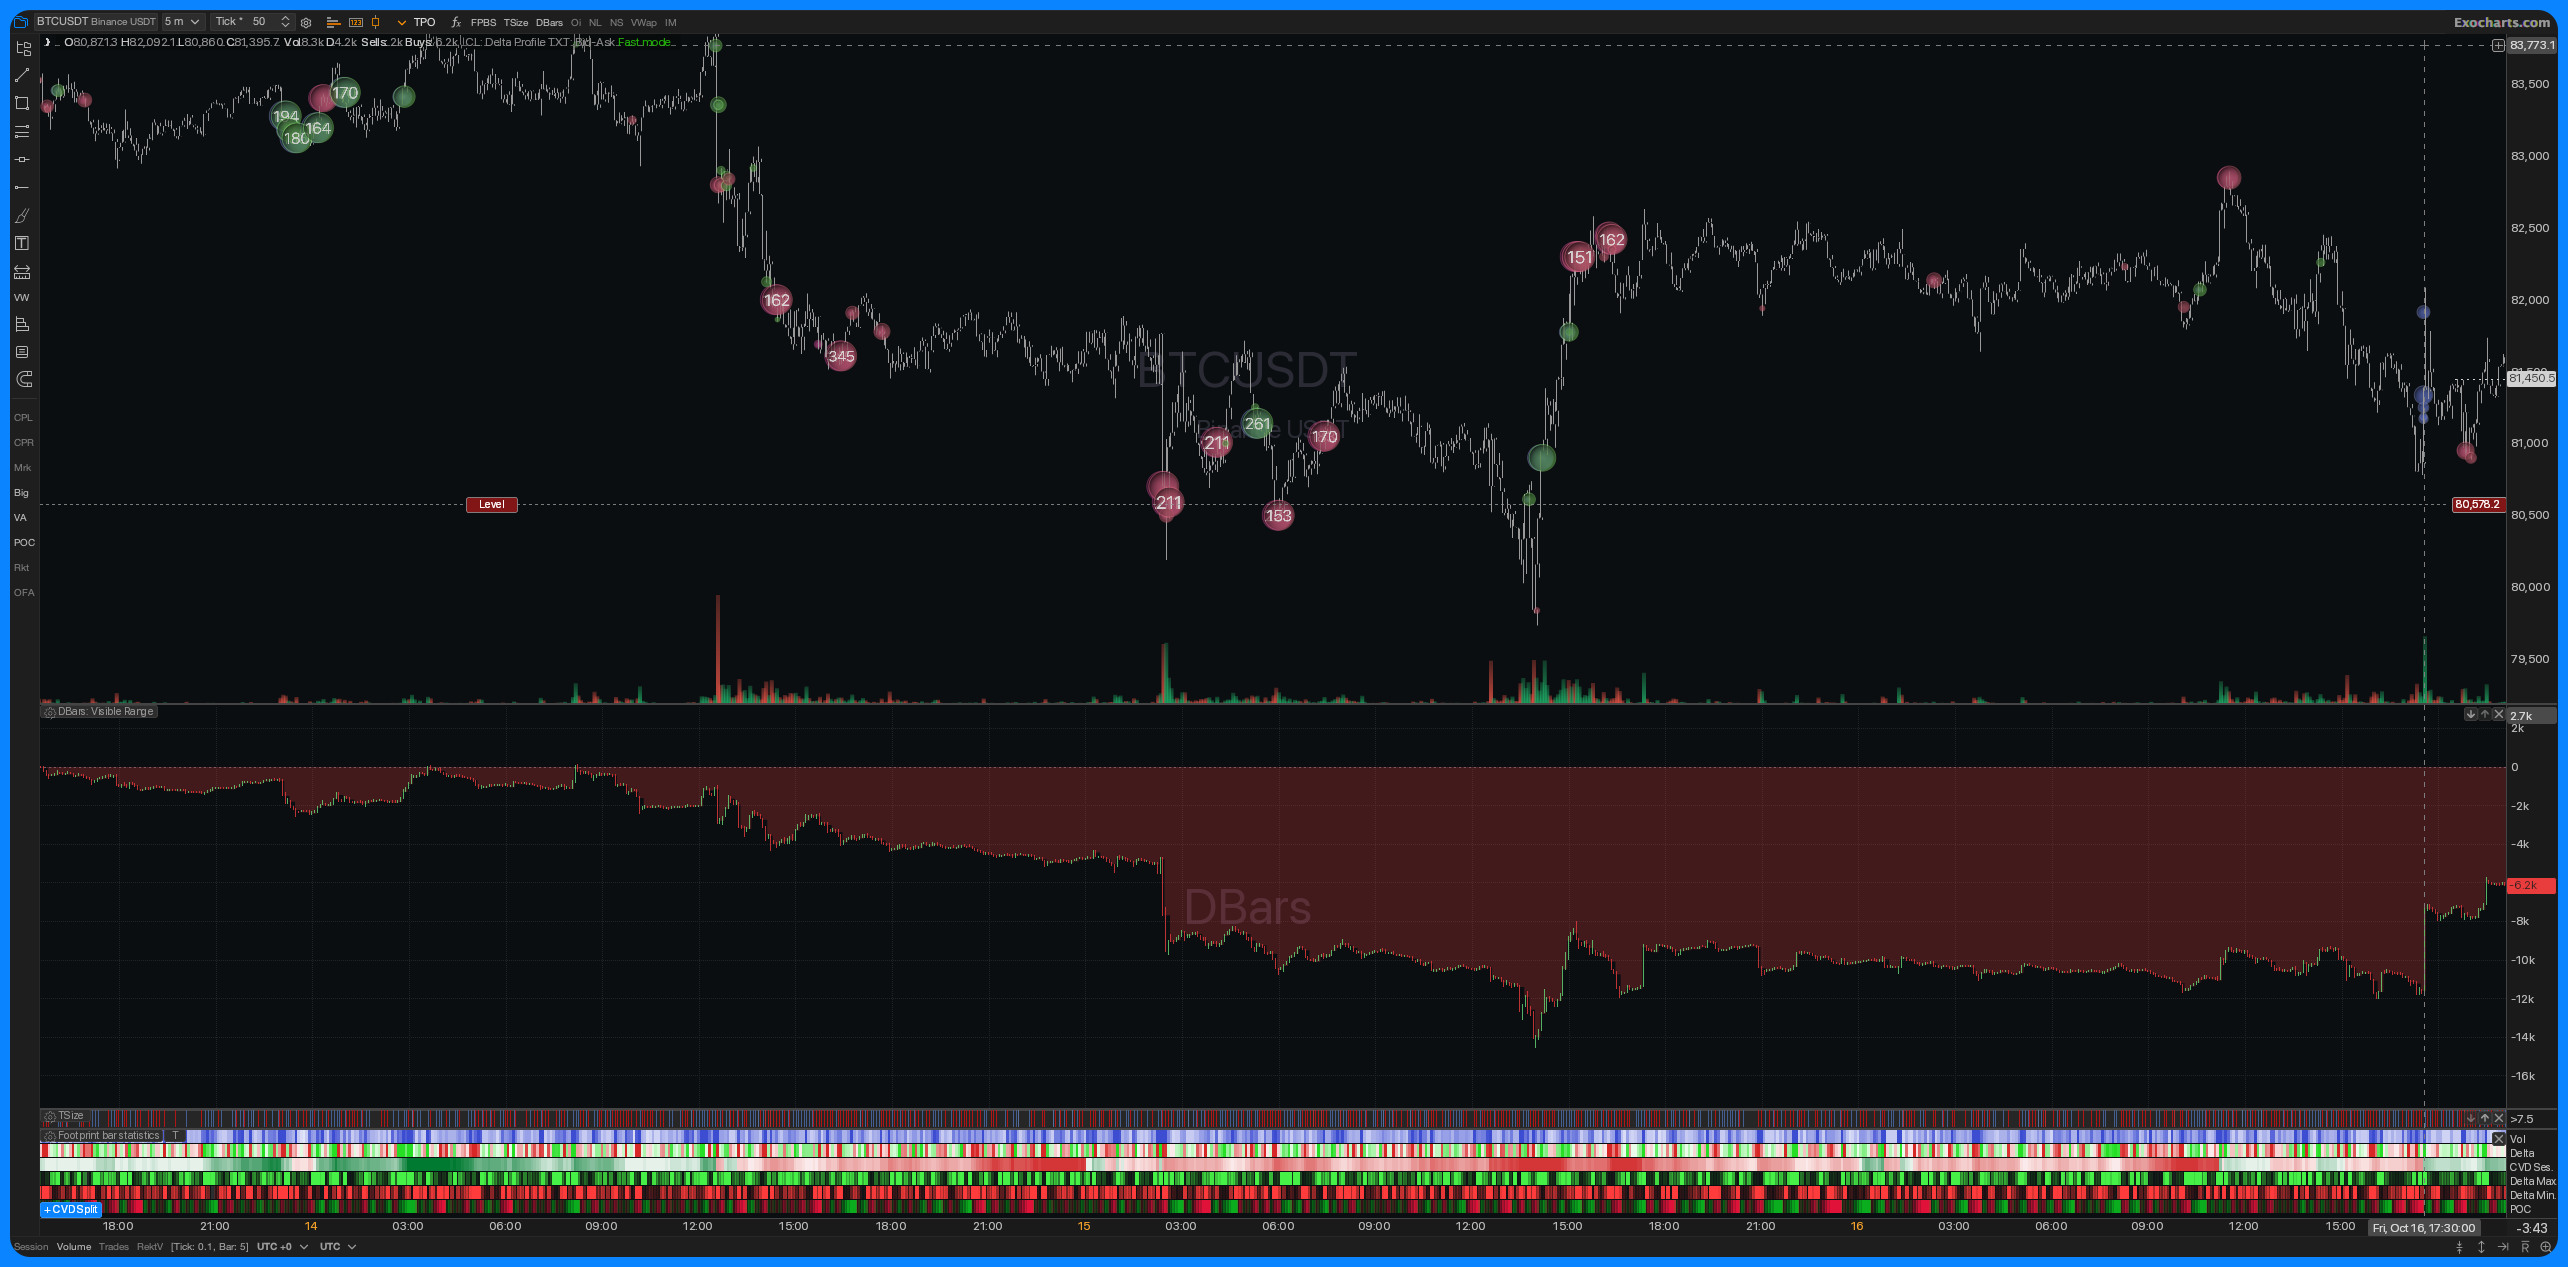
Traders see the same charts, which increases participation at obvious levels such as higher-timeframe highs and lows. Above a visible high, sit two kinds of buy orders: breakout entries from people (and algos) betting on continuation and buy stops from people who are short and need to cover. Both are market orders firing at around the same price.
If a large trader wants to get a sell order filled, this is the perfect area. There is a lot of aggressive buying coming in, so he has an easy time filling his passive sell into it.
The chart above shows the behavior around the support area; the delta bars oscillator represents that delta I just mentioned, which is different between finalized executions at the bid and the offer. In this case you can see there is a lot of aggressive selling coming into the lows, which is a mix of traders betting on breakdown and stops triggering from long orders (since the stop loss on long is market sell).
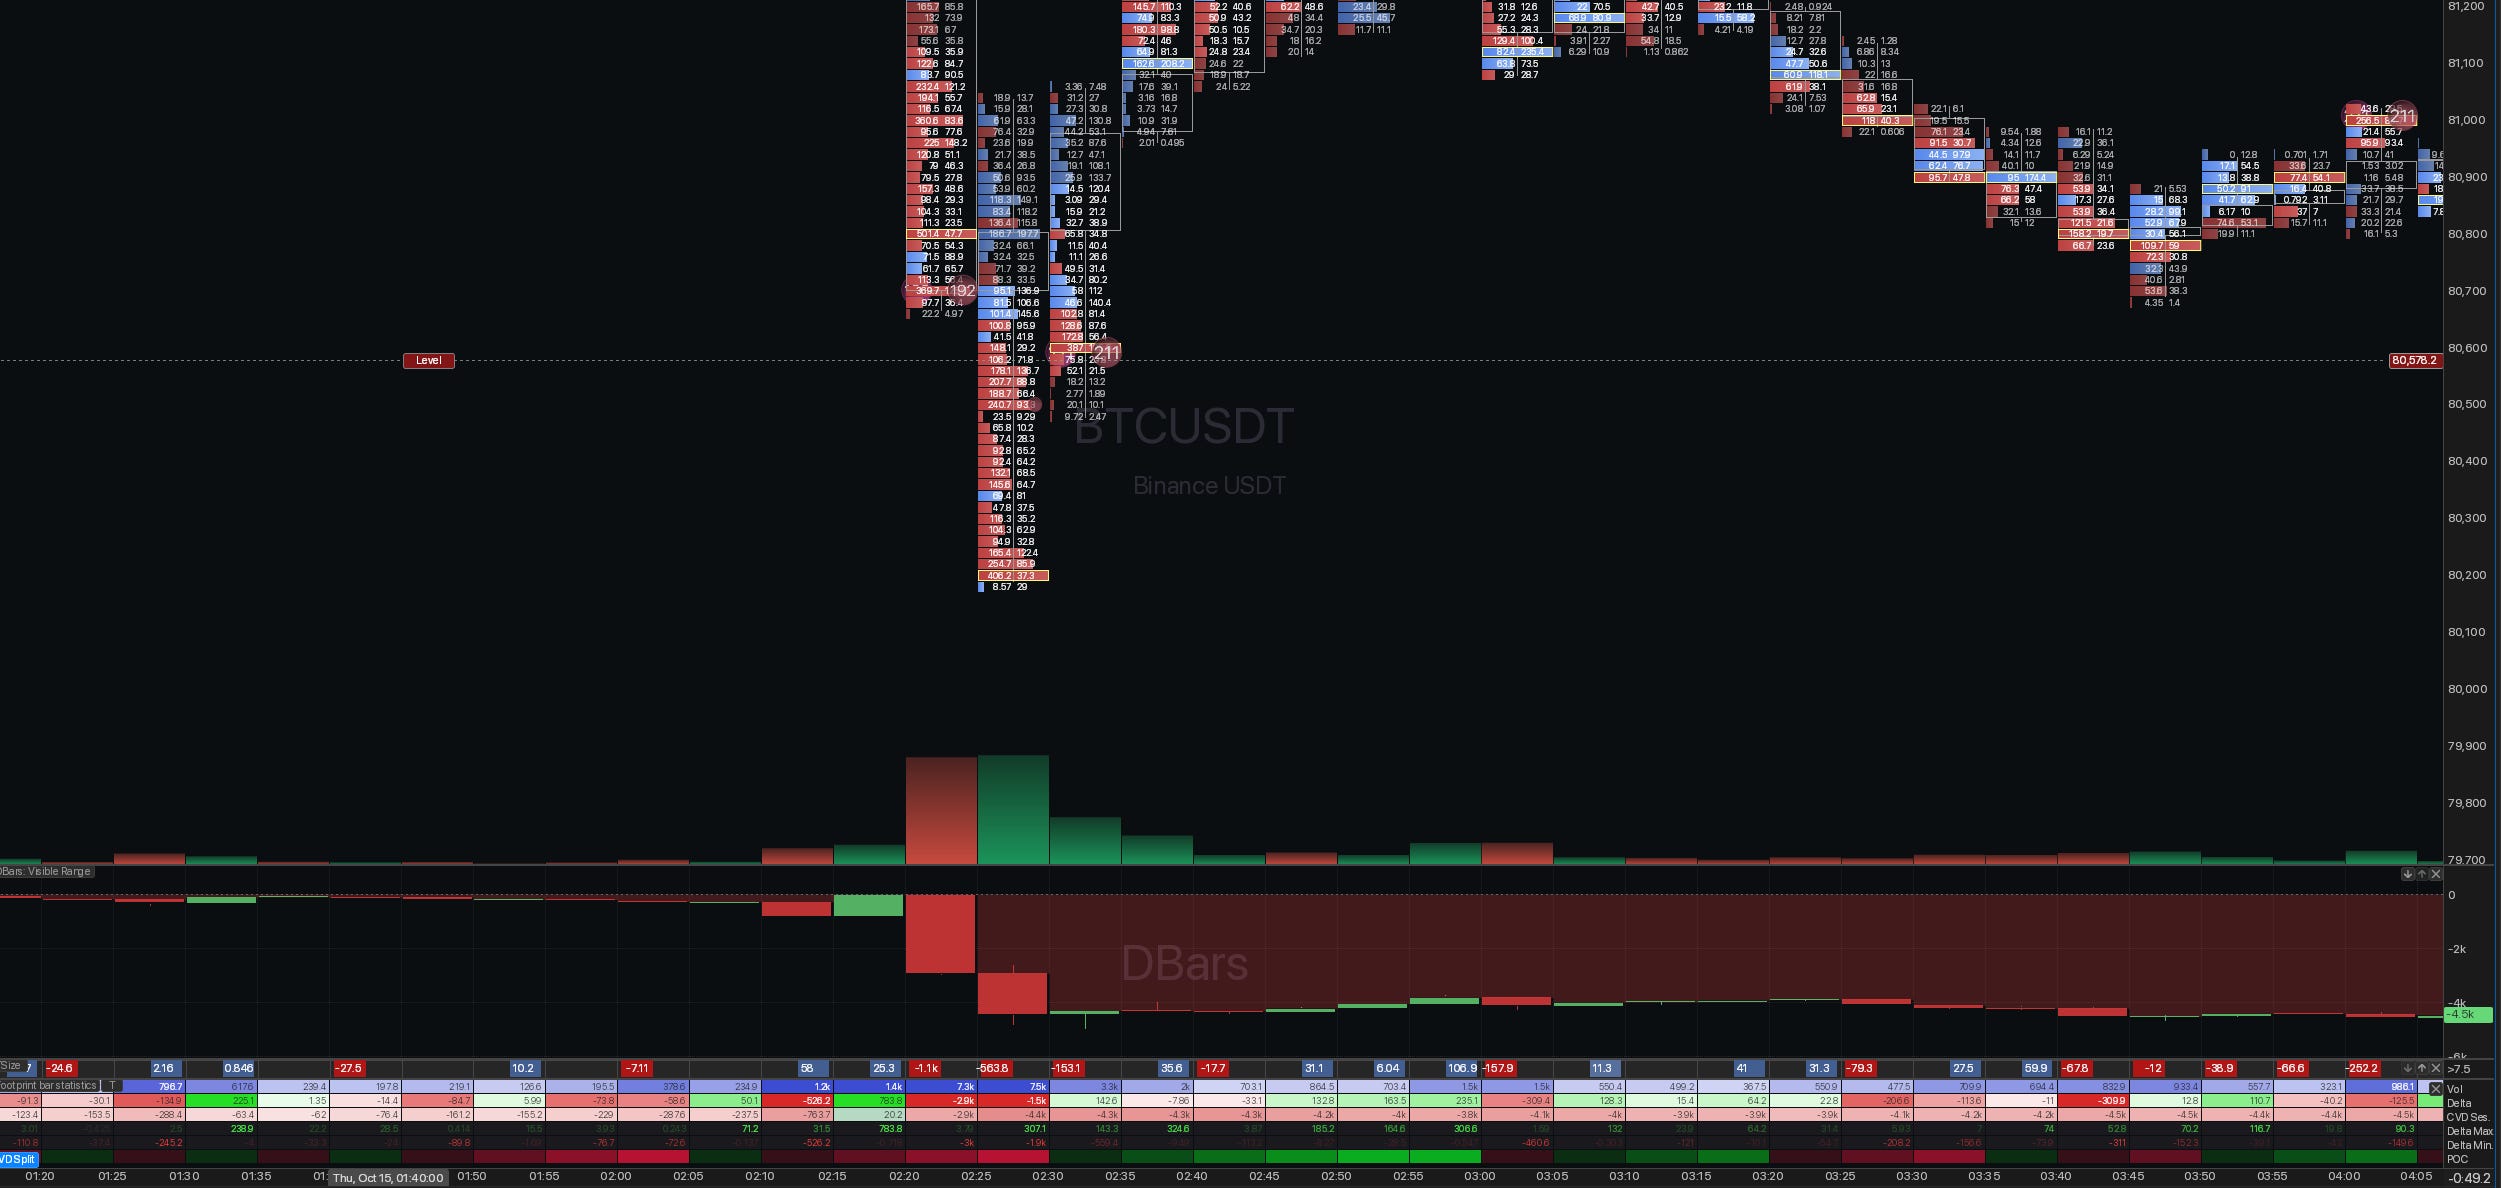
We can zoom in even further using the footprint chart, where you see the pickup in selling below the level. You can also see that price snapped back immediately after breaching the support.
Why? Because someone is taking the other side. This is called absorption. Aggressive buyers got absorbed by passive sellers who were the heavier hand.
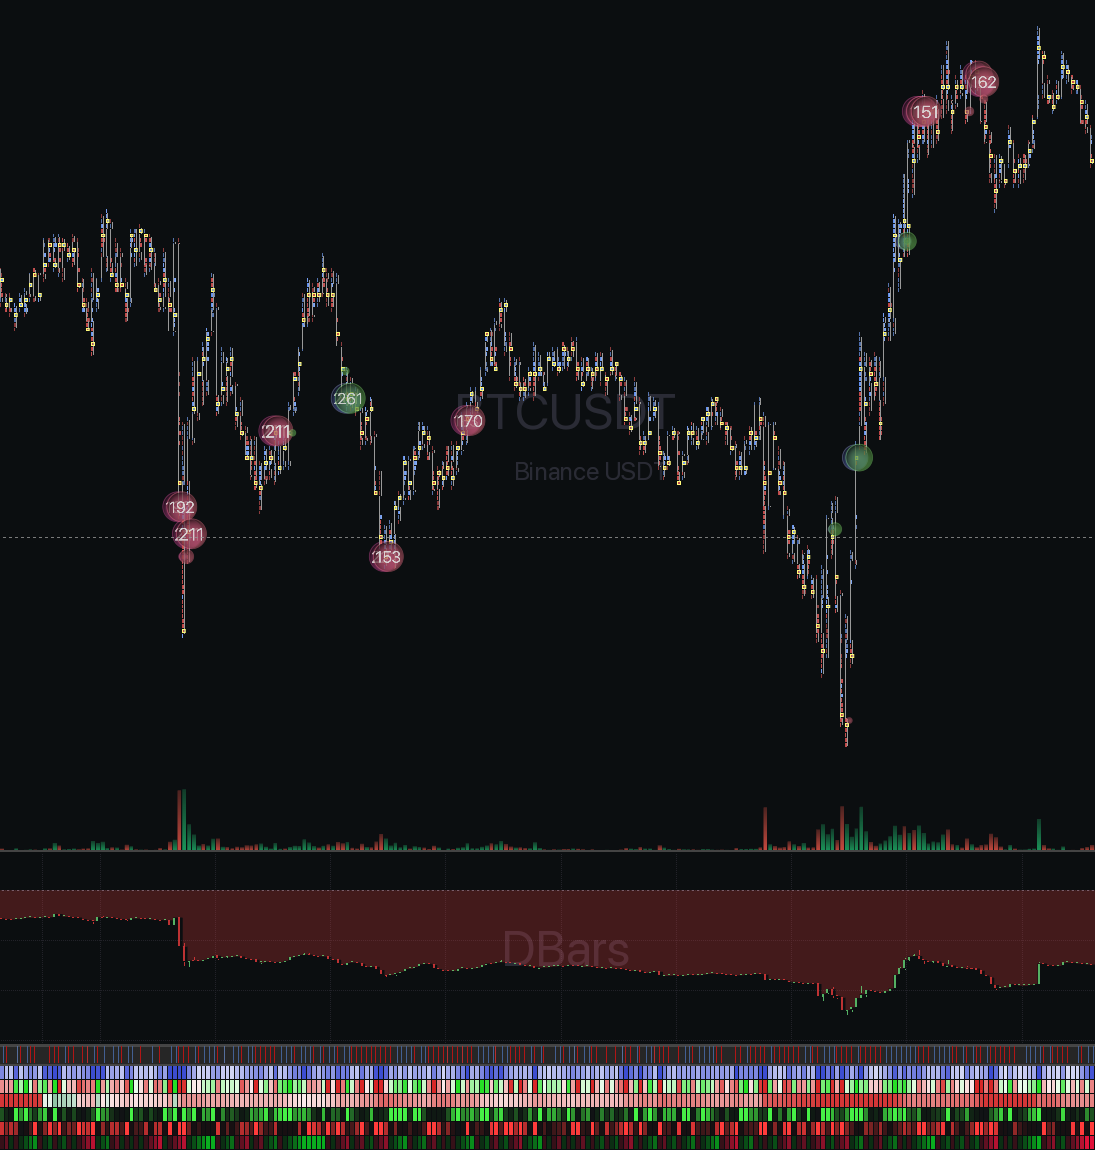
Think about this logically: if you are a larger trader and want to get a filled big position, the best place to do that is in the area where a lot of other market participants are forced to trade or at the key levels, which will draw a lot of attention. This is why support and resistance, key swing points, moving averages, and 26- or 52-week highs and lows make price react; they are not magic, they are just areas where a lot of market participation happens naturally.
So the reason prices react at different levels is due to herding and order splitting; if you trade with a large size, it comes with certain problems. Use a market order, and you get slippage. Rest one massive limit, and your intention is visible to everyone, and you get front-run. Therefore, large traders split orders into areas of interest and fill slowly. These areas then often provide reaction as there is residual orderflow resting.
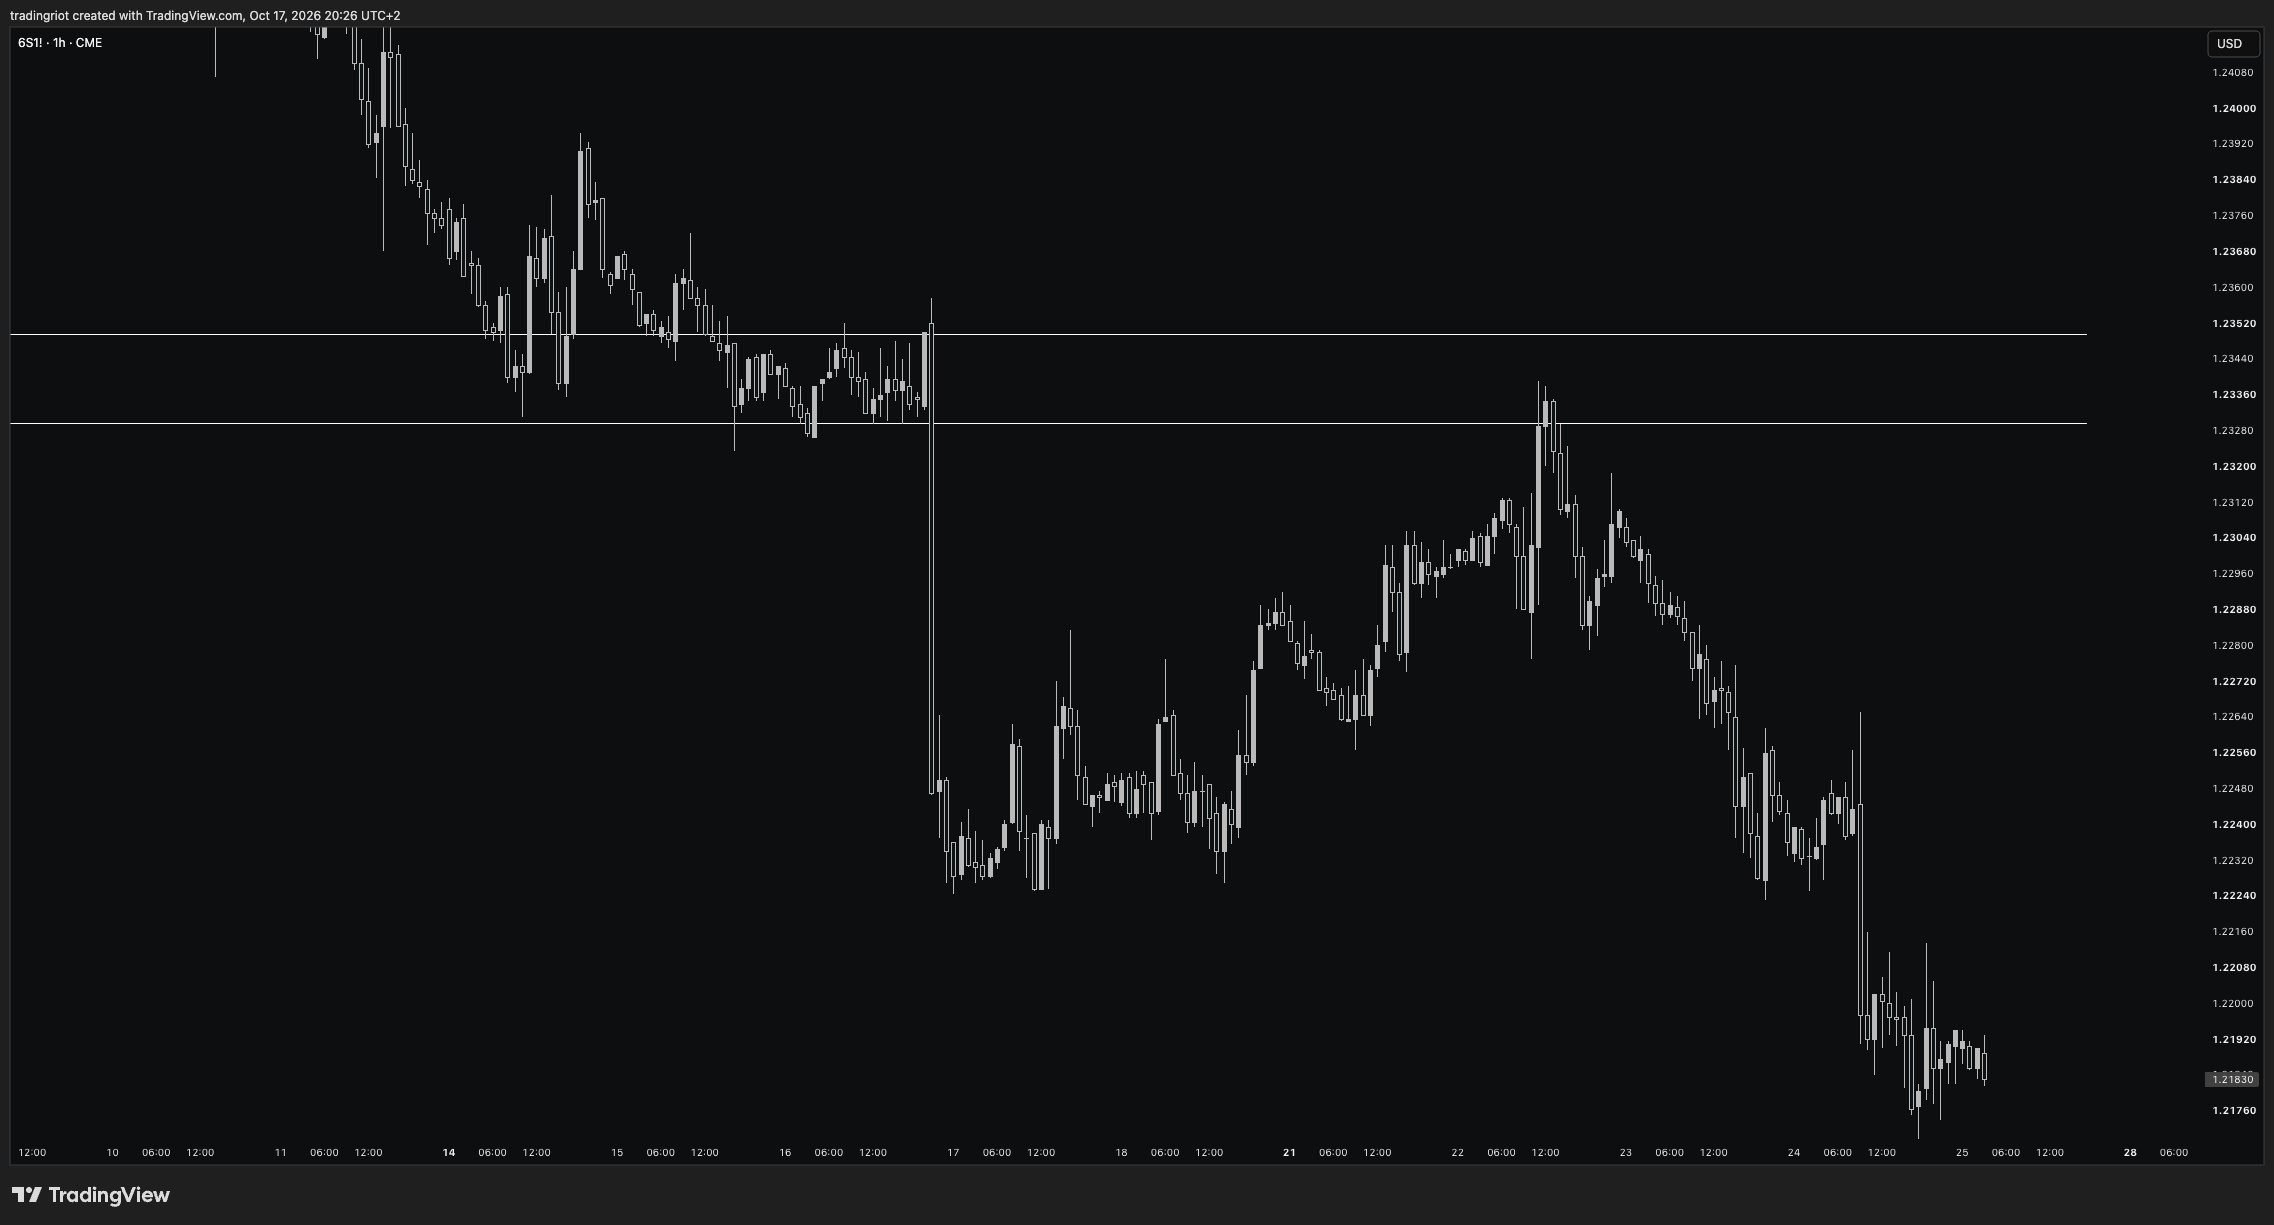
How do you find these areas? If you have a large order to execute, you want to do this during the times when the market is rather calm so there is enough counterparty for you to trade. You have probably heard about orderblocks or supply and demand zones. If you ever looked into some price action trading concepts, this is how these are created, as once the supply overwhelms demand or vice versa, the market tends to react when these zones are revisited, as there are still some residual orders pending.
While technical analysis can be subjective, volume and the market profile show a clear picture. Looking at where the most volume was executed and where the market “picked up the pace” can be useful to use.
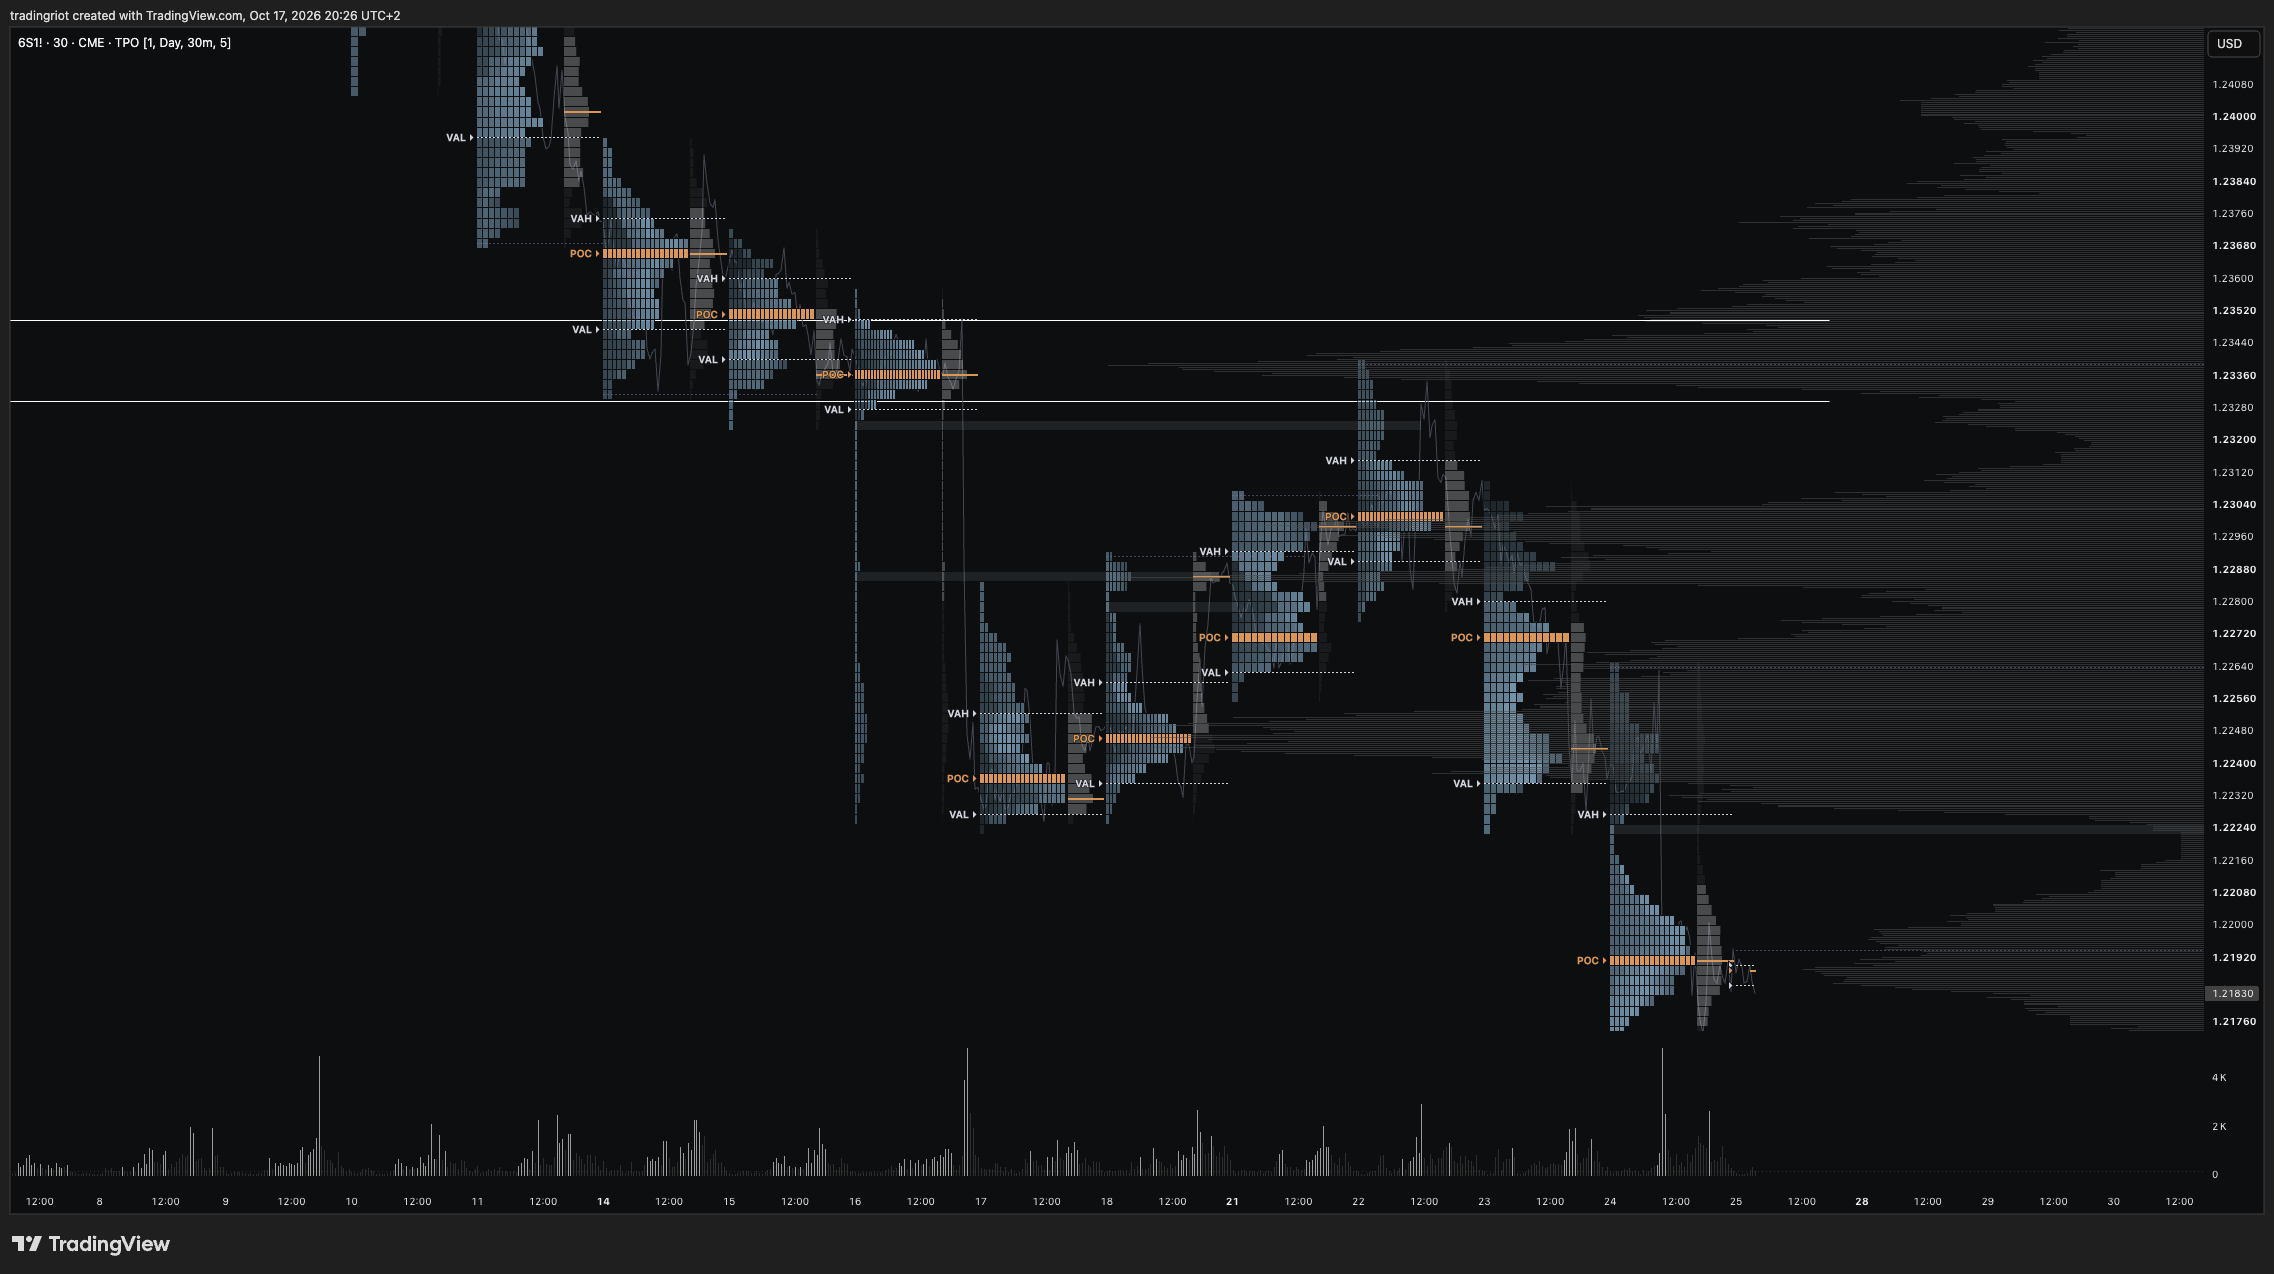
Other than that, obvious levels and indicators like prior week, month, and year highs and lows, daily moving averages, and other give reactions. Like I said, there is nothing magical behind them, but there are so many strategies and algorithms evolving around these that they will naturally bring a lot of trading activity.
This is why higher timeframe levels and indicators play a bigger role. Prices are fractals; the 10th of October in crypto is a liquidation event that happens maybe once per few years and plays out over hours to days, but smaller liquidation events play on intraday charts multiple times per month.
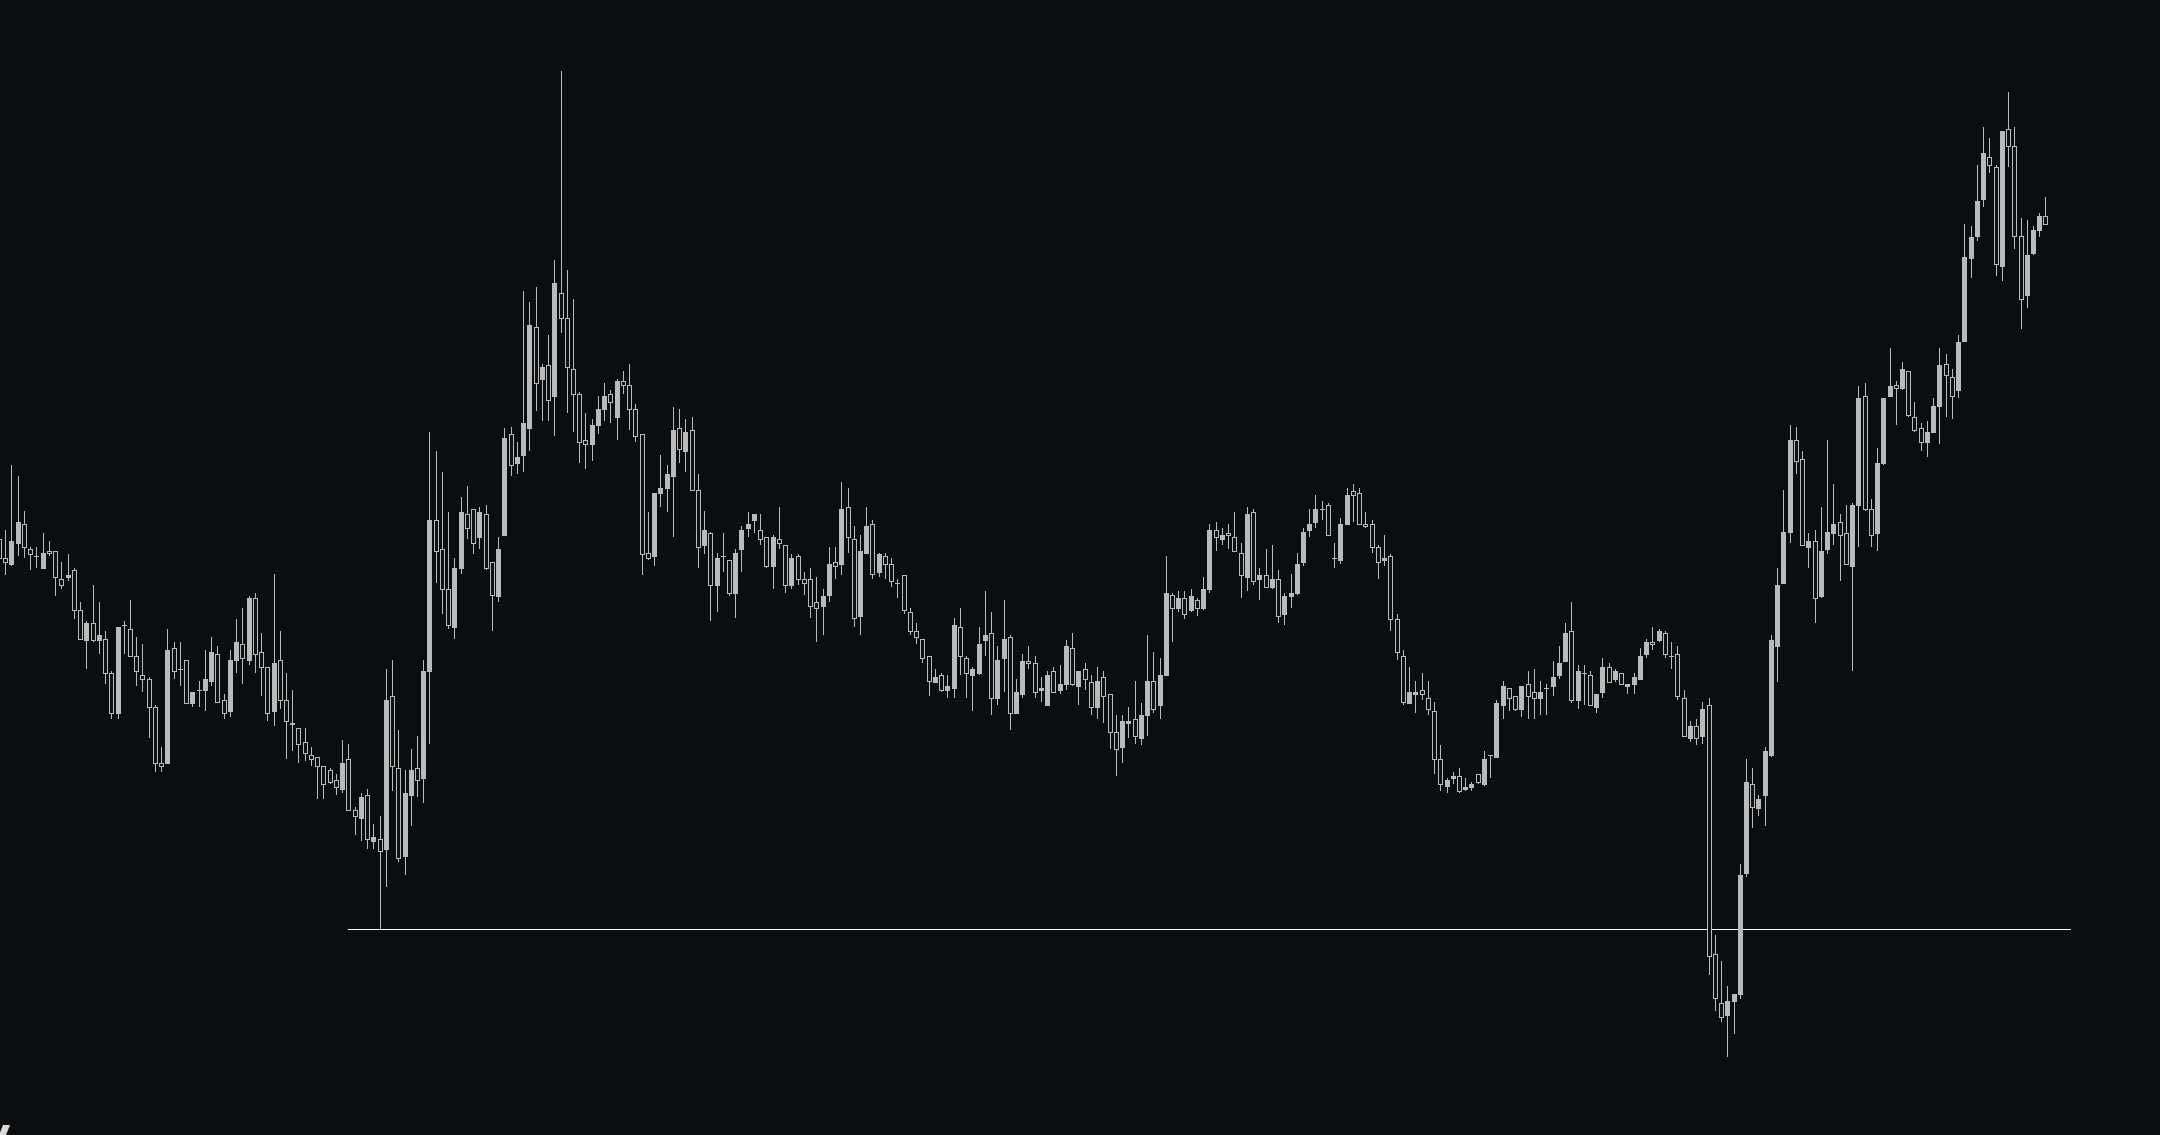
Without me telling you, you won’t be able to guess what timeframe this is or even what market it is, as what we covered today is fundamental to every single market. I am a big proponent of timeframes not really being relevant; it doesn’t matter if you look at an hourly, 30-minute, or 47-minute timeframe, but again, because of herding, a 200-day MA is much more likely to give a reaction and bring important trading activity compared to 18 moving averages on a 90-minute chart.
Advanced order types
These days, a lot of more sophisticated trading platforms and terminals offer so-called advanced order types. While there are not new order types, it is always a limit, market, or stop order you are putting in; the way you do it matters, as it can improve the execution efficiency.
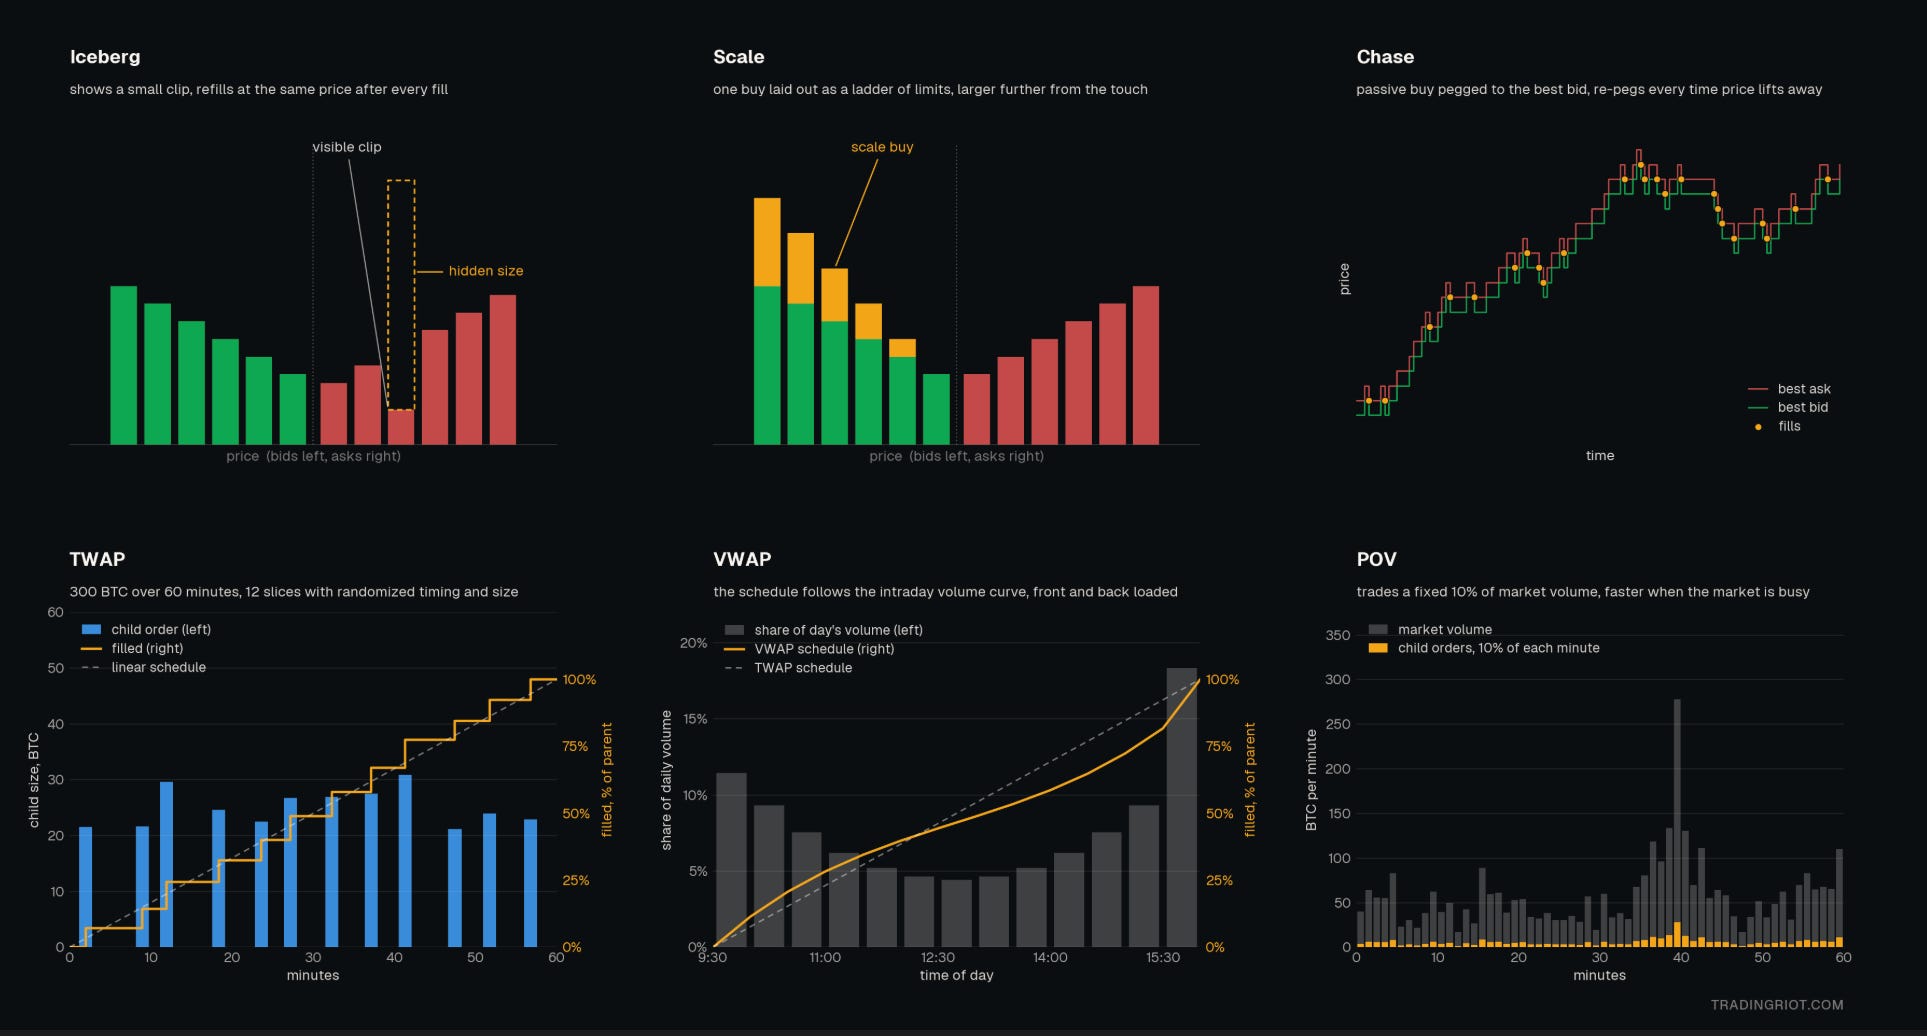
Iceberg orders only show a small size inside the order book but automatically keep reloading every time the market hits the same price. On the big US exchanges, non-displayed orders were about 20% of volume in 2025. On Nasdaq, hidden liquidity has been found sitting at the best quote about 72% of the time.2
Chase orders follow price and keep re-pegging a tick away as it moves. Useful when you want to get into the market immediately but don’t want to use a market order.
VWAP is following the daily volume curve to execute trades trying to adapt to actual trading activity, TWAP executes equal slices over a set time instead of all at once.
Pov, or percent of volume, trades based on a pre-set participation rate, say 10%, and it trades 10% of whatever the market trades, minute by minute.
Types of venues
These days you can trade stocks, crypto, forex, or futures on entirely different venues, while the asset you are trading will be the same; the matching mechanism will be thoroughly different.
Lit order books
So far all the examples in this article, have shown trading using central limit order books. Futures (CME, Eurex), stocks (NYSE, Nasdaq, LSE), and crypto (Binance, Bybit, Hyperliquid, and many others) run central limit order books with price-time priority.
Everyone sees the same quotes without knowing who posted them, the executed volume is transparent, and trading works in the form of a queue.

If I want to long 0.01 BTC here and want to trade at the best bid, after placing my order, it jumps to 9.23 and then to 9.24. Since I was the last one to put this order in, the 9.23 BTC has to get executed first on this level before my order will go through.
Some futures (short-term interest rates, the 2-year Treasury) use pro-rata matching, or a blend of FIFO and pro-rata, where orders at a price share each fill proportionally in size, which rewards posting big.
Futures that are traded on CME, Eurex etc. are probably the most transparent and easy to understand since they only trade on one venue. There might be different contracts since the futures expire, but most volume usually happens inside the front month; therefore, you will generally have a pretty easy time navigating these.
Crypto is a fragmented market. The same coin trades on dozens of venues: spot, perpetual swaps, options, dated futures, and so on.
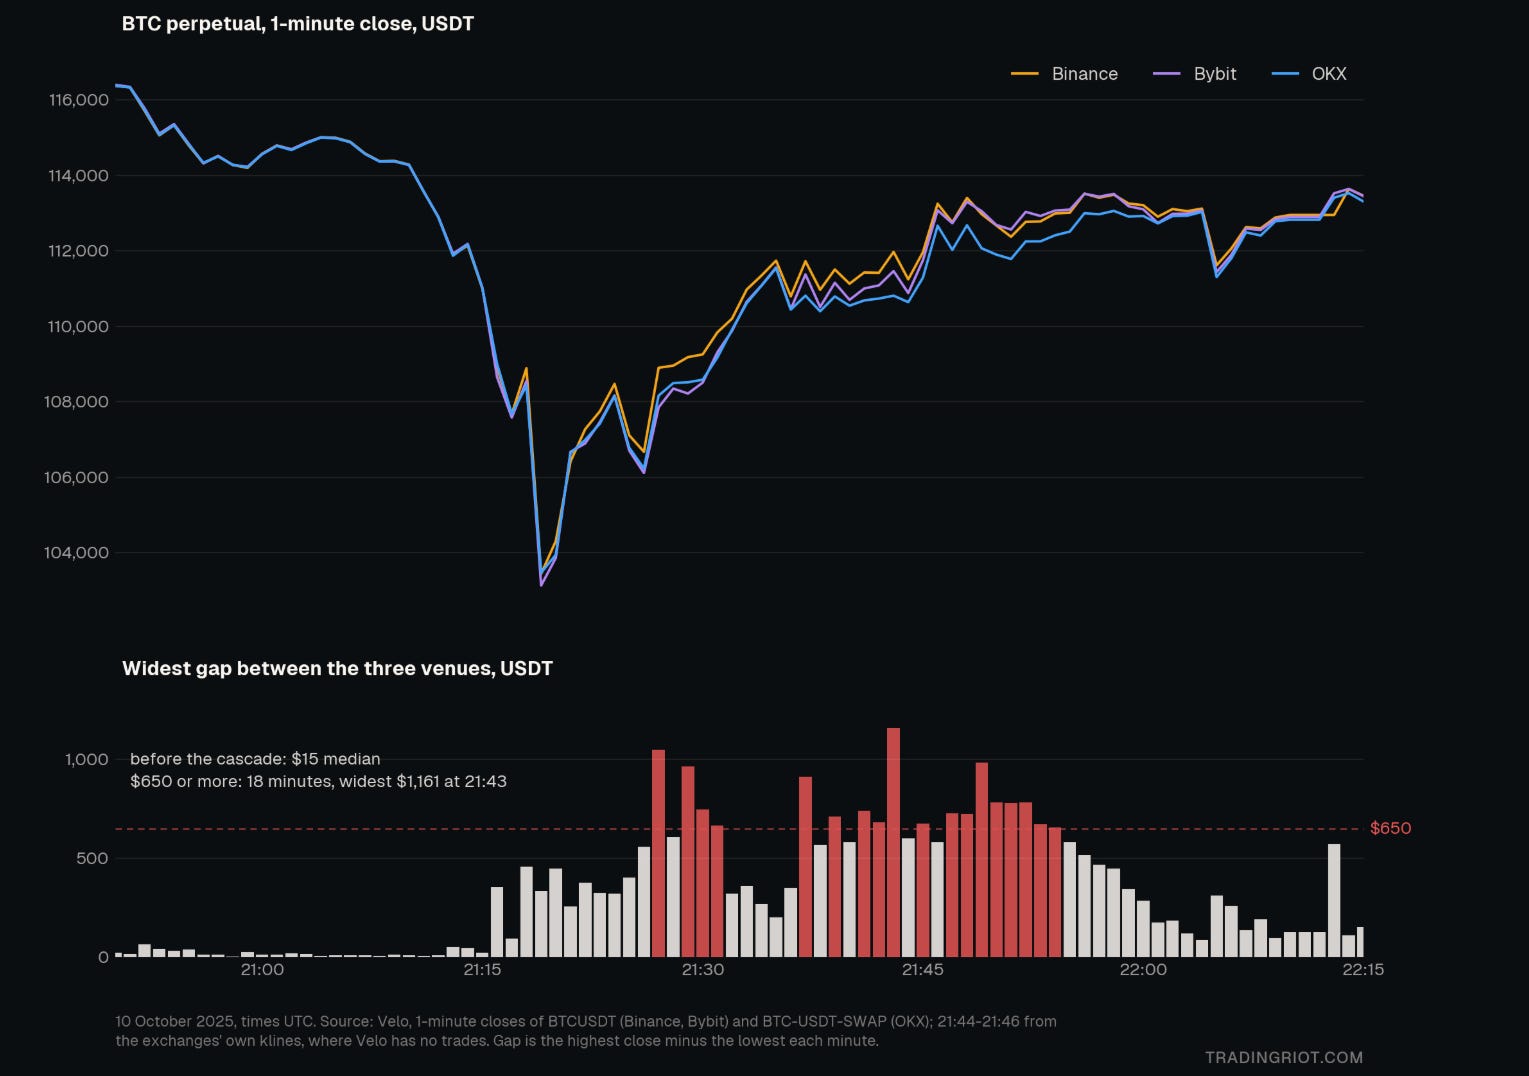
While during most normal conditions prices are tightly close to each other, the fragmentation cracks during price discovery and stress. On 10 October, BTC traded close to $1,000 apart between Binance, OKX, and Bybit for several minutes.
Off-exchange Trading
In 2025, for the first time, more than half of US equity share volume was executed off-exchange3.
So if trading is not happening in the CLOB, where is it going? The vast majority of volume is either internalized or happens in dark pools. Internalizing the volume is done by firms such as Citadel Securities, Virtu, or Jane Street, which buy retail order flow from brokers and fill it against their book.
This is, for example, the case of Robinhood, which has been running on the PFOF (pay for order flow) model. This recently also touched crypto with Lighter Exchange, which is using something similar on-chain.
While this immediately might sound horrible since the market-making firm sees your orders and will hunt your $20 stop-loss, it often is not that bad. Price improves most retail orders versus the public quote, because these firms know retail flow is mostly uninformed and they can afford to. Fees also tend to be lower in the cost of increased latency, like in the example of Lighter.
It is adverse selection in reverse: if the counterparty is known to be noise, the spread charged is smaller. But it does mean your order never sees the lit book, your limit order sits in a queue most flow never reaches, and the “volume” you see on a chart is mostly not where your order went.
Dark pools are something different and not something you will most likely reach; they are private financial forums or alternative trading systems (ATS) where securities, derivatives, and other instruments are traded away from public exchanges.
They are run by major investment banks, high-frequency trading firms, and so on. Trading in a dark pool is beneficial for the participants since they can heavily reduce the market impact at better execution costs. They are less transparent and open to abuse.
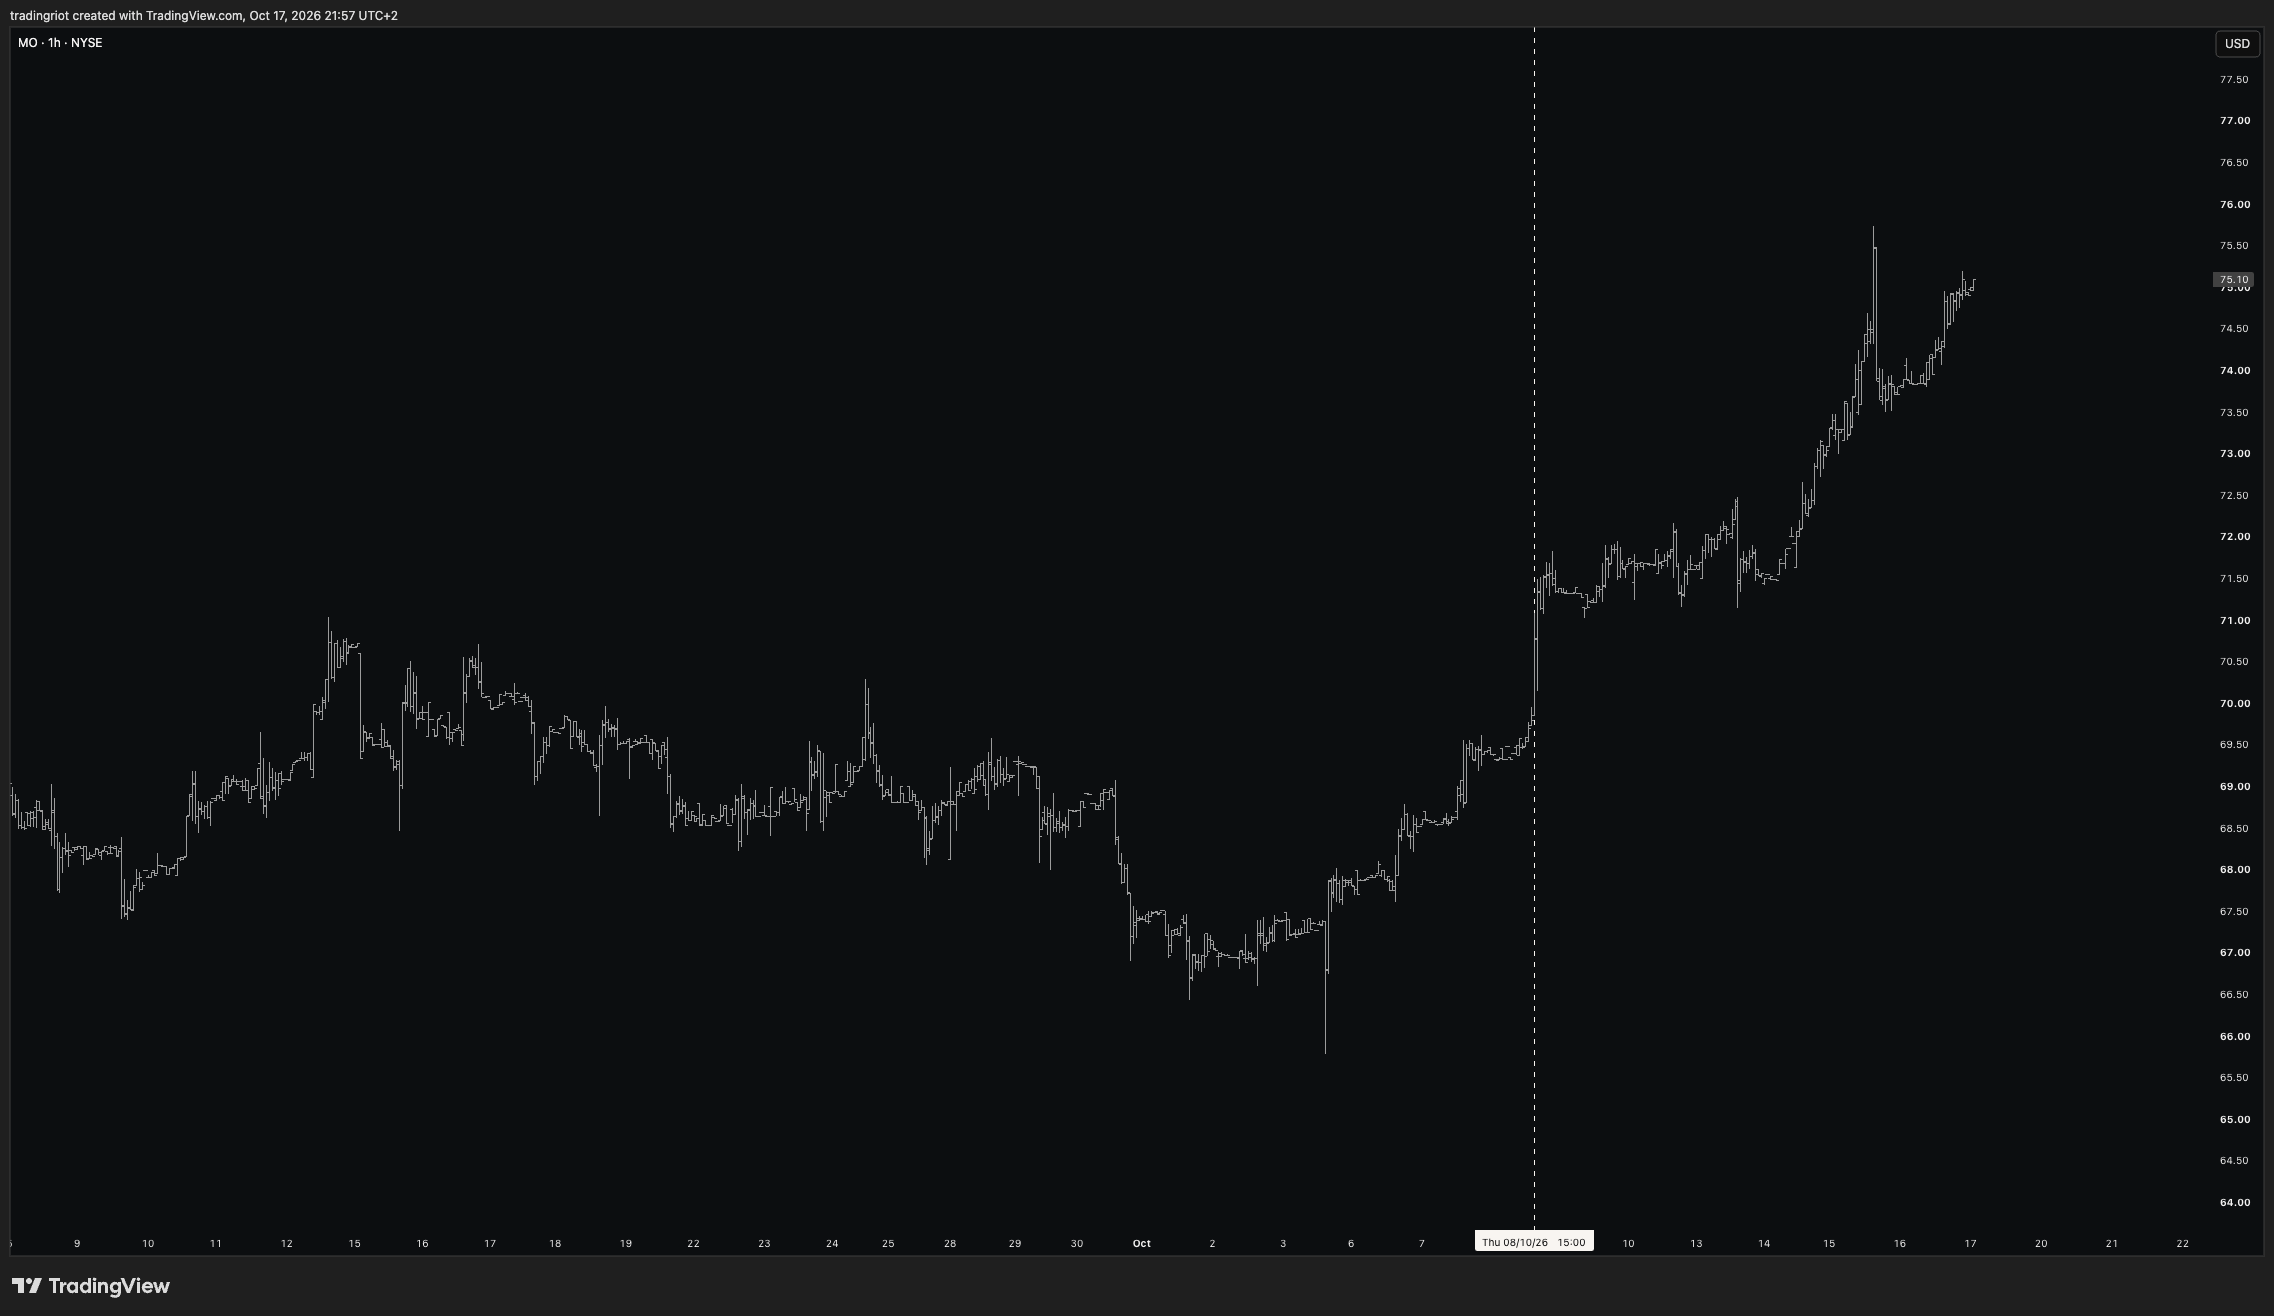
While we can’t trade in dark -pools, we can track the volume executed, which can be predictive of future price moves, like this dark pool buying on MO at the beginning of October.
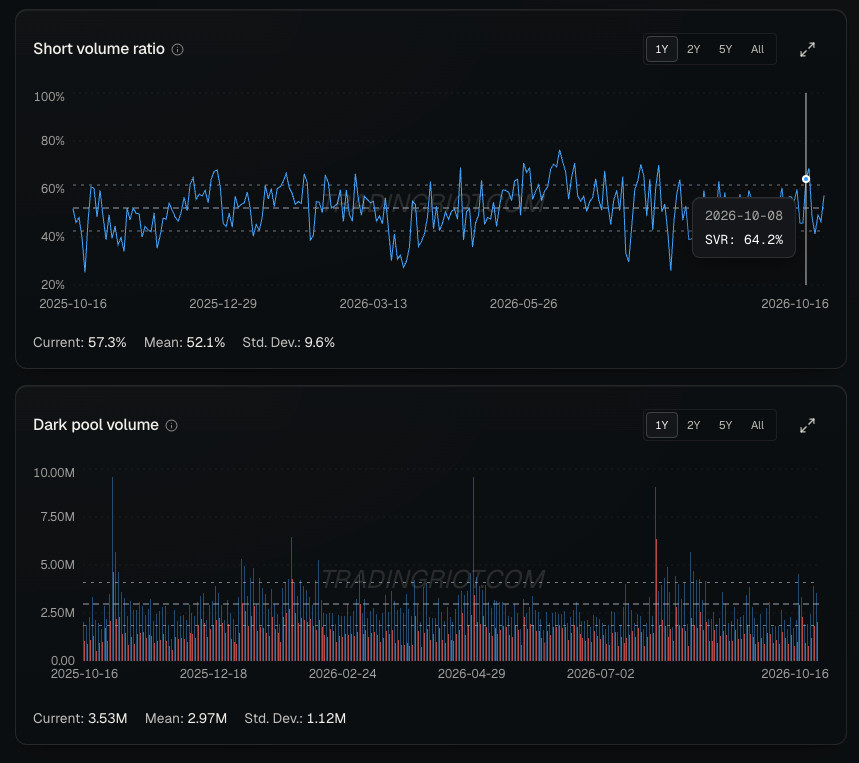
This can indicate informed flow demand for the underlying asset; this data can be found on tradingriot.com alongside other indicators for futures, stocks, and cryptocurrencies.
Over-the-counter and request for quote
The PFOF model is only one way of how off-exchange trading works; while wholesalers that operate PFOF models with exchanges get offers routed automatically, there are other types of off-exchange trades you can encounter.
If you trade over-the-counter, you trade directly with a counterparty, usually a dealer who takes the other side from their inventory. This model is popular in crypto and retail forex brokerages. In crypto, OTC is heavily utilized for large trades and also trading low-liquid assets for higher size. OTC firms simply give you a quote, and you either accept it or not.
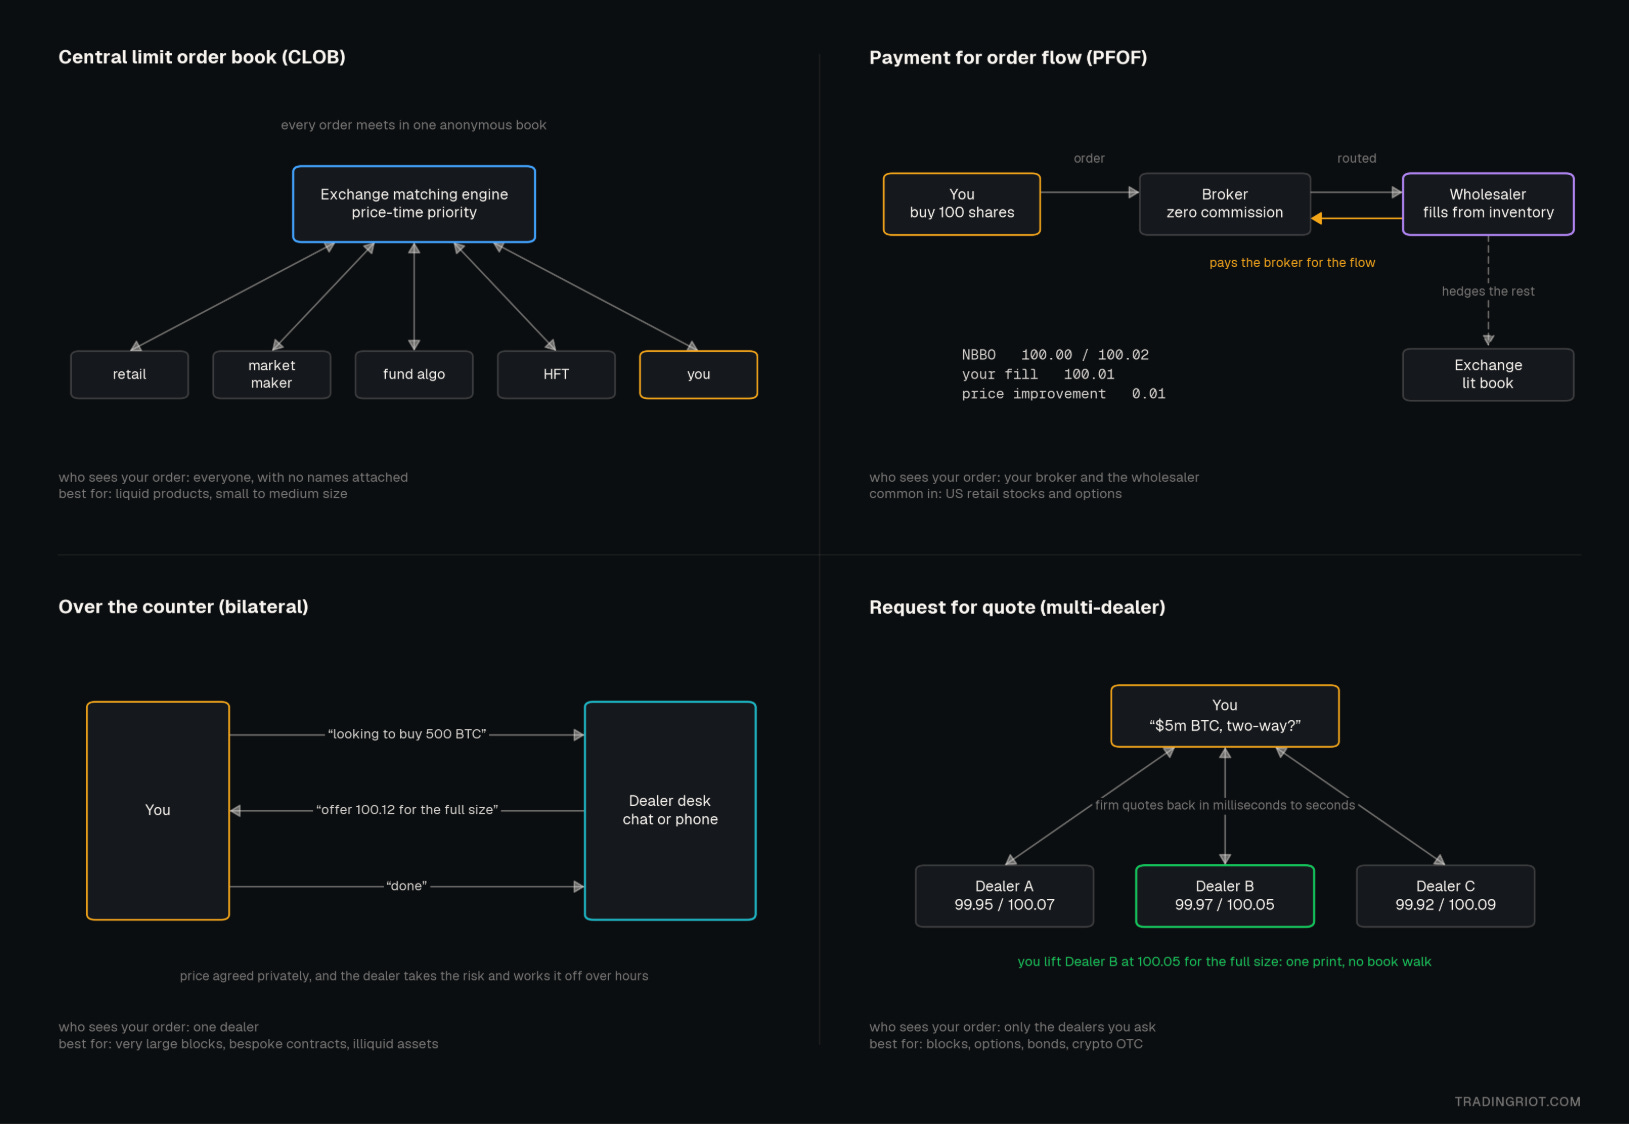
RFQs are similar, but instead of one counterparty like in an OTC trade, you get offers from multiple dealers at once. This model has been recently popularized in newer decentralized exchanges since they can provide better trading conditions for users instead of using the CLOB model.
Forex and CFDs
Forex is traded over the counter between banks. It is the most liquid market in the world, with trillions of dollars traded every day with no central orderbook to look at.
Retail traders never touch the interbank market. They trade solely against their brokers; this is what made the forex and CFD space extremely popular, as brokers often reside in exotic jurisdictions, offering traders massive leverage under countless shady circumstances.
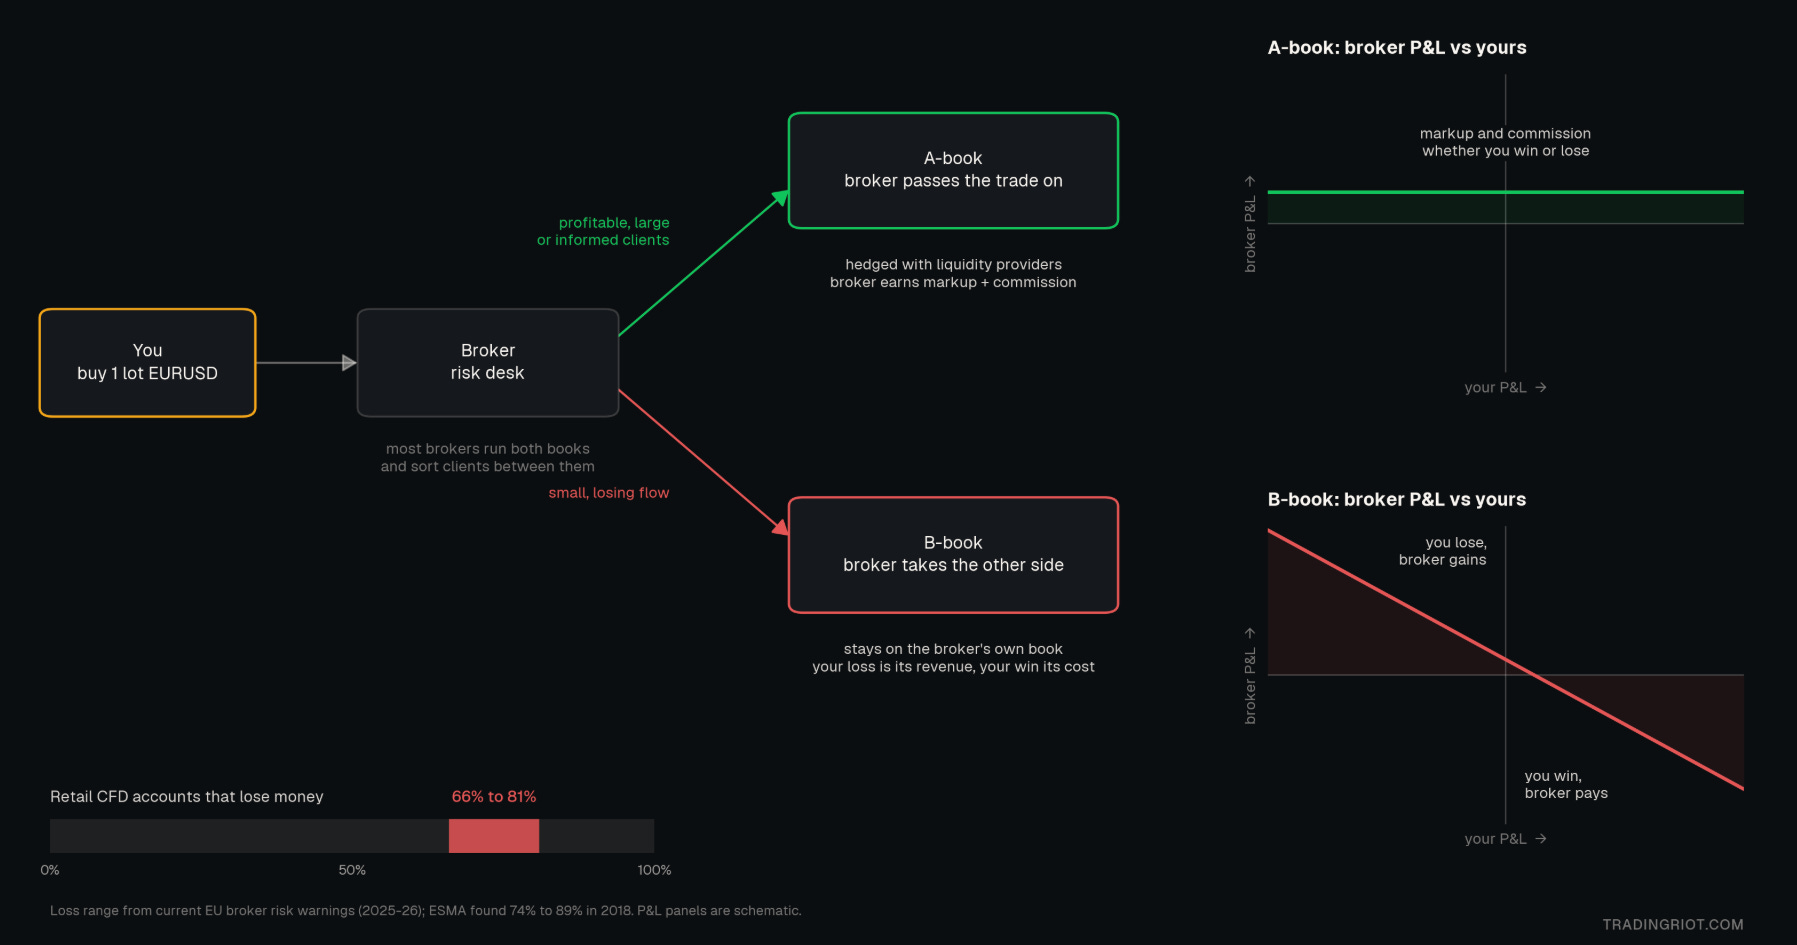
There are two different models in this space: A-book or B-book. In A-book broker passes your trade to liquidity providers and earns a markup or commission. A B-book broker takes the other side of your trade and earns your losses. Most brokers run both models, and you never really know where your orders end.
Since the majority of retail traders lose money over the long run, B-booking is beneficial most of the time. Since this space lacks a lot of transparency, you can face some shady conditions, such as widening spreads during less liquid hours, news, etc.
Orderflow tools
Now that you have the framework, here are the tools traders use to see orders in real time when trading markets with CLOBs, such as futures or crypto perpetuals.
These are orderflow tools. All of them are best used for short-term trading. If you only swing trade, there is still some use in them, but it is more nuanced and mostly for narrowing down the high-timeframe ideas.
Depth of market
The DOM shows the orders resting at each price. Bids are in the left column, and asks on the right. On an advanced DOM, the middle columns show what got executed at each price, and the left side carries a volume profile.
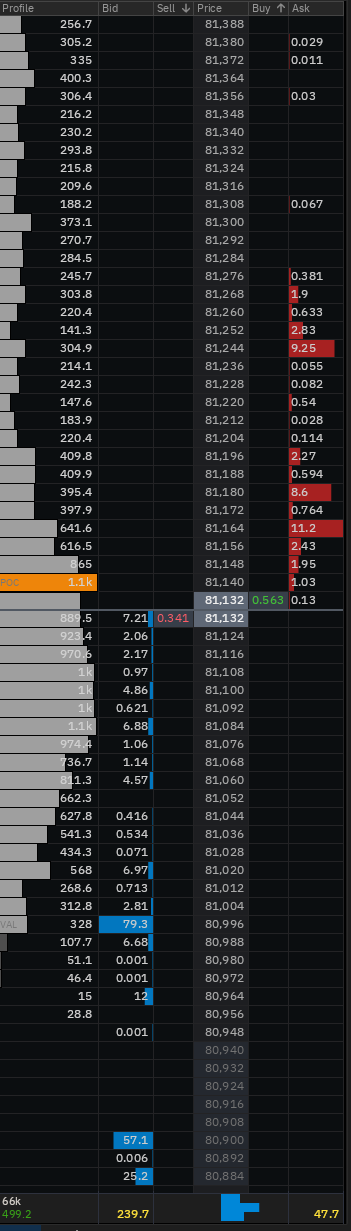
Is there an edge in actively using the DOM? There is, but it is not easy, and it is hardest in crypto and other thin markets.
The best use of the DOM is in liquid markets such as bonds or index futures. Limit orders are advertisements. Anyone can add and pull them at any time. This often creates the illusion of supply and demand that isn’t real.
That is where the edge in the DOM comes from. Skilled DOM readers can tell whether the orders near the price are real or spoofs. It’s very difficult to trade using only DOM, and it is getting progressively harder as markets become thinner and more HFT firms dominate all the flows.
If you are an intraday trader (or any trader), the DOM is also a good execution tool. Placing orders on the ladder is faster and more precise than clicking on a chart. Most platforms let you bind different order types to keys and work orders with a click or two.
Tape reading
The tape shows market orders as they execute. Most platforms let you build a reconstructed tape that only shows prints above a threshold, which is the fastest way to see large executions in any market.
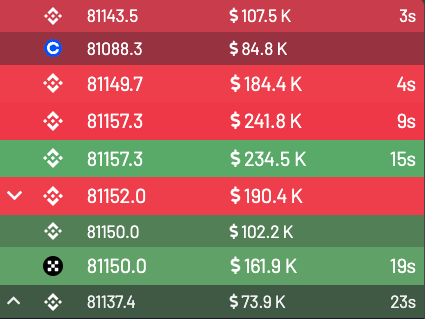
You use the tape to see where traders are interested in buying and selling and, most importantly, how the market responds to that effort. If you see a resistance level where a lot of market buys come in and the price does not follow through, it can be a strong signal of absorption from the limit orders.
Footprint charts
Footprint charts allow you to see historical reconstruction of the tape. It shows the same market orders traded at bid and ask, inside a candlestick chart, so you can go back and look at what already printed.
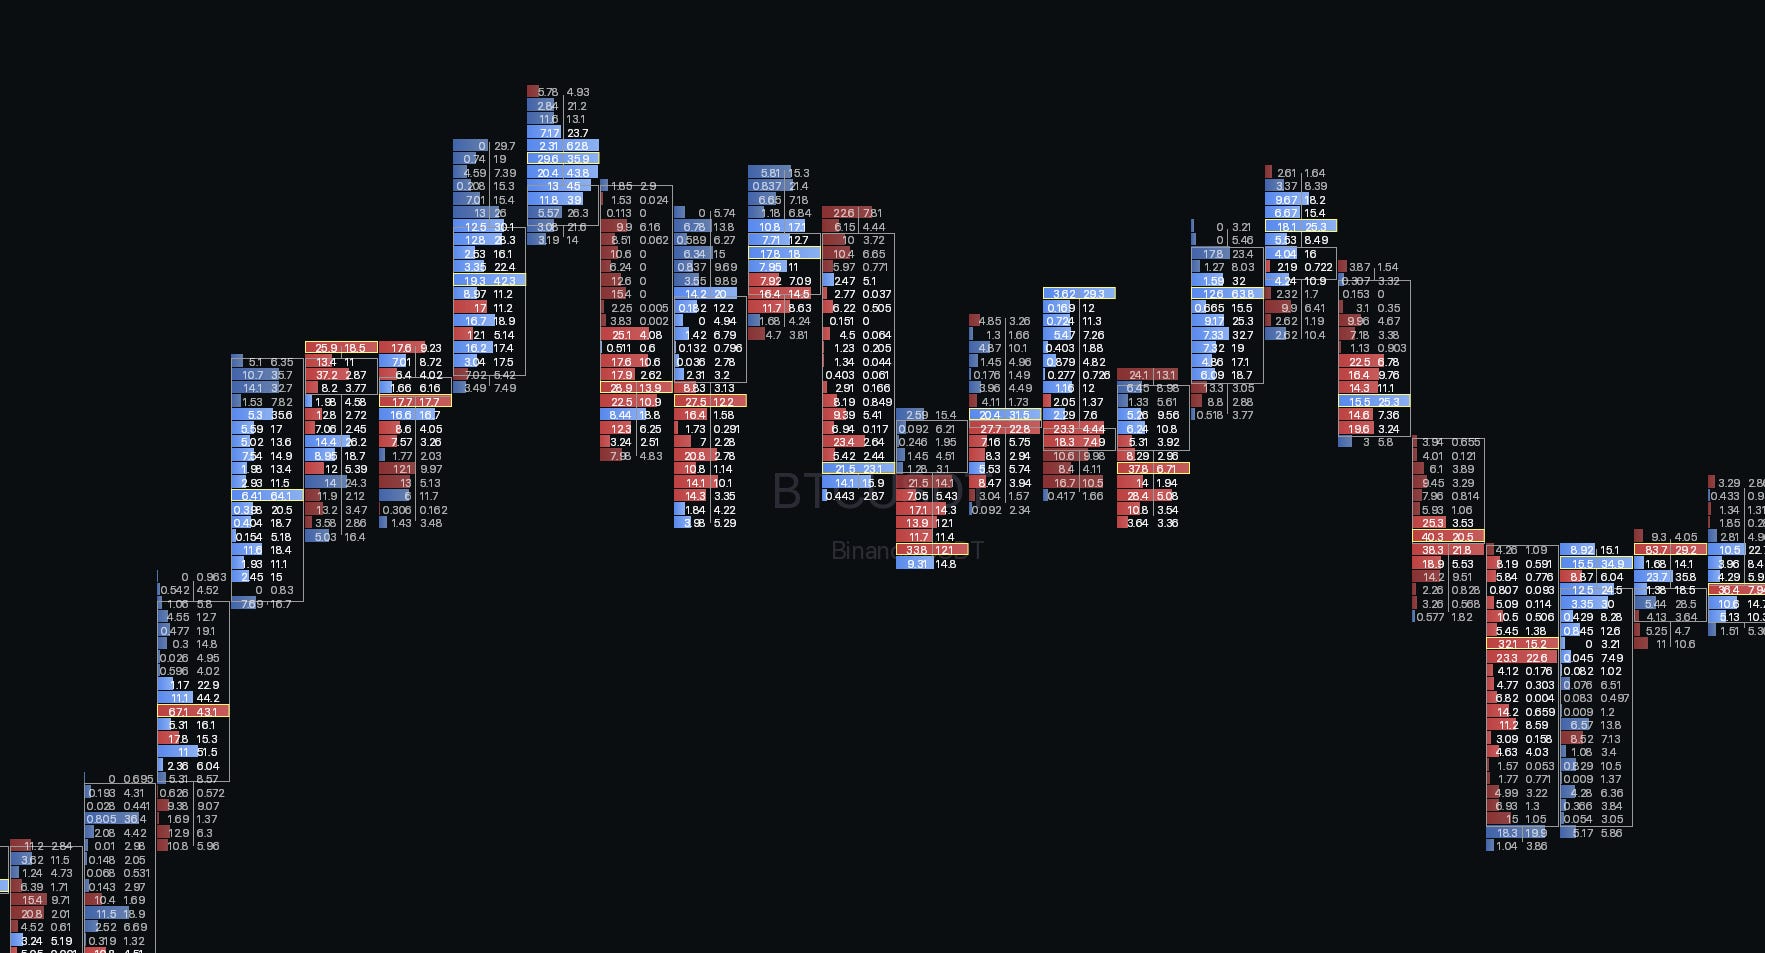
The common bid-ask footprint shows sells on the left and buys on the right. A delta footprint nets the two and shows just the imbalance per price.
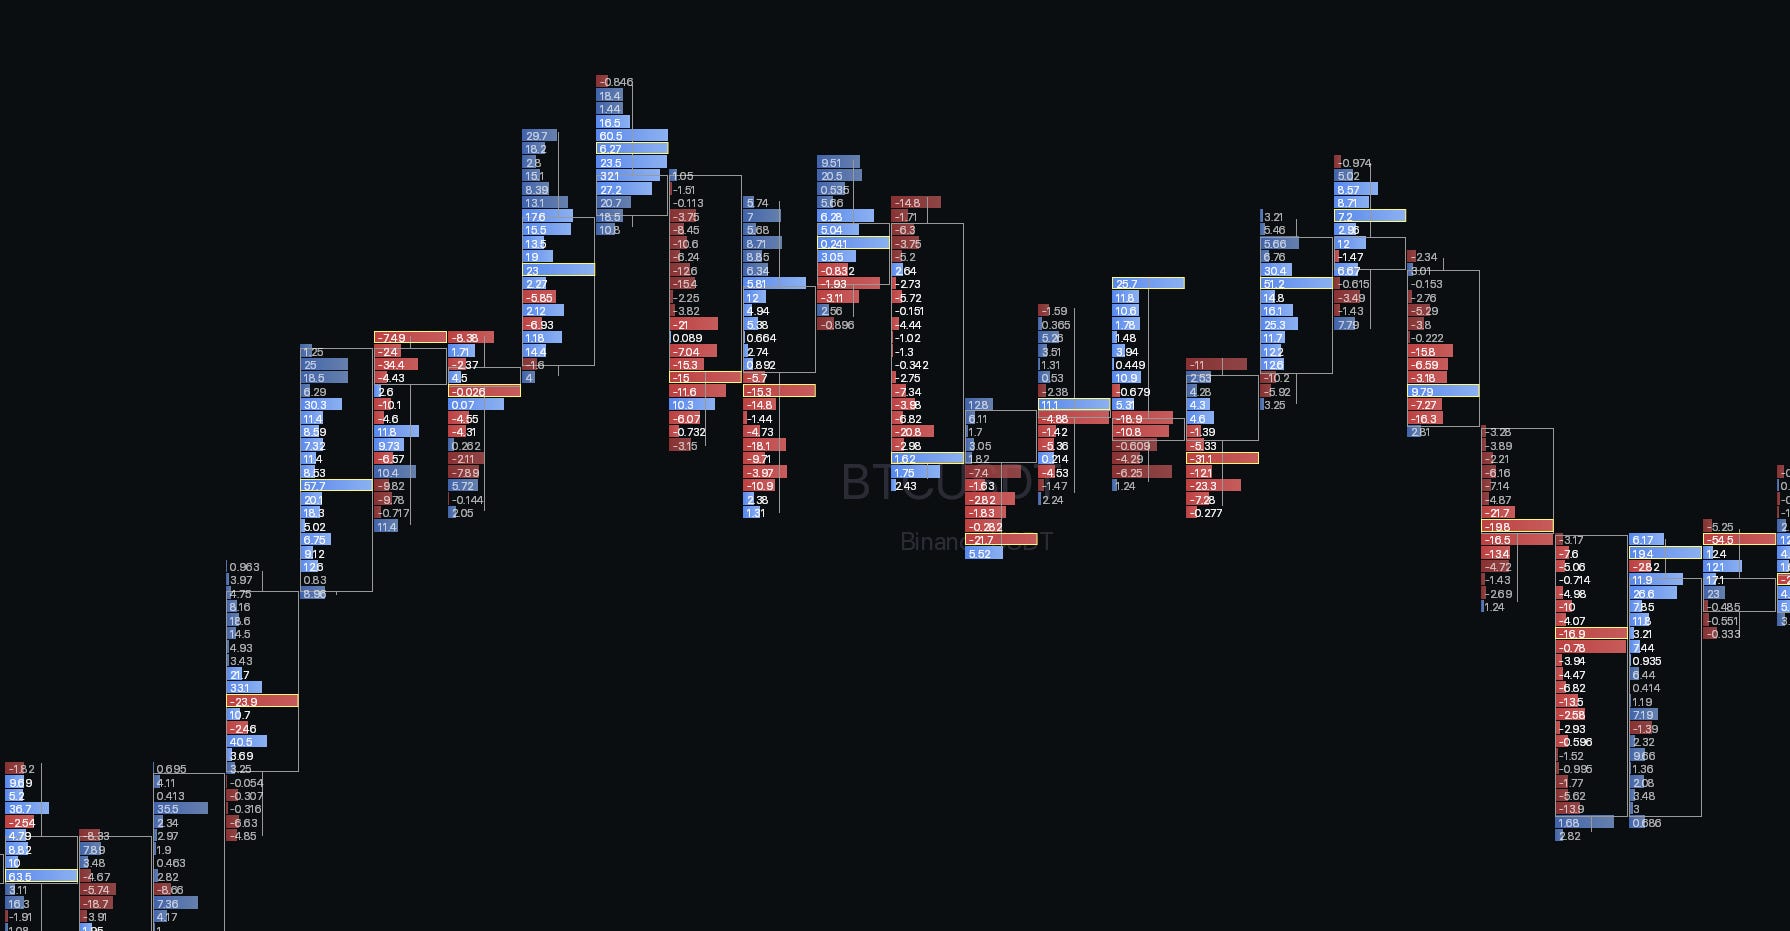
Footprints can be plotted on any timeframe, but they are most useful for immediate action intra-day. On a higher timeframe the balance between buyers and sellers washes out, but in short intraday rotations you can see inefficiencies that offer short-term trades.
Heatmaps
Heatmaps plot resting limit orders onto the price chart over time. While many traders are using large orders as support and resistance areas, coming back to the spoofing example and the overall downsides of showing everyone your incentives, I would say it is more complicated than that.
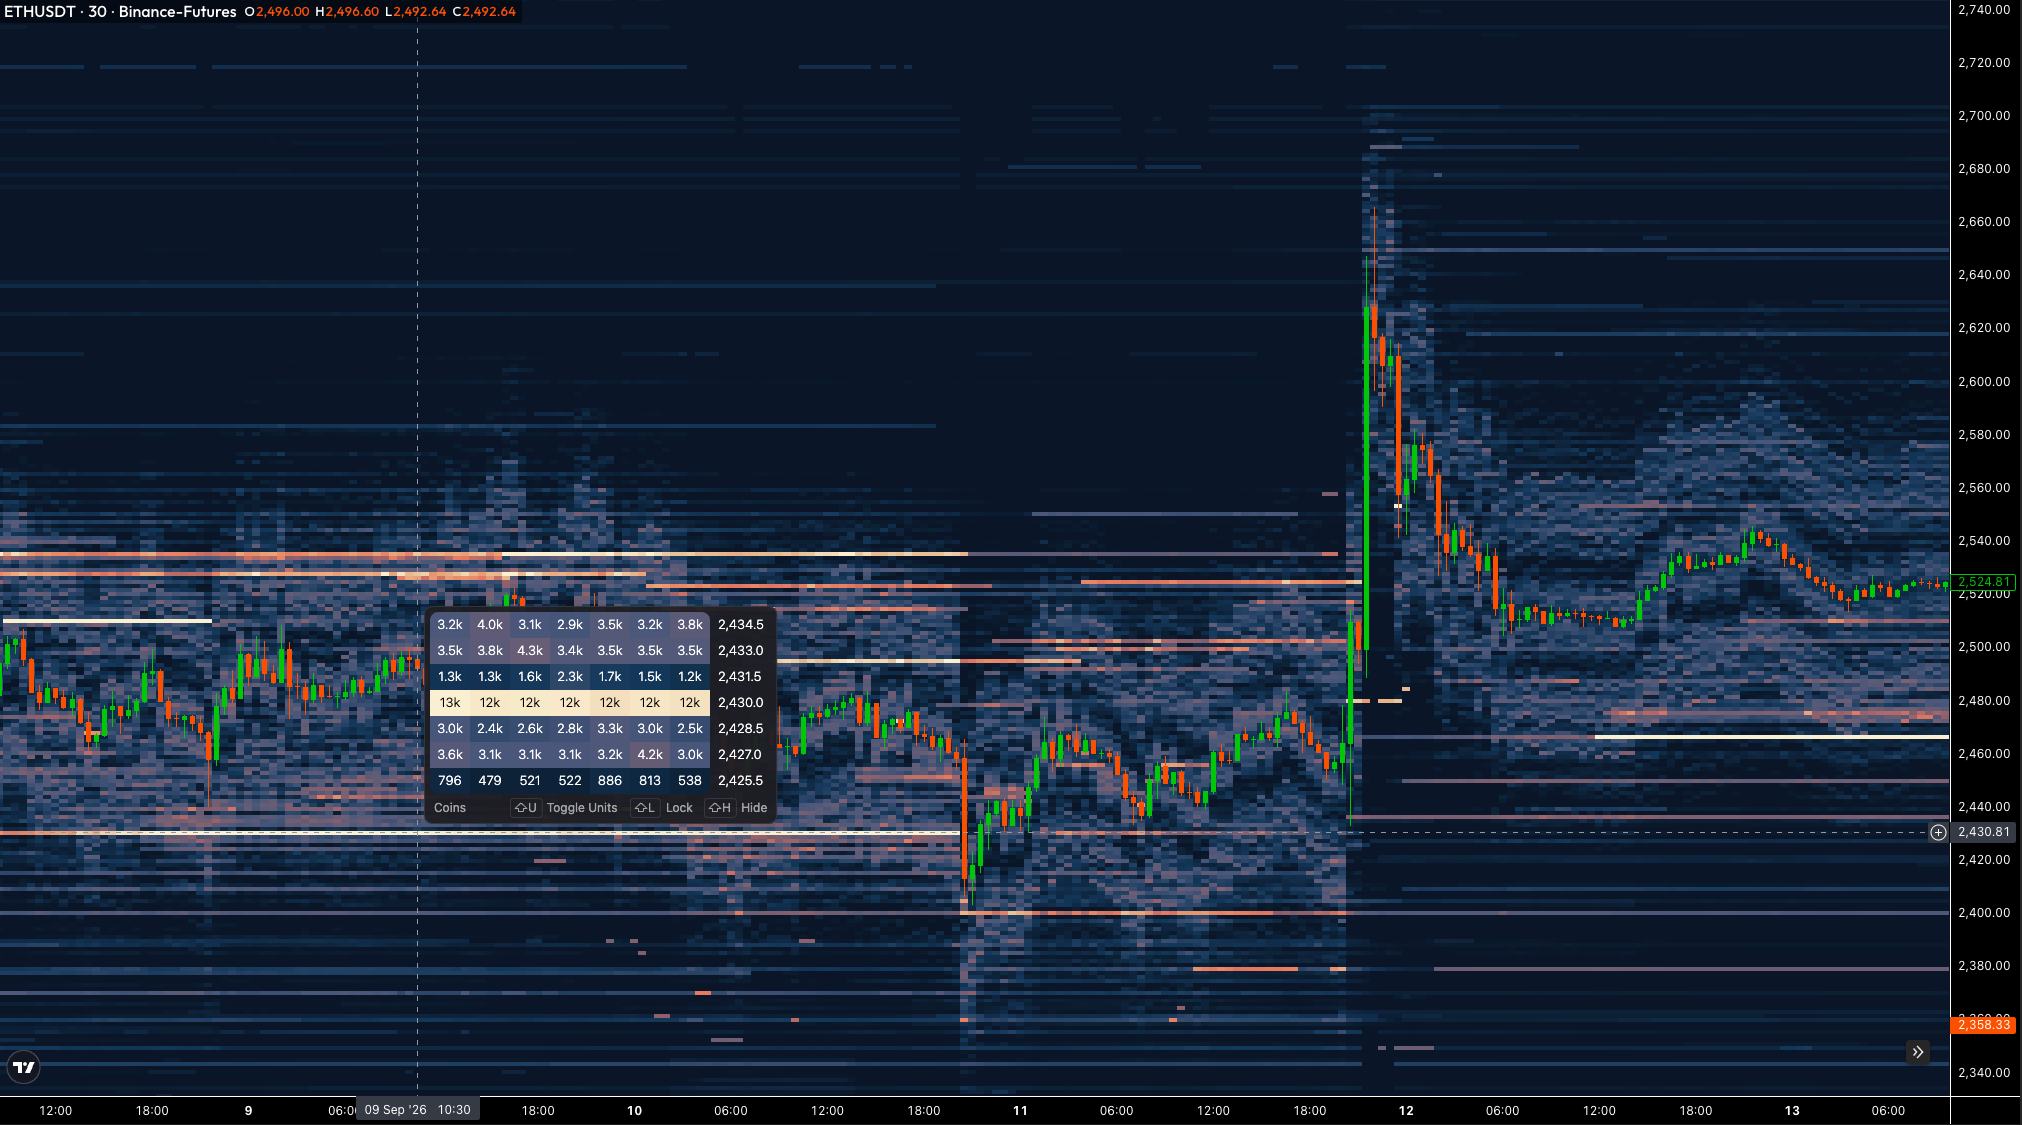
Not every order is a spoof. Genuine buyers and sellers do rest sizes. In the example above, a large order rested and got filled, and the market went higher from there.
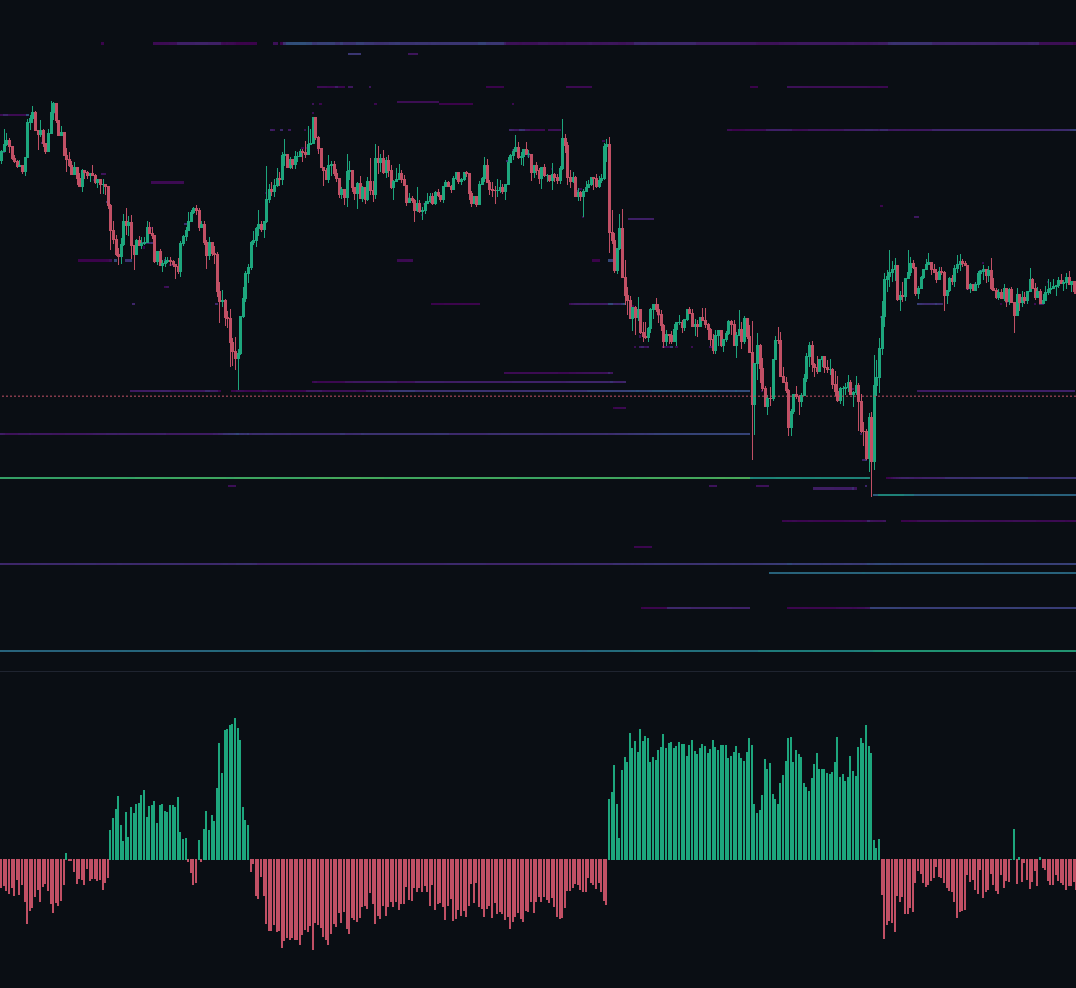
For crypto, looking at the spot order book can be more indicative of genuine supply and demand, and it is also useful to look at the overall delta between bids and asks to get a broader idea. Instead of watching single levels, like on the chart below, which shows delta on BTC spot within 2.5% of the price, you can notice when this gets a really high or low price and tends to find short-term bottoms and tops.
In Conclusion
I think that one of the reasons why so many people lose money in trading is because they start wrong right from the beginning. Similar to any other profession, having a profound understanding of many moving parts and intricacies will make you much better prepared for a range of situations and will make your journey much easier no matter if you decide to day trade futures, swing trade using options, or develop algorithms.