

If you are anything like me, you probably got into trading by trying to find ways to contribute to society as little as possible by googling “making money from home” and other queries. This took me to very questionable websites, to say the least.
While there is nothing wrong with that, the issue with trading space and education evolving around trading is that it is always focusing on specific strategies. It uses this or that indicator, price action concept, or any other thing to miraculously predict future returns.
I am the first to admit that I genuinely used to believe that markets are moving because they touched the horizontal line I draw on the chart. My line is the correct line to be drawn while all other lines suck. Despite never getting too delusional to believe in Elliott Waves, this is a common issue among the trades. They draw levels like they are in art school or watching countless indicators to give them a magical signal to buy and sell.
Let’s think about this. I will offer you a coin flip. If you win, you will get $110; if you lose, you will lose $100.
Would you take it? Considering most people reading this article know about expected value, I suspect the answer is yes, as it should be since this game has an expected value of $5 (0.5 × 110) - (0.5 × 100), but there are many people who would pass on this.
Losing $100 hurts psychologically more than winning $110, as loss aversion research has studied. If we were to play this game only once, the return is completely random, but playing the same game a thousand times, the odds are highly in your favor.
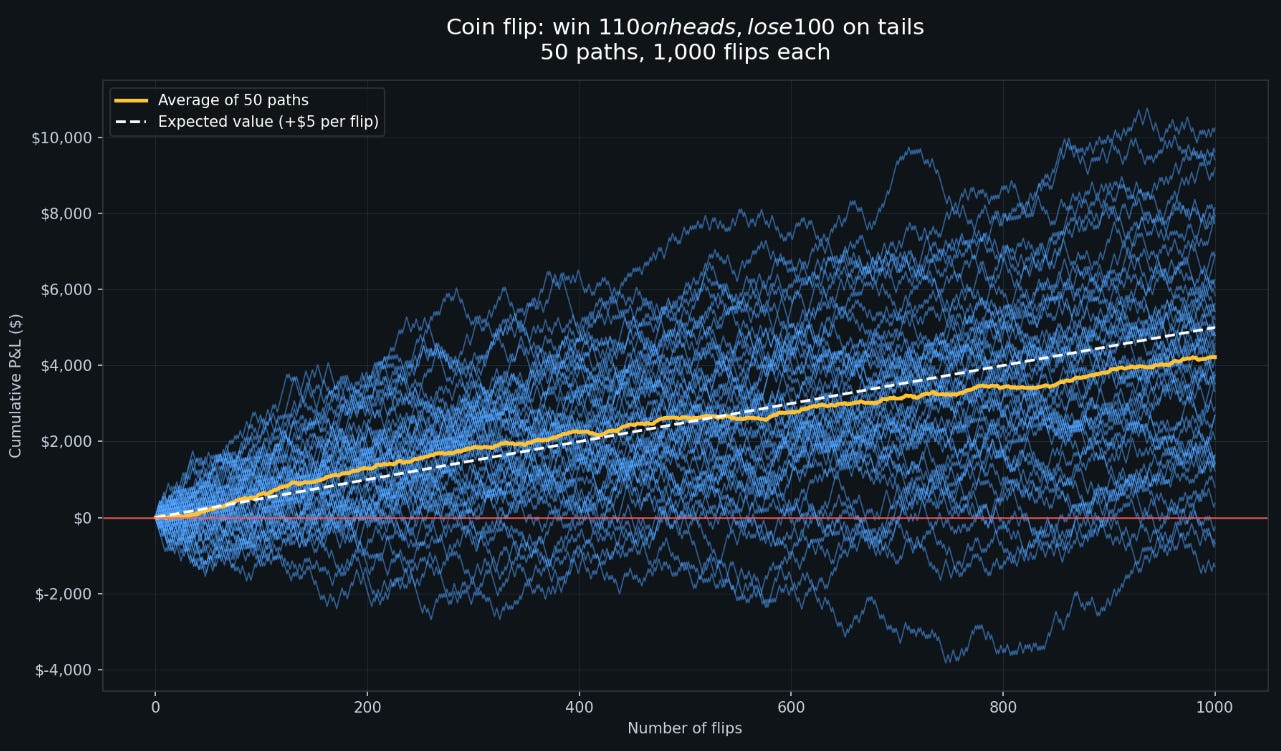
The goal of this article is to show you how you can play similar games in the financial markets; they are not fancy, you won’t make riches overnight, or you will not be anything smart or sophisticated. You will be making money because you will be willing to take risks others don’t, similar to the coin flip game where, while the vast majority of the paths ended in profits, some barely broke even.
Not only that, at the end of the article I will break down my own core portfolio that is harvesting different risk premiums and has been consistently beating the S&P500 since 2016.
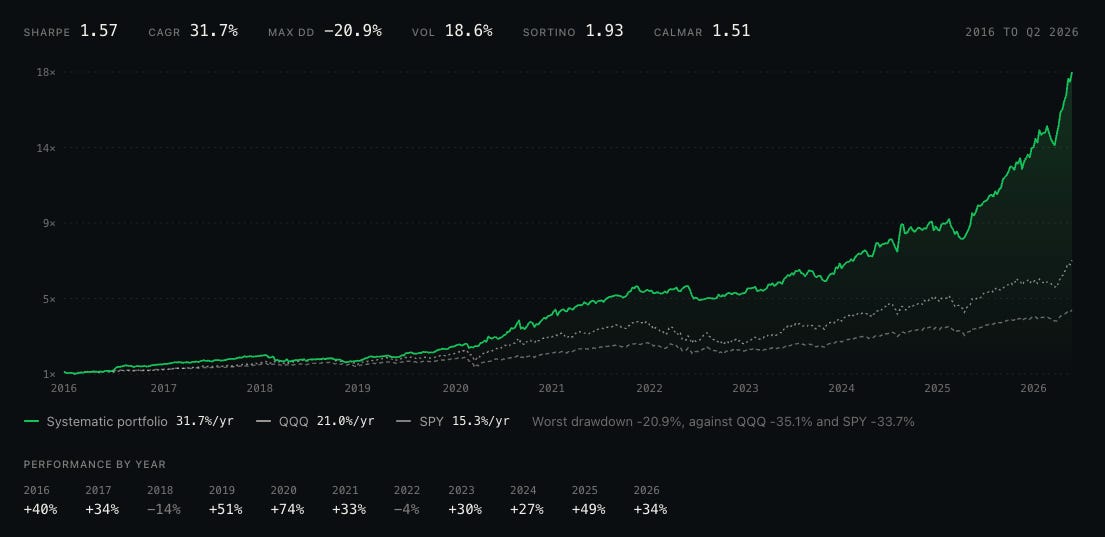
This portfolio is part of Tradingriot.com, which provides deep historical data for equities, futures, or cryptocurrencies distilled into actionable signals and this exact portfolio to copy trade.
Efficient Market Hypothesis
If there is one definition of someone who “must be fun at parties,” it will be Eugene Fama, who is closely associated with the Efficient Market Hypothesis (EMH).
EMH says that prices already reflect all available information as thousands of smart people compete to find any mispriced assets, so any obvious edge gets traded away immediatelly.
So you should basically just give up since you can’t beat the market with publicly known information.
While this might sound like you should just give up, it’s not the correct takeaway. EMH says you can’t earn extra return without taking extra risk, not that returns are zero.
There is this weird belief that “equities should return 7-10% per year,” like there is some kind of law of physics that magically moves them higher year over year, or as if the market owes you these returns for showing up.
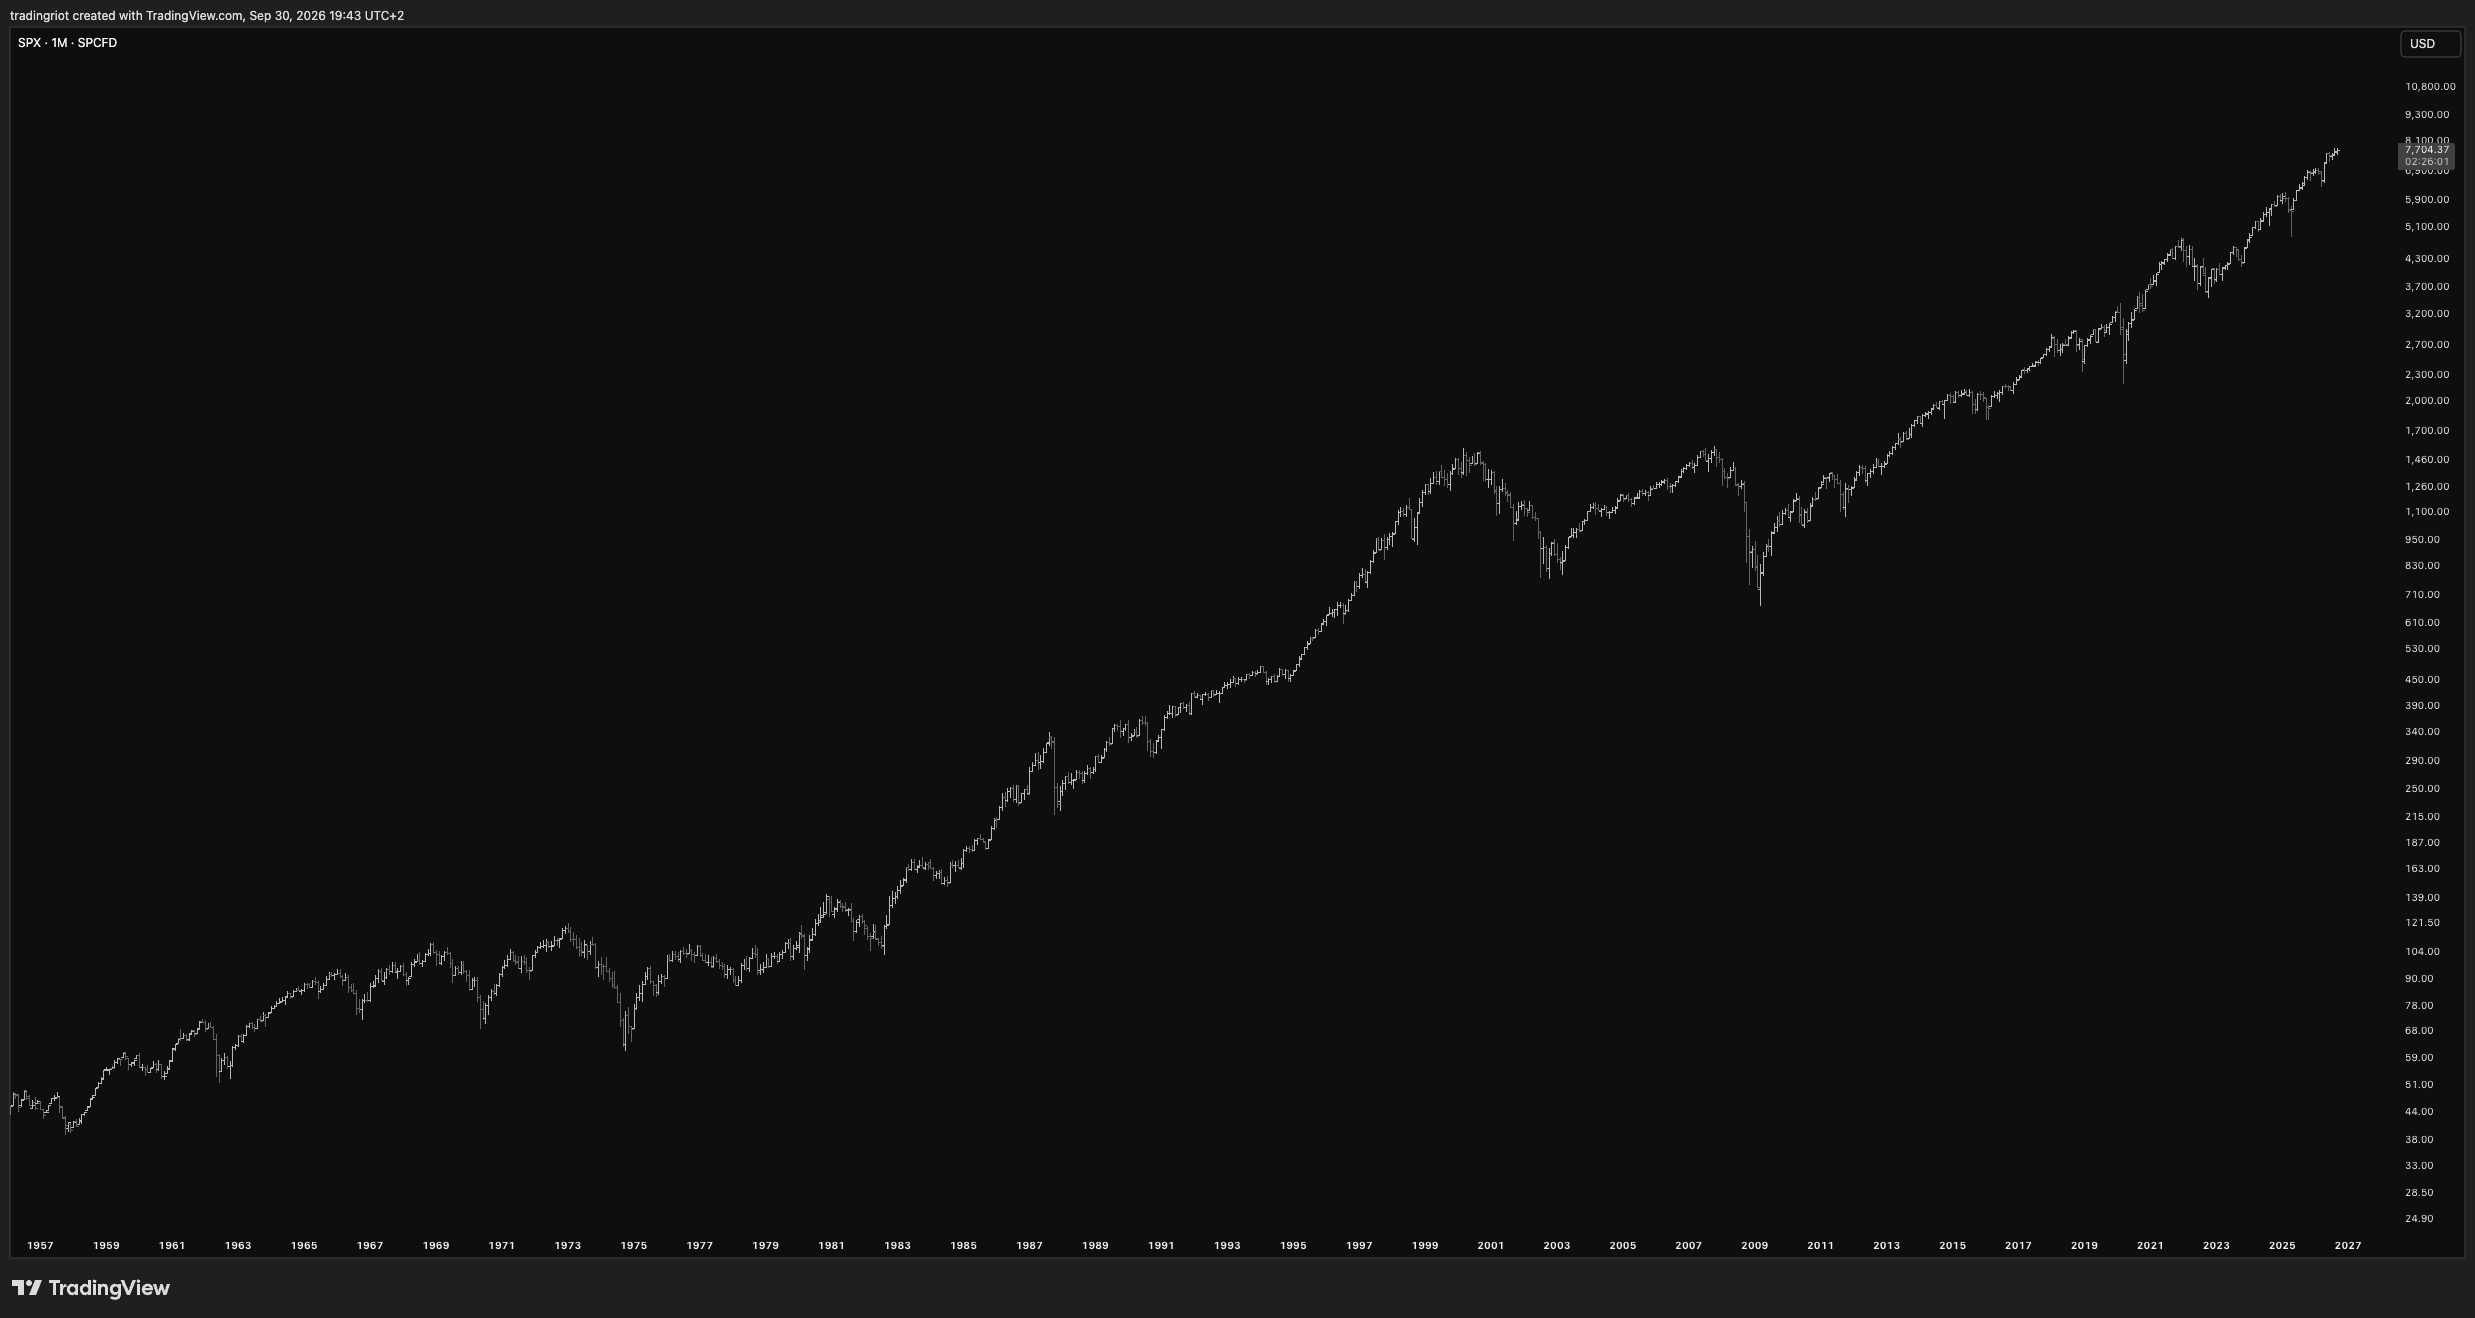
This is understandable if you look at the S&P 500 performance over the last fifty years, but it doesn’t work this way.
The historical positive drift in equities is compensation for taking the risk not everyone wants to take. If you buy equities and hold them, you're signing up for a ride. Your portfolio can get cut in half during a crisis. It can go sideways for an entire decade, like it did from 2000 to 2010. Individual companies go bankrupt. Recessions and wars happen. The whole thing feels terrible every so often.
If holding stocks felt safe, they'd return the same as treasury bills. Why would anyone accept equity risk for the same return as risk-free government bonds? They wouldn't. So equity investors demand extra compensation for the uncertainty, and historically that's been around 4-6% per year above risk-free rates.
Interestingly enough, the equity risk premium sticks around even though everyone knows about it. It's been documented across over a century of data, in dozens of different countries, through world wars and depressions and technological revolutions. The premium persists because the underlying risk persists. Someone has to hold the stocks. And whoever holds them wants to be paid for the discomfort.
Alpha
Every time I open X or watch trading YouTube content, I see the word “alpha” thrown around all the time.
This usually comes together with some kind of technical analysis setup or strategy, which makes me die inside a little every time I see it.
In trading, alpha is excess return from skill or information advantage. It decays once discovered because others can replicate it. Examples of that would be strategies evolving around speed, such as high-frequency trading or market making, where infrastructure matters, or getting access to alternative data that gives you an advantage, but it disappears once more traders find out about them.
For most retail traders, alpha is not really achievable, but inefficiencies can be.
Inefficiency is a mispricing that should not exist; the same as alpha, it is highly competitive but more achievable for you and I.
The examples of inefficiencies are the index inclusion effects where stocks are added to the S&P 500 and used to jump on the announcement because index funds must buy them. Something that has now shrunk sharply since it is getting front-run, similar to statistical arbitrage, exchange-pricing gaps, or post-earnings announcement drifts (market slowly digesting earning jumps might as well be risk premium) and so on.
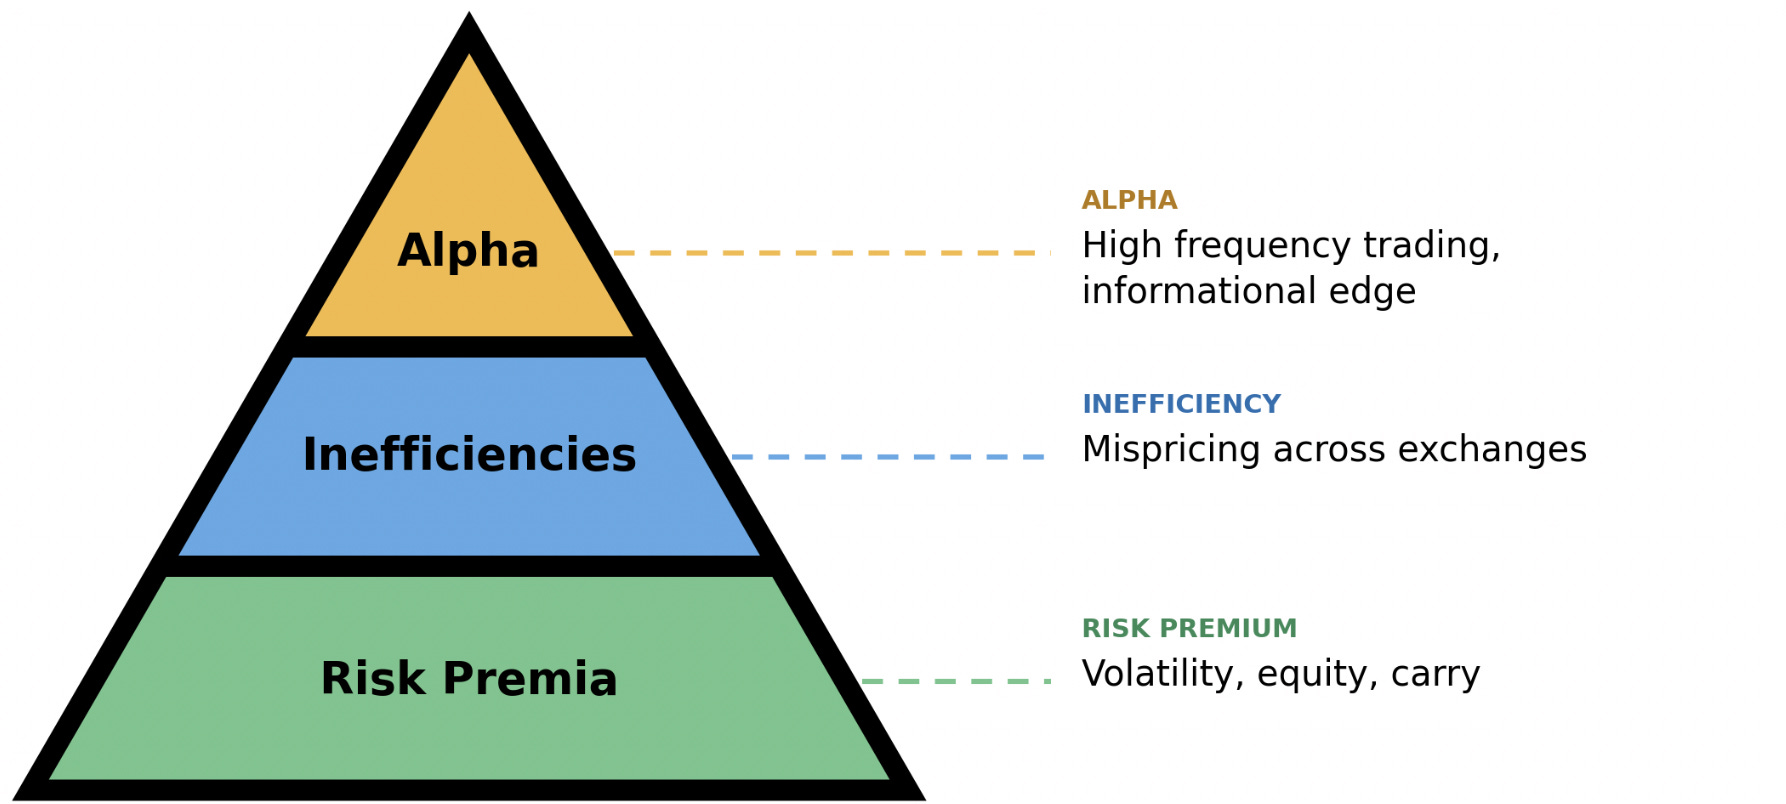
These do exist and happen repeatedly, but their returns are also shrinking as more traders find out about them.
A risk premium is not like this; it is what you earn for bearing a risk that can’t be diversified away. Insurance companies are not a secret. Everyone knows they exist, and everyone knows they profit. They keep profiting because the demand for getting rid of risk never goes away.
Skew
If you are buying insurance year after year, there is a high likelihood nothing is going to happen. Your car won’t break, your house is not going to burn down, you won’t need surgery, and so on.
For an insurance company, this means they will collect a small payoff but every once in a while are obligated to take a considerable loss when someone’s house burns down.
This is very similar to several risk premium strategies; they have what we call a “negative skew.
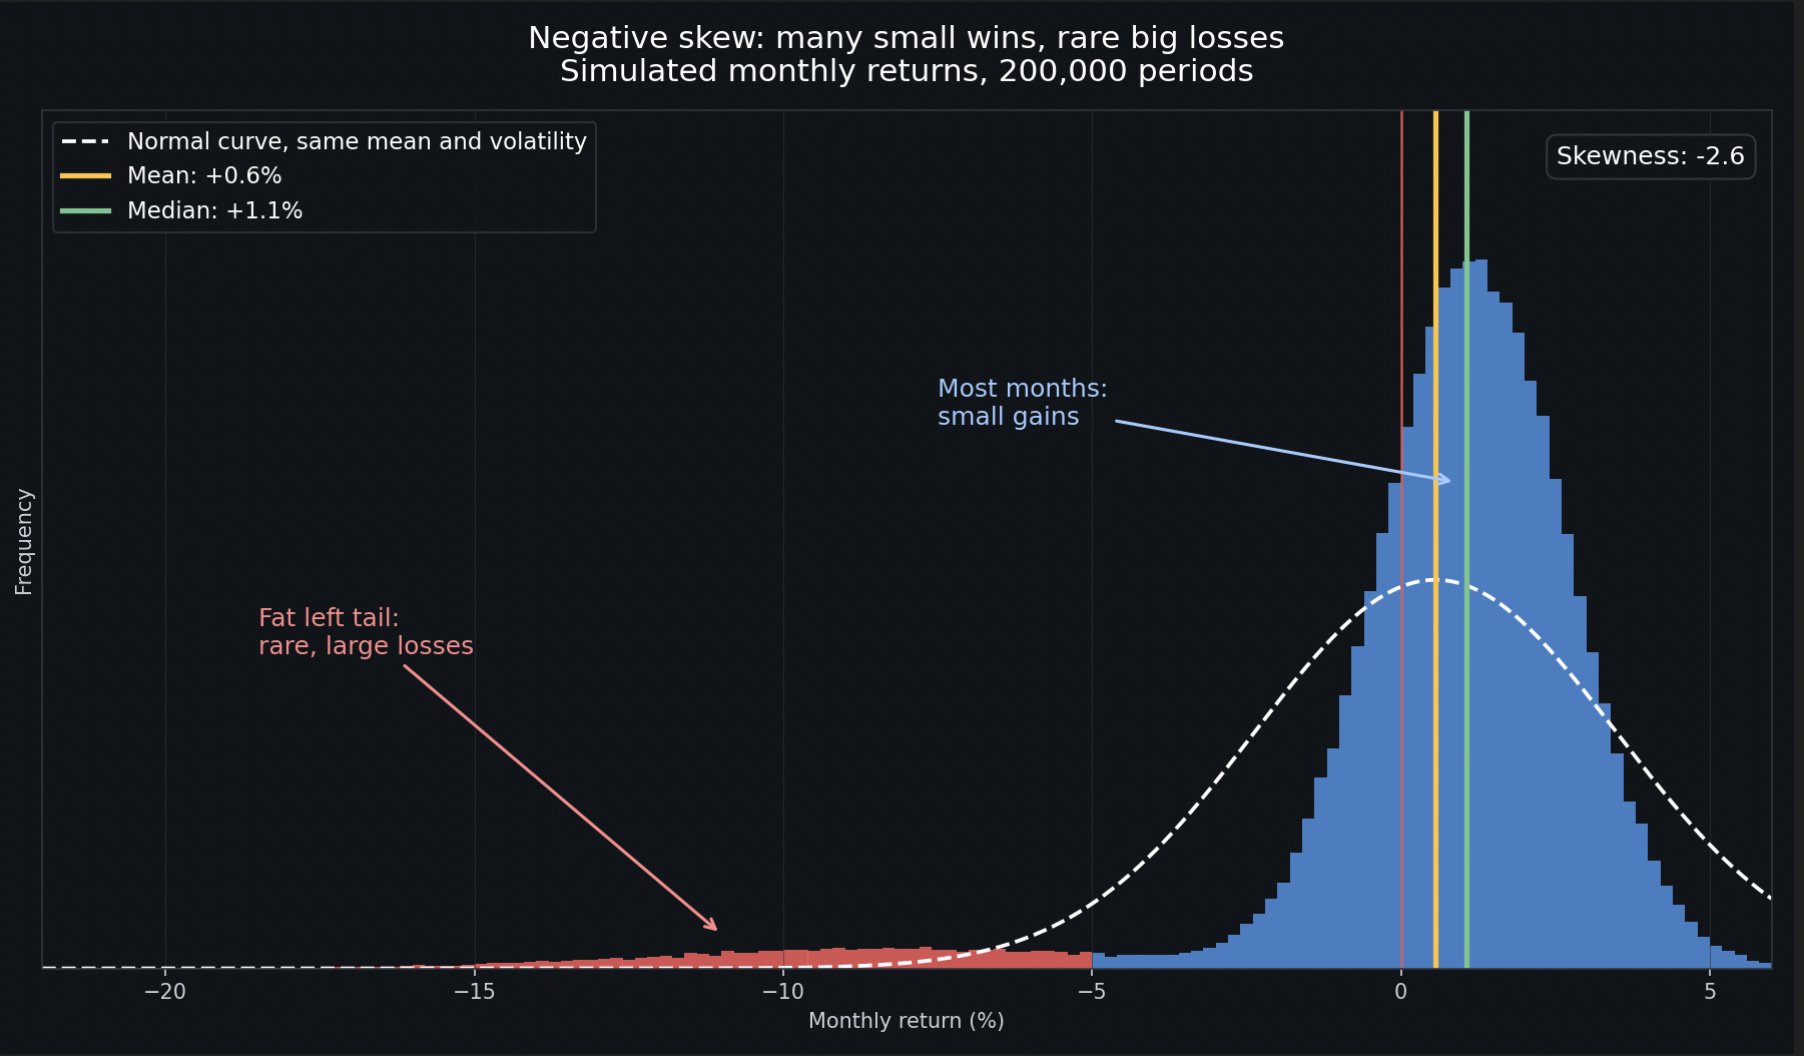
It is not pleasant, and every time there is a crash, spike in volatility, or any other market stress, you are very likely going to hear how you are picking up pennies in front of a steamroller. This is fair but, if done correctly, can still be profitable despite losing a few fingers to the steamroller every once in a while.
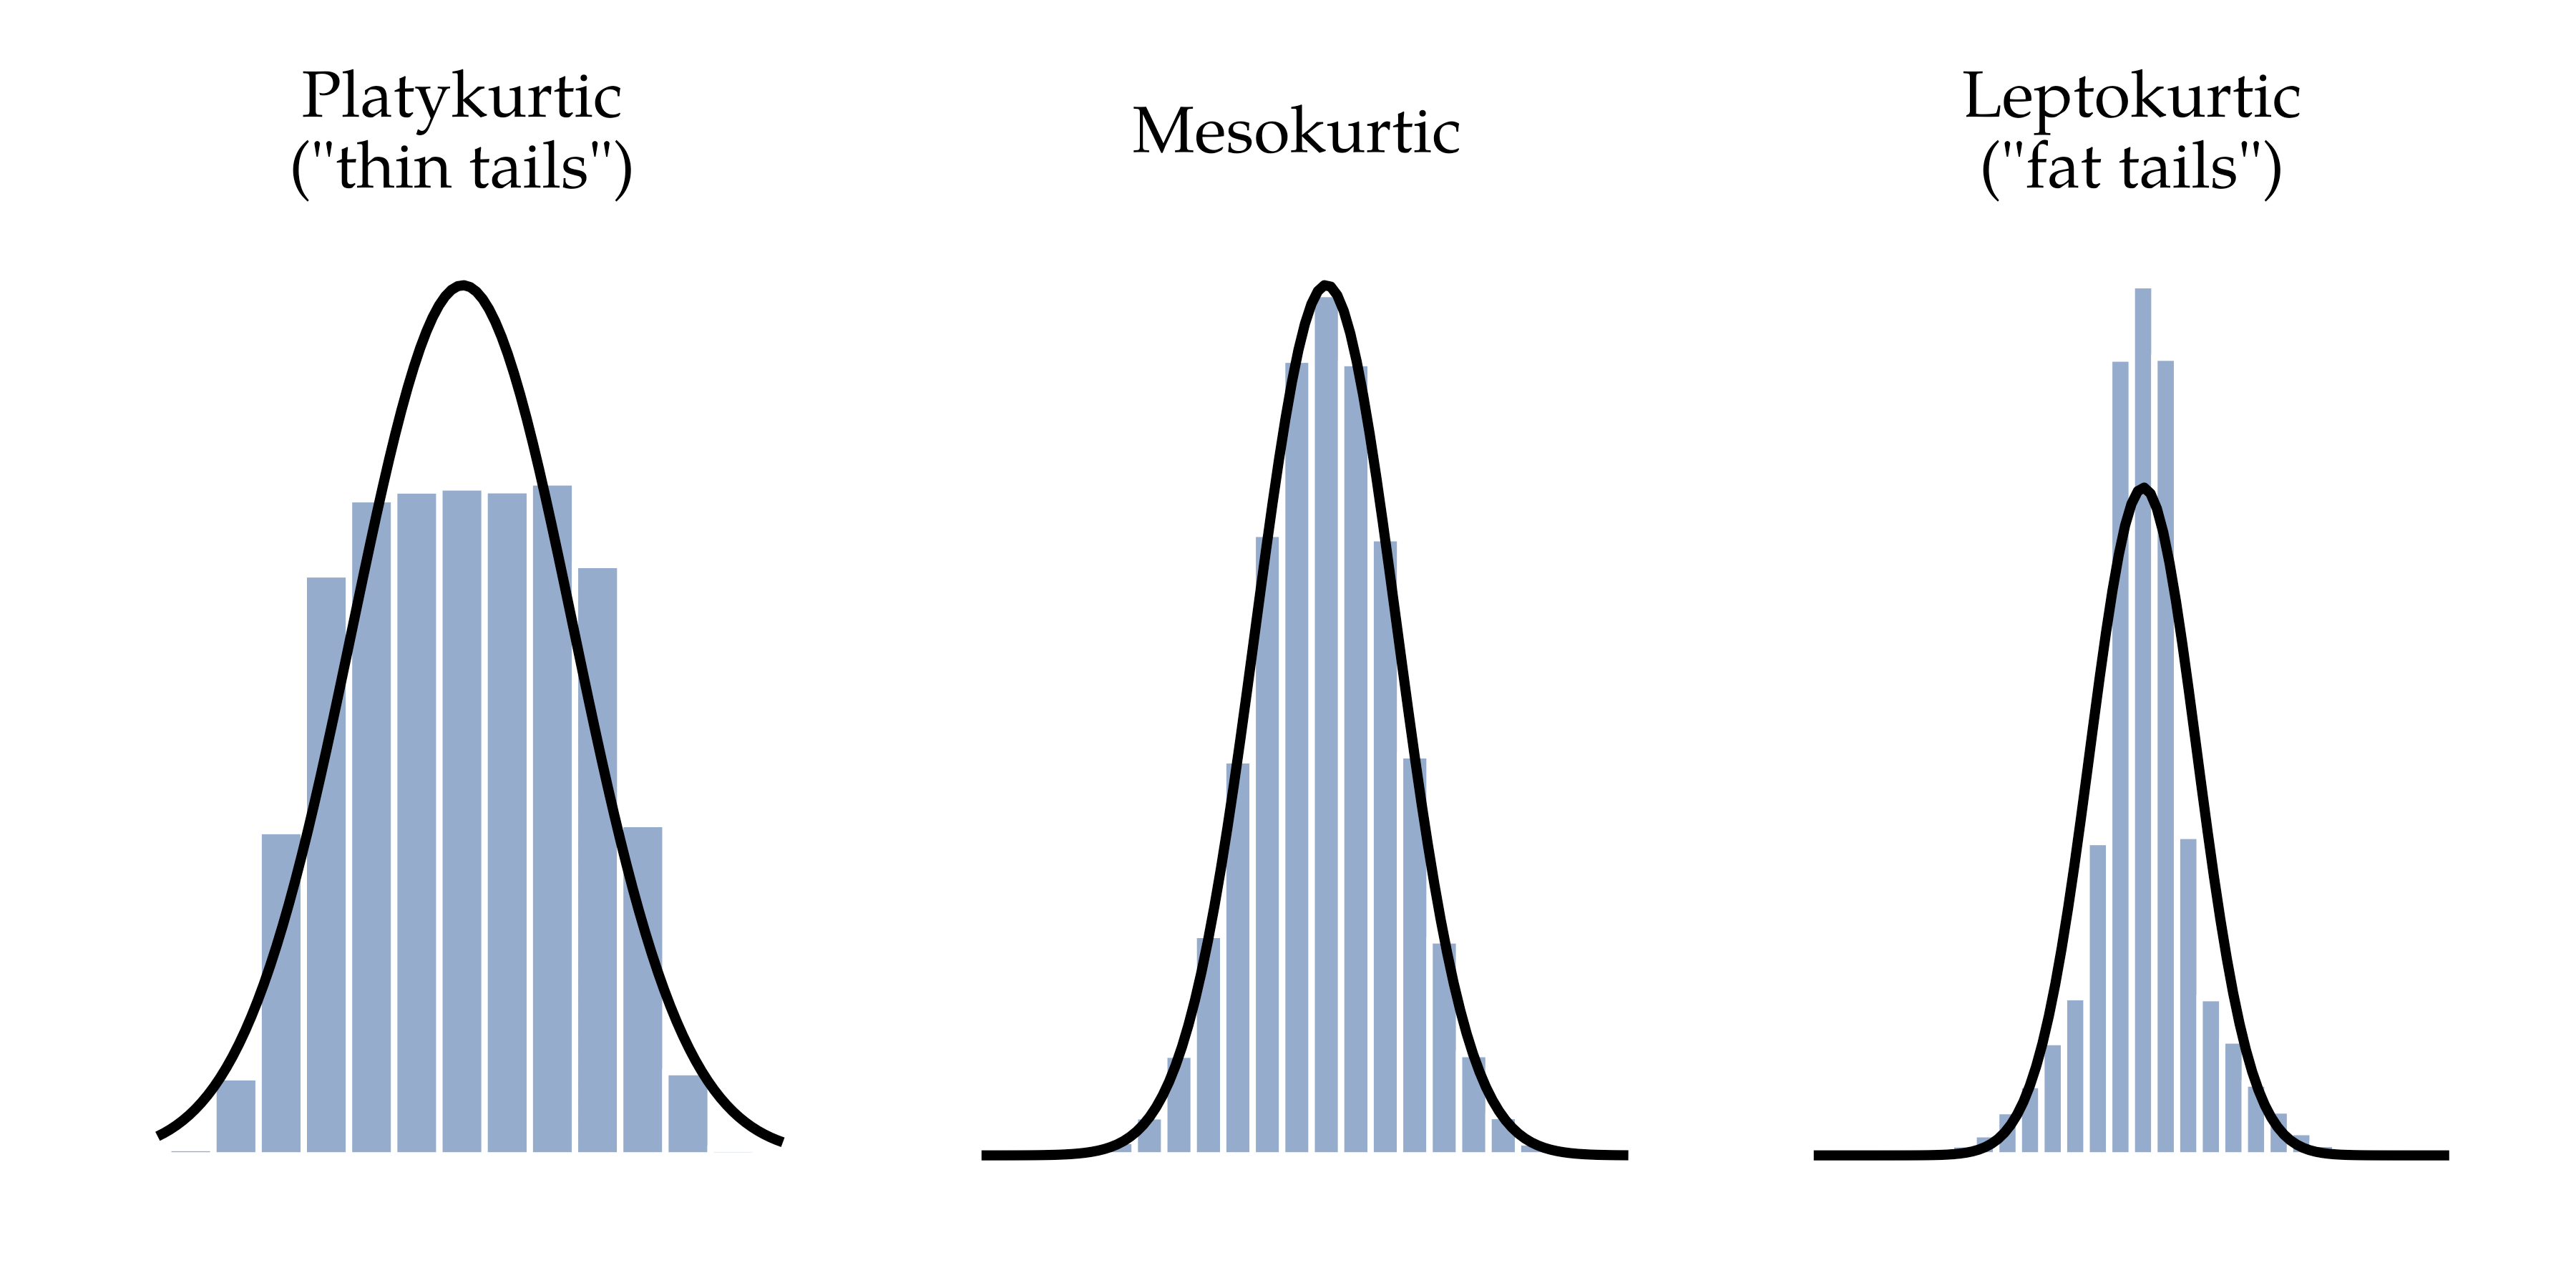
Besides trend following, negative skew shows up in most risk premium strategies. So you need to be ready for long drawdowns and size carefully. Markets also have fat tails, which means extreme moves happen far more often than a bell curve says, which is is called high kurtosis.
Momentum
The “trend is your friend” saying is one of the biggest clichés you can hear in trading, but not many people actually ask why that is.
Momentum describes the fact that prices might as well move in the direction they were already moving, and you usually hear about two different types of momentum.
The cross-sectional momentum ranks many assets against each other, stocks in the same sectors, correlated commodities, altcoins from similar categories, and so on. You buy the winners and either avoid or short the lossers.
Time-series momentum, or trend-following, looks at the performance of an individual market against its own past, typically using trending indicators such as moving averages or channel breakouts to go long or short.
I will give you a full breakdown on how I, personally, run these at the end of the article in the systematic portfolio section; for now what is important to know is that these are again forms of risk premium, although exact reasoning can be up to speculation.
Cross-asset momentum is slightly clearer; by buying individual assets, you are accepting the possibility of the crash risk which is much larger than in index funds or other less volatile assets. Because you are not the only genius who figured out to buy stocks, a lot of the movement can be explained by behavioral factors such as investors underreacting to news. Money chasing recent winners and forced flows from funds are adding to it.
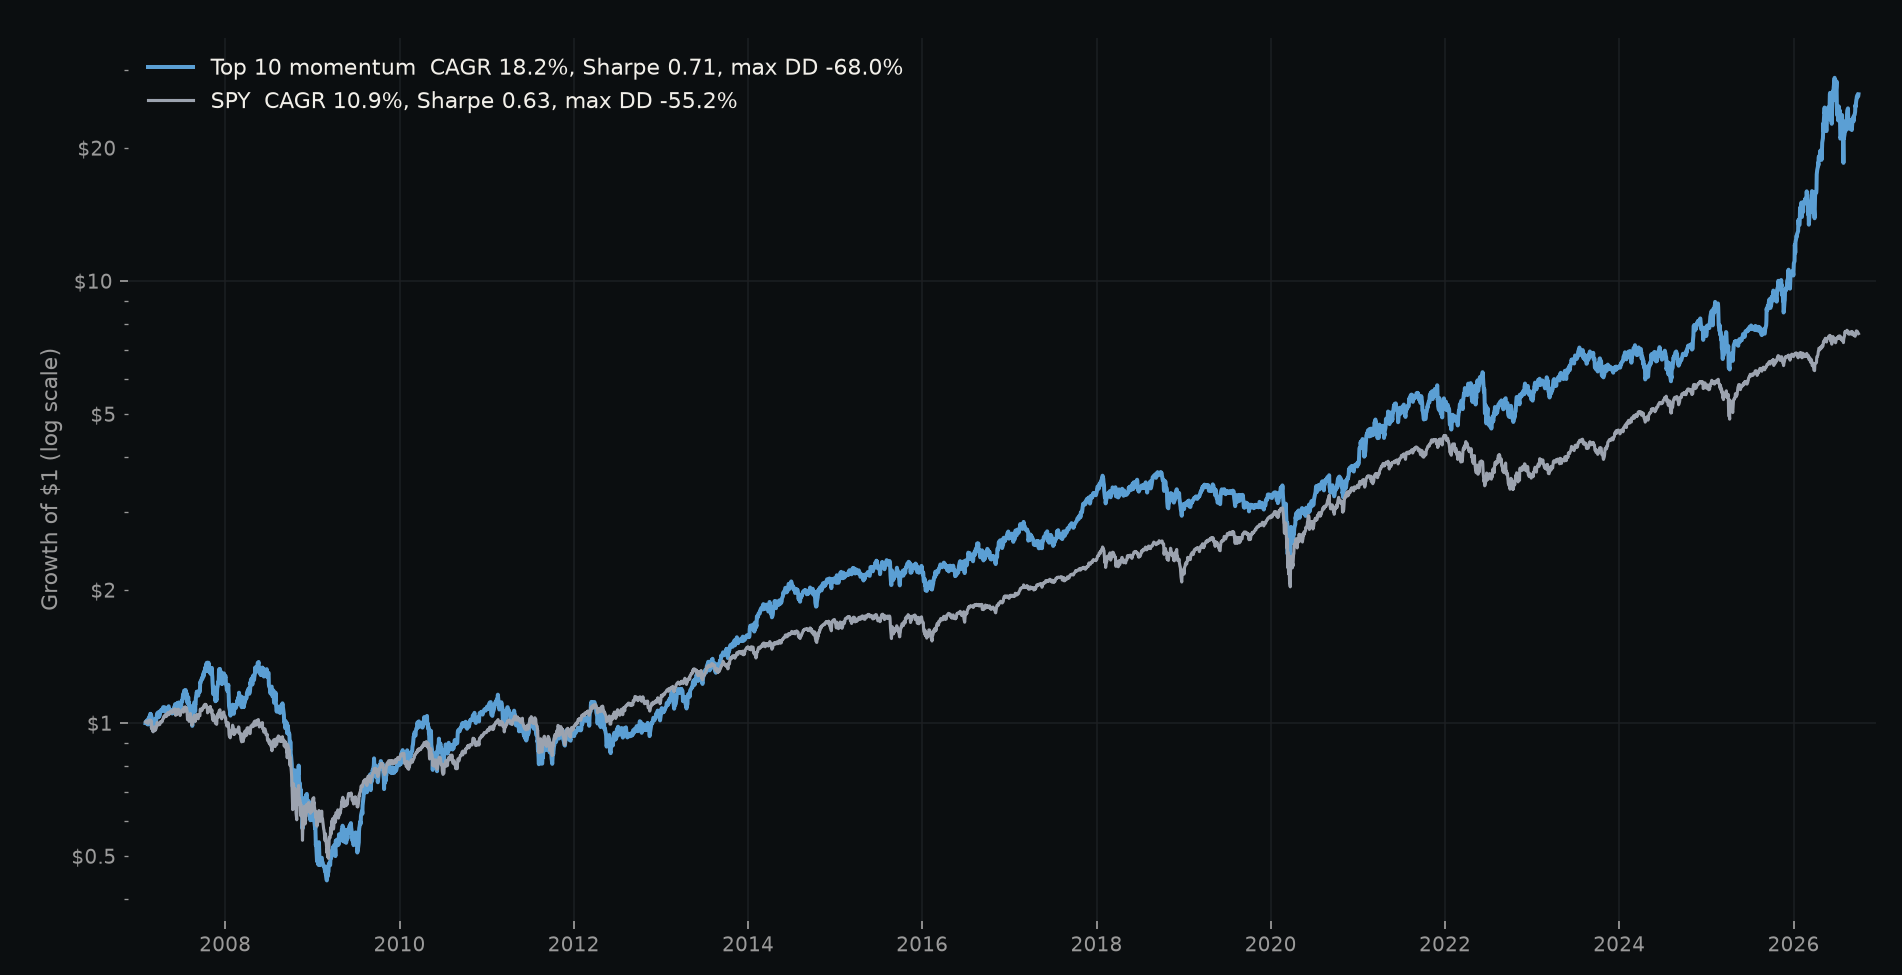
An example of this can be as simple as instead of buying SPY, you will be buying the top 10 performers from SPY with monthly rebalancing.
For time-series momentum, the explanation of the risk premium also comes from behavioral biases, but there are also some other factors.
Using futures as an example, where going long and short is much simpler compared to equities, there are many participants who are not actually trying to make money. Central banks smooth rates and currencies, which slows the speed at which information reaches prices and creates trends. Hedgers are removing the directional risk using futures against physical commodities and so on.
When a commercial hedger sells futures to offset the directional risk, trend-followers such as CTAs (commodity trading advisors, also called managed futures funds) offset that risk from them.
While this might sound as easy as “long when CTAs are long,” it unfortunately doesn’t work like that.
Classic trend-following in futures used to do very well in the last few decades but deteriorated heavily once it got too crowded and more capital started chasing the same signals. You can see this on the chart below, which is using some basic CTA-style trend-following rules.
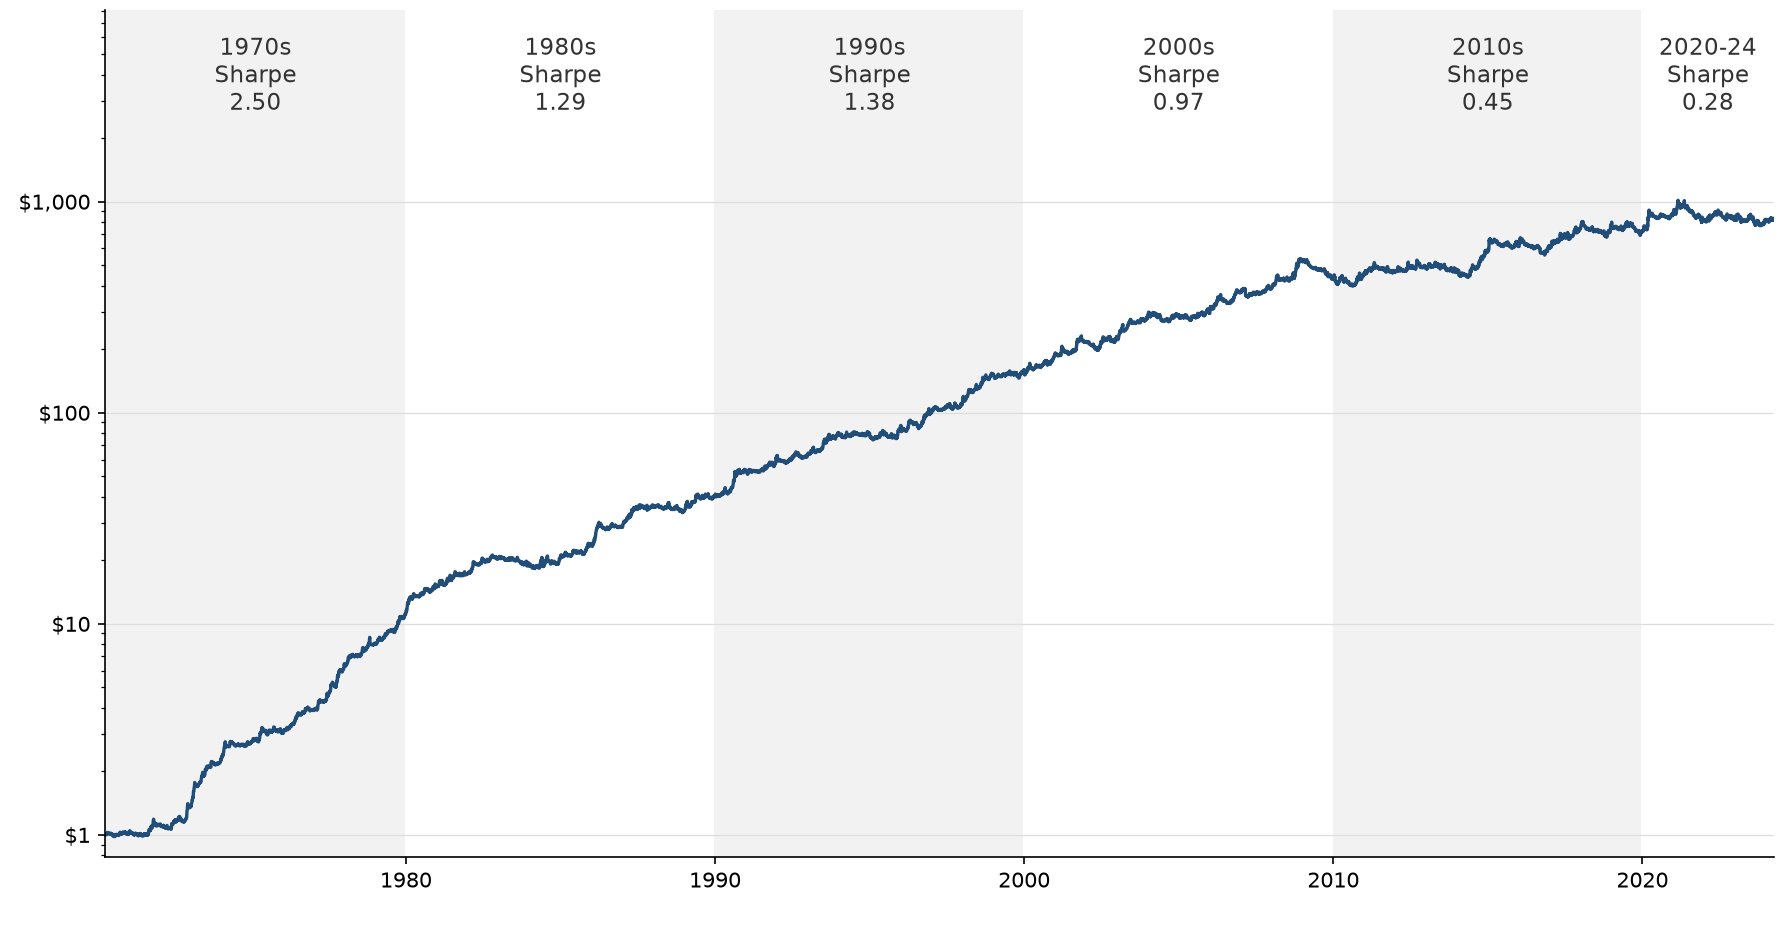
So is trend-following dead? No, it isn’t; it just got harder and more competitive over the years, so we have to be more creative and look into less competitive spaces, such as crypto, for example.
When it comes to trend following, the case for this being a pure risk premium is thinner, especially since trend following has the opposite skew profile. For trend-following strategies, the vast majority of your trades are going to end up being small losers, and the vast majority of your returns will chop sideways until you end up riding a massive trend.
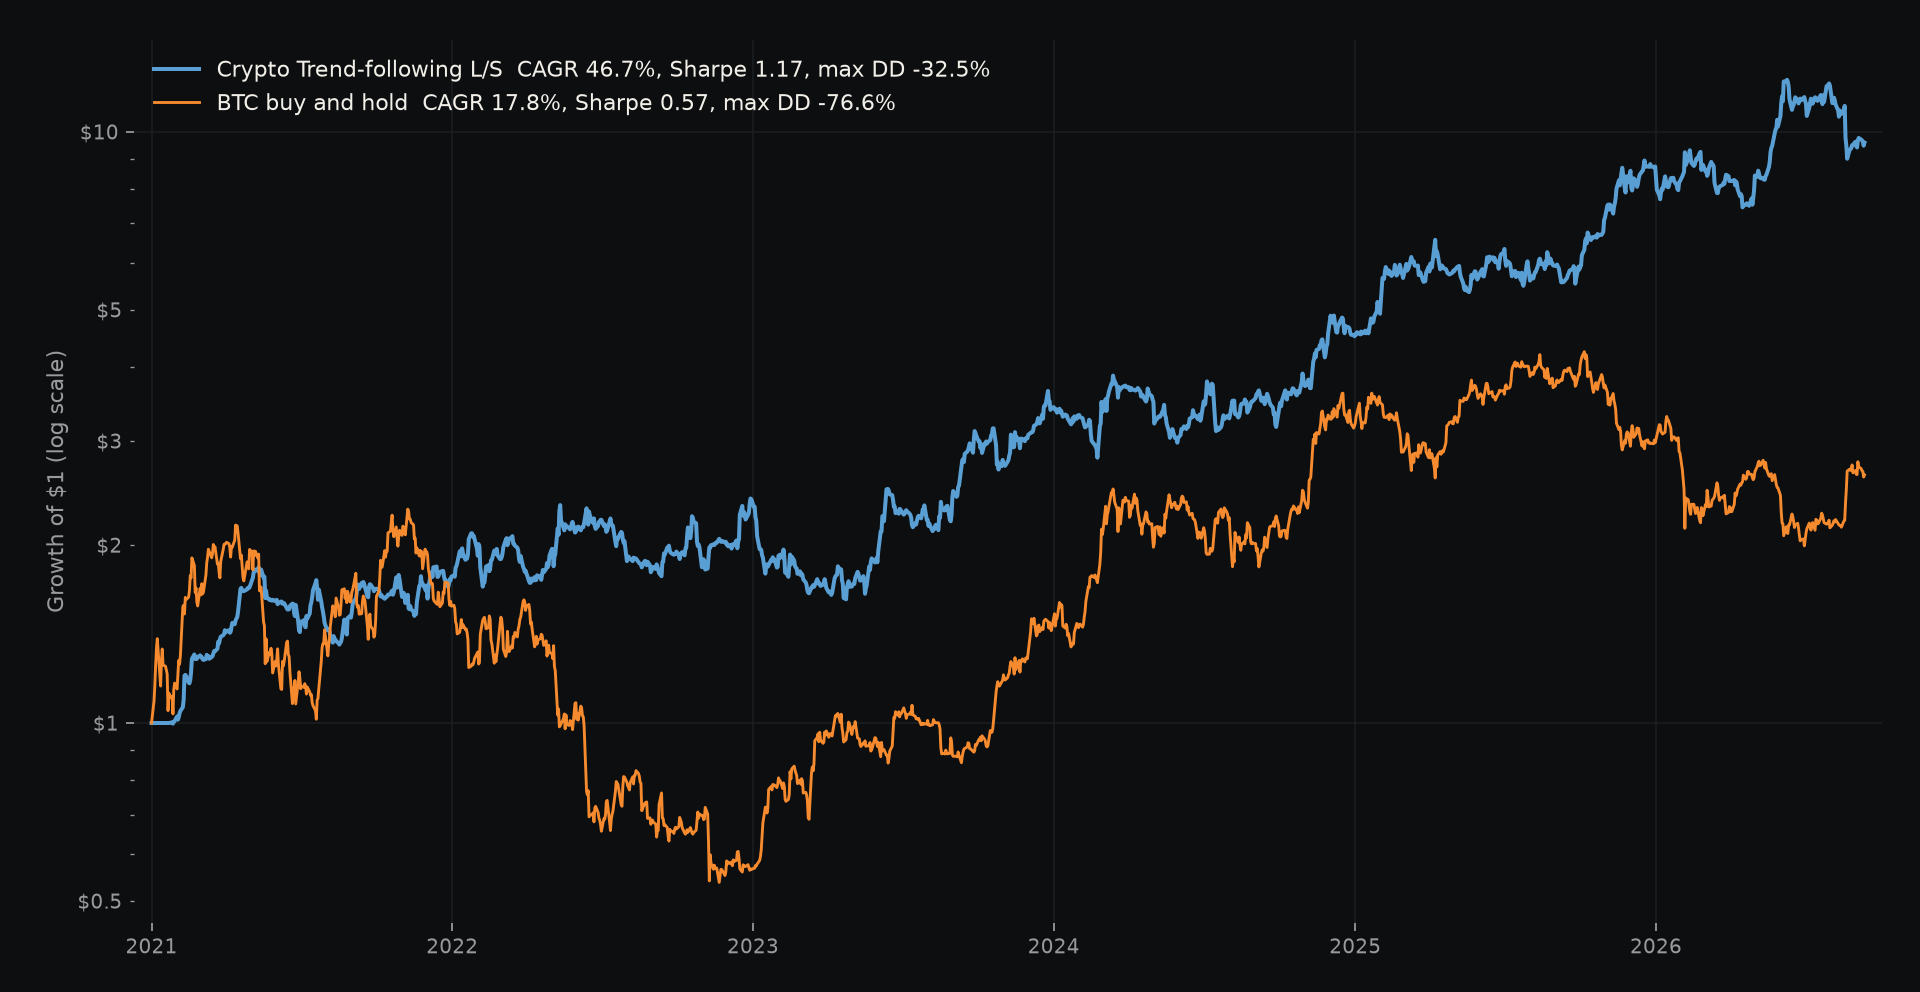
As visible on the chart above, this is a fairly simple system in crypto trading for the most liquid coins. Over the years it did quite well with sharpe ratio similar to prior century of futures trading, but you can also eyeball on the equity chart how much of a sideways chop will you have to endure. Usually several months or more of just nothing before the next big trend move arrives.
A strict risk premium pays you for bearing a risk that others want to offset. Momentum fits that as you face the crash risk, similar to simple buy and hold. Trend following, not so much since it is often using a stop-loss that quickly gets you out if trends have no follow-through. This and the fact that it tends to do very well during strong unexpected moves gives it a positive skew. It's unusual to get a hedge and a positive expected return at once, and that may be why it's been competed down as money piled in.
I will return to both trend-following and momentum later on when I will go through the systematic portfolio as both are large part of it.
Variance Risk Premium
There are not that many reasons to cover the variance risk premium in detail since it has a standalone article on the blog. However, for those of you that have no desire to trade options, the main premise is that implied volatility tends to sit above the realized volatility. There are several reasons why this happens, but one of the biggest ones is that traders overpay for protection, which makes it a perfect example of a risk premium trade.
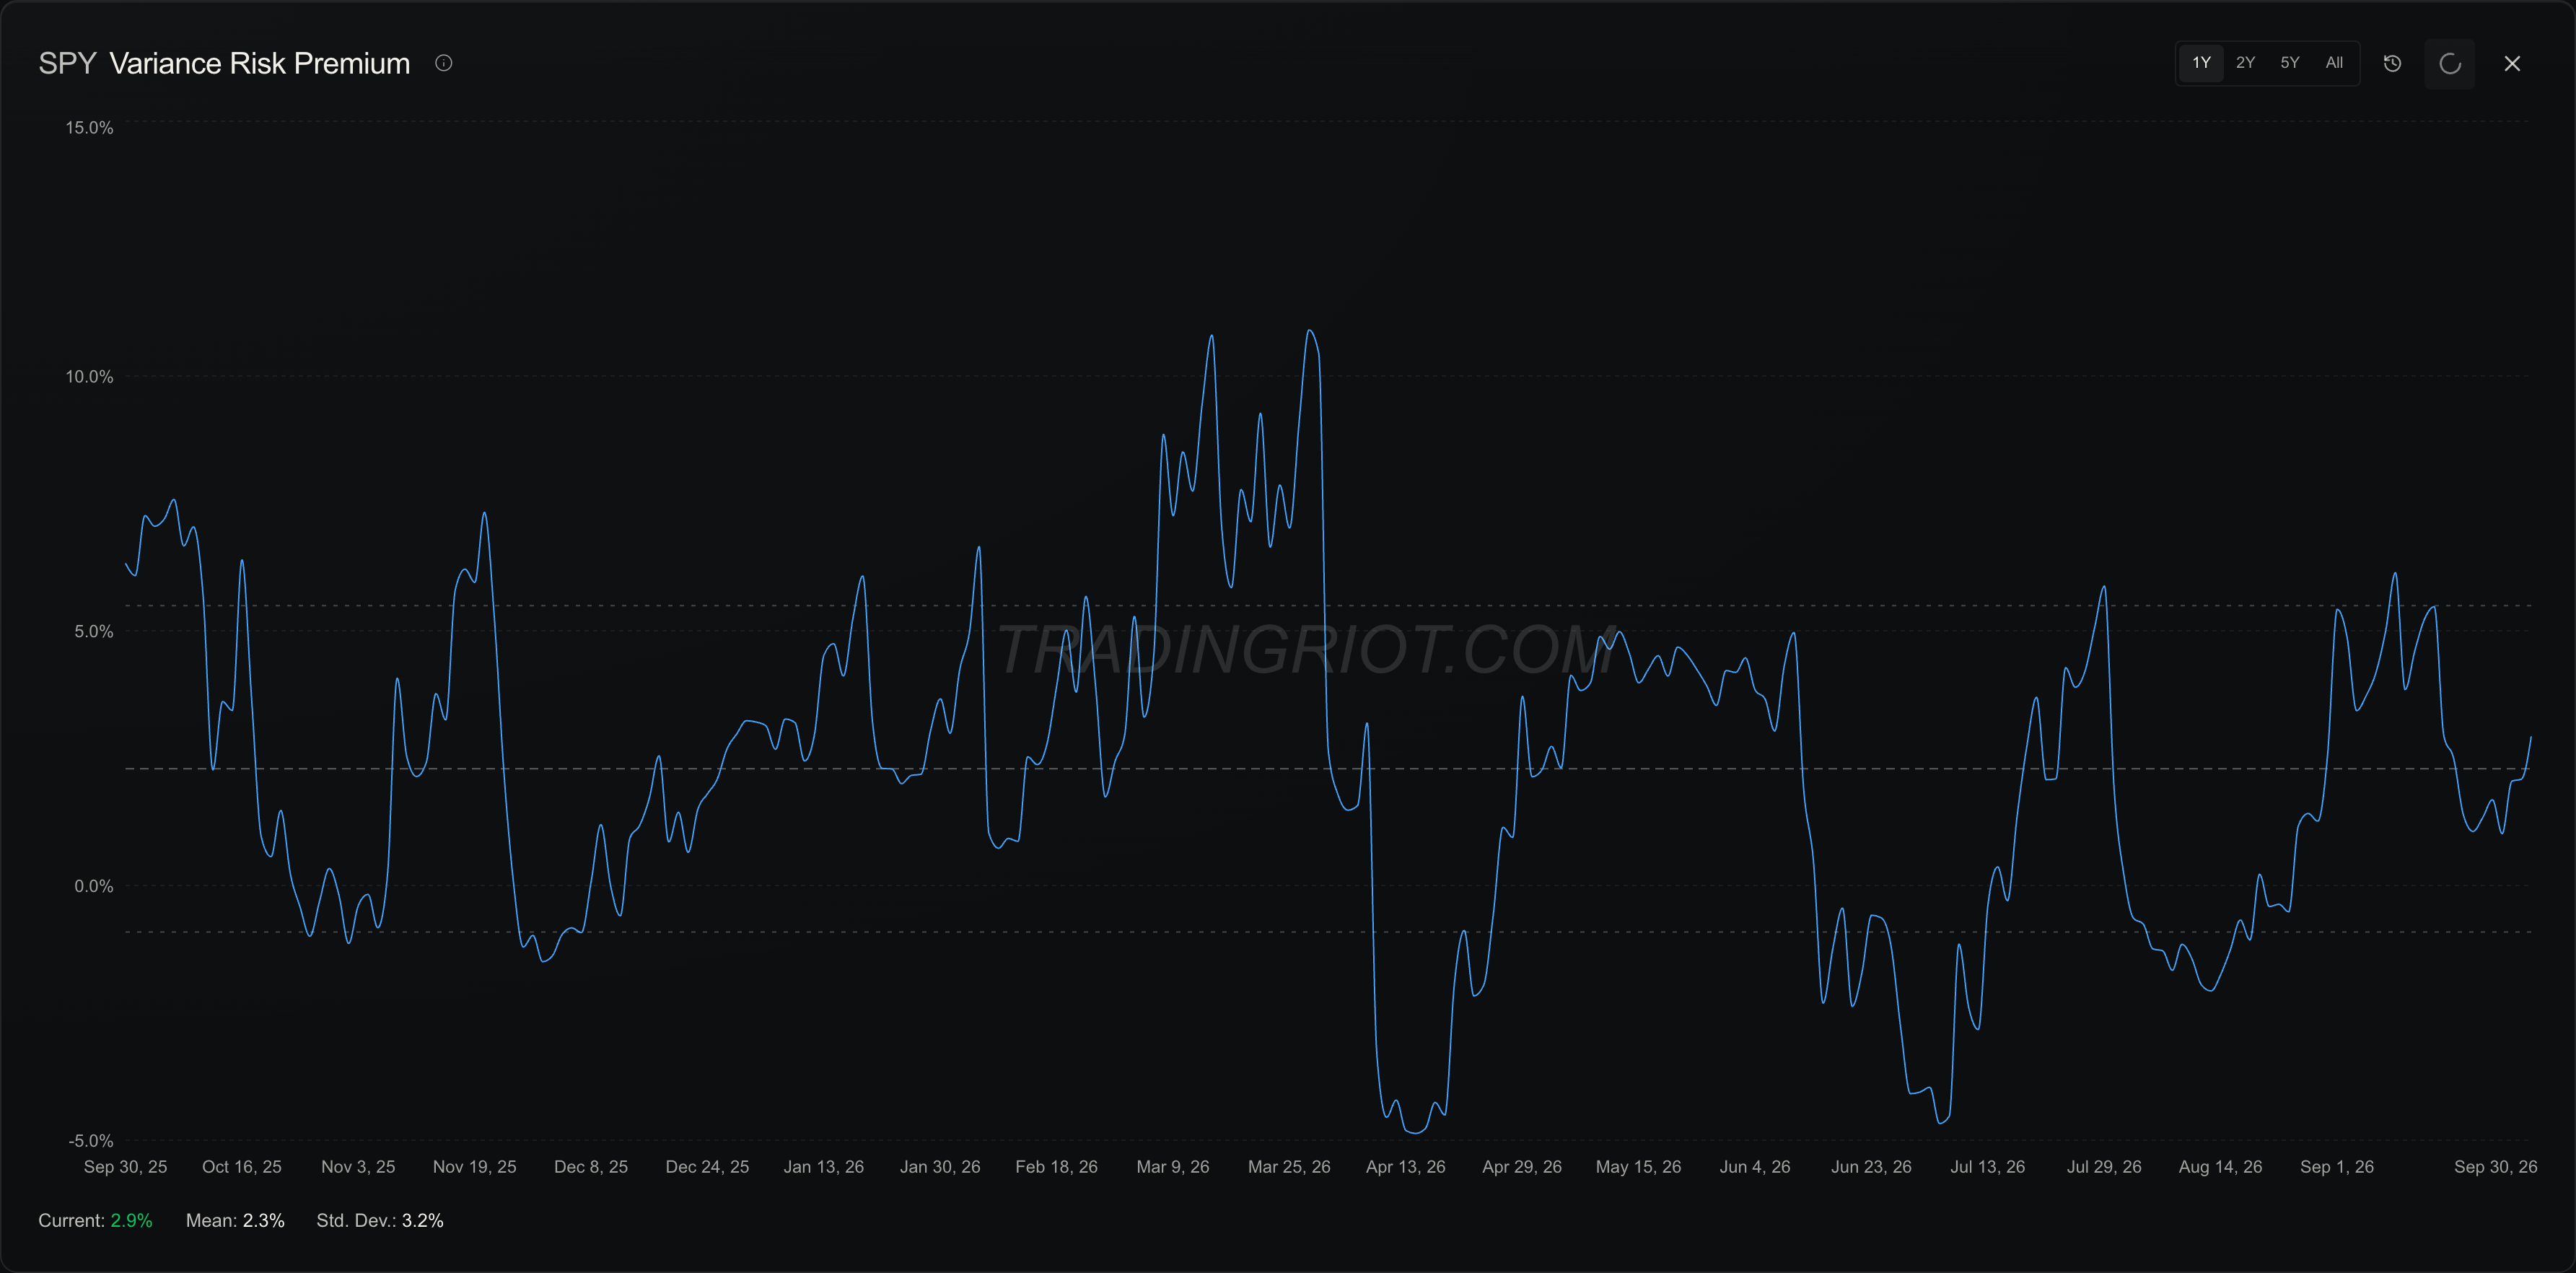
SPY’s 30-day implied vol was about 13.4, against a 20-day realized vol of about 10.5. That's a gap of roughly 3 vol points. Over the past year the mean was around 2-3 points, so you can see it is persistent.
This gap is the risk premium; options sellers earn it on average, but they face occasional massive losses during market crashes.
While the above mentioned above article goes into much detail on structuring trades and avoiding large losses, in the simplest form of continuously selling 30-day straddle, the negative skew is clearly visible on SLV which is ETF tracking performance of silver. Blindly selling volatility performed well up until the middle of last year, when silver went on a massive rally.
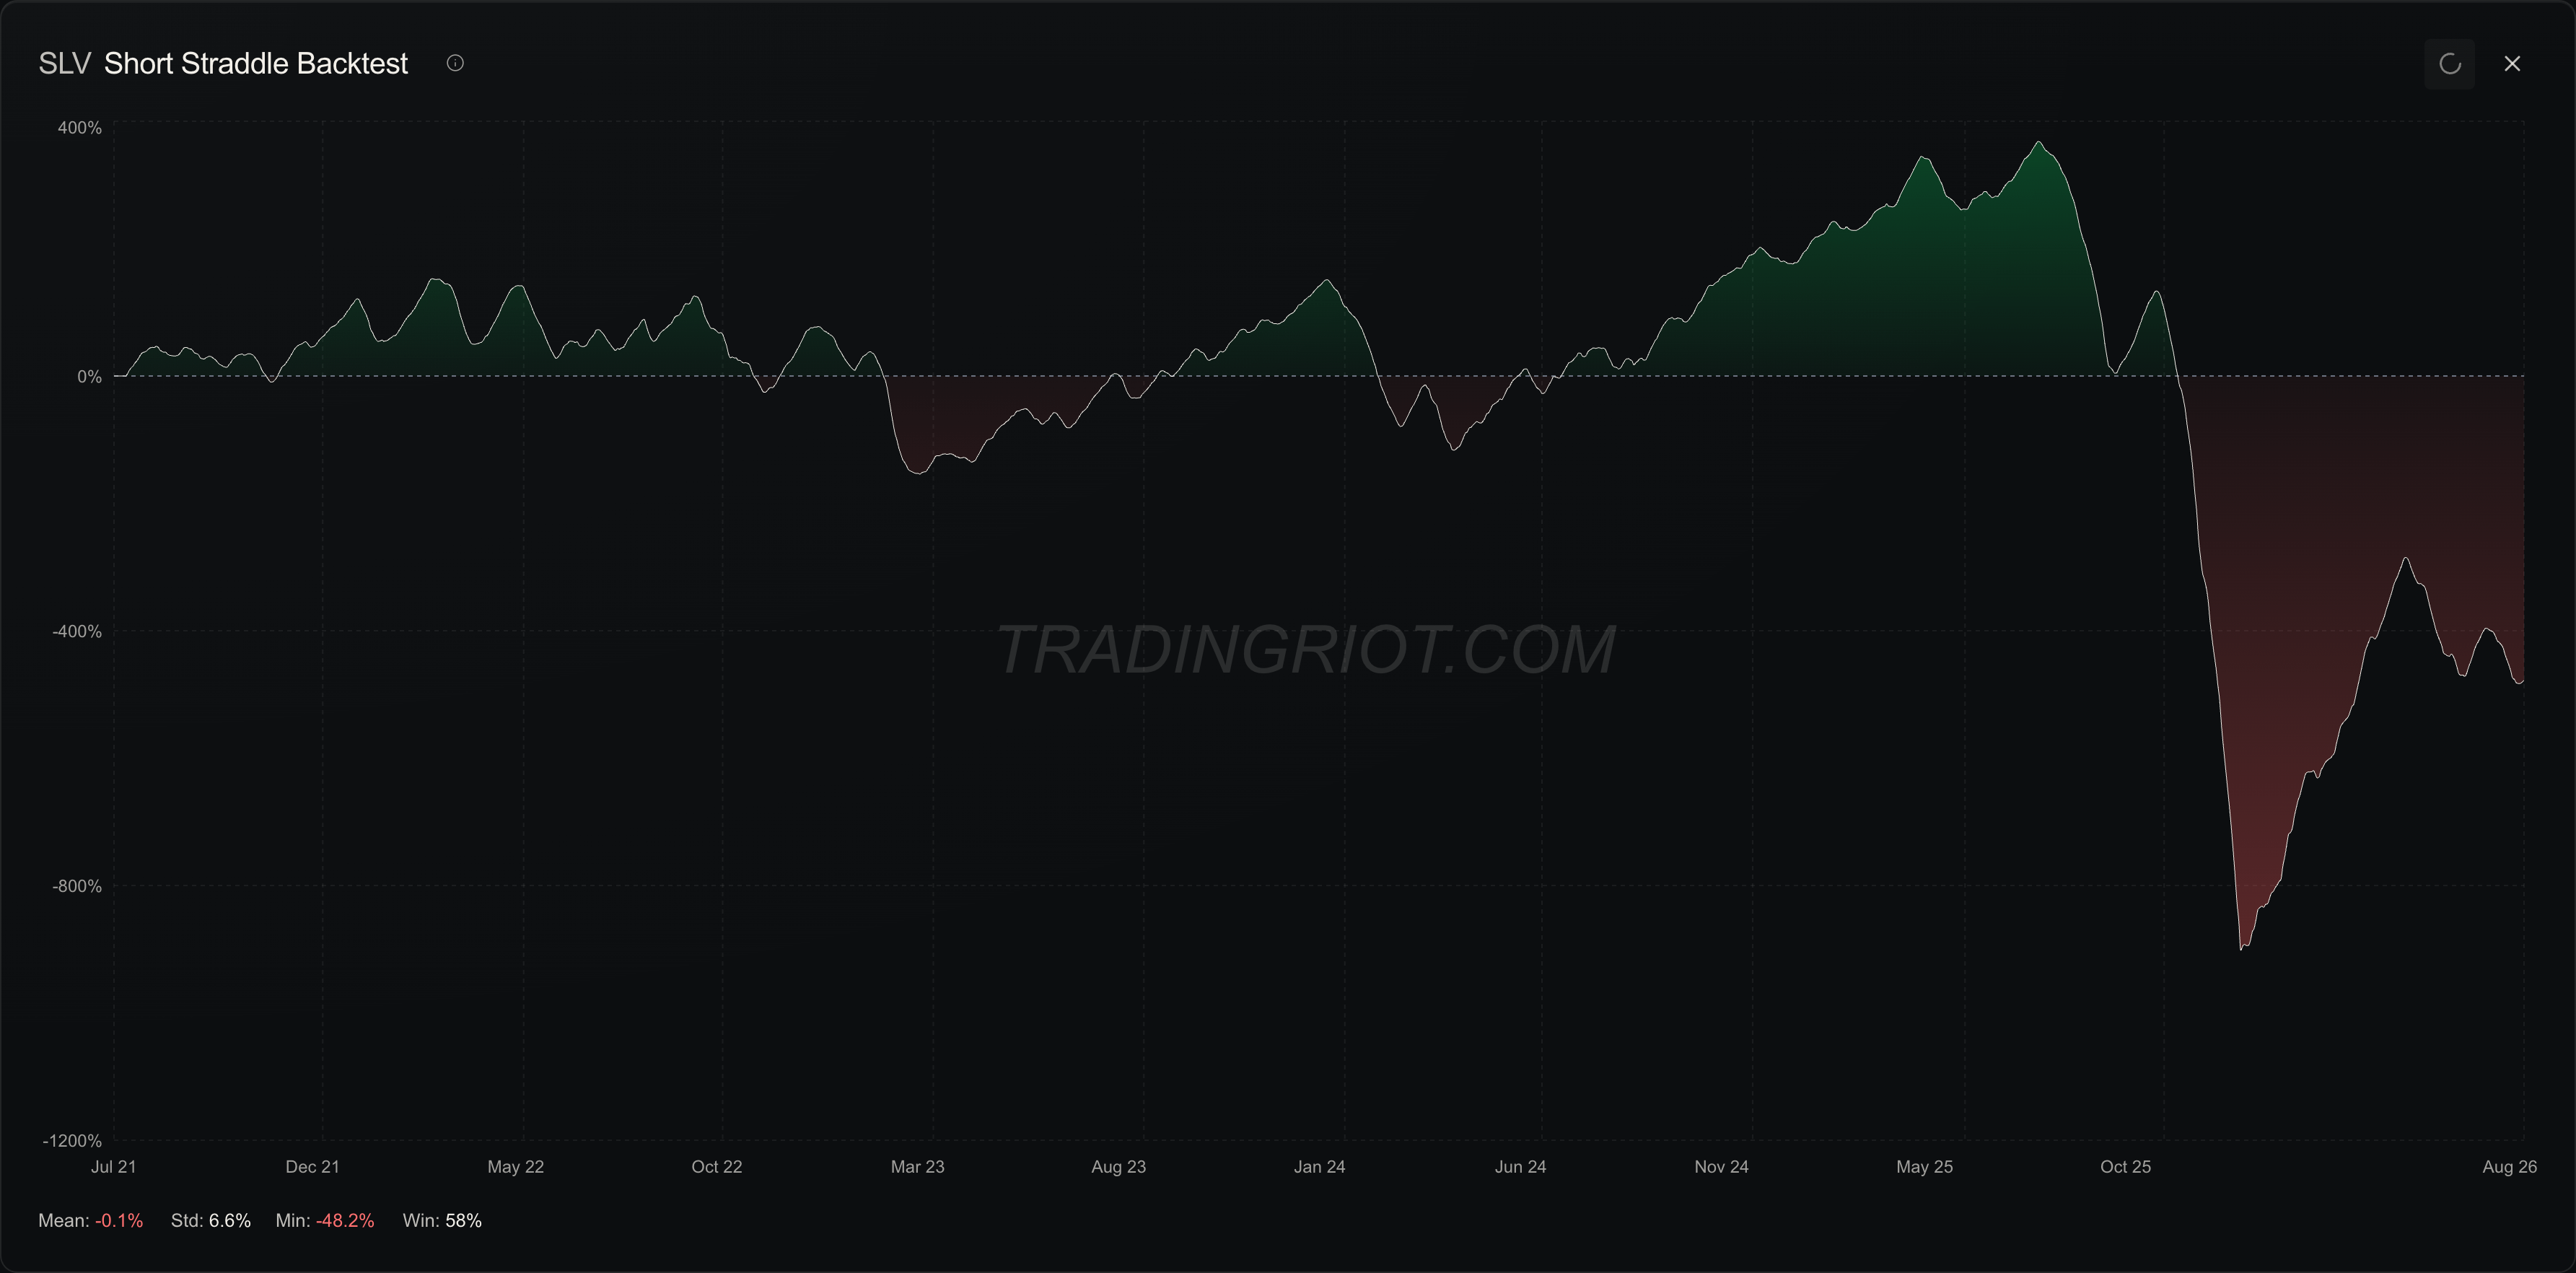
But because of these large unexpected moves that lead to massive losses, VRP is persistent. More sellers, more products, and more systematic vol funds have narrowed it in places, and it generally goes through cycles of thin vs. rich premiums, but it hasn't disappeared, because the demand for protection hasn't either.
Skew Premium
When I spoke about skew earlier in this article, I spoke about it in relation to payoff profile; this is a different skew now. In options, skew is the difference in implied volatility across strikes.
In equities, the out-of-the-money puts usually cost more than out-of-the-money calls. Since the markets tend to showcase the “staircase up, elevator down” behavior where usual up days are slow and steady while down days feel like the world is about to end tomorrow.
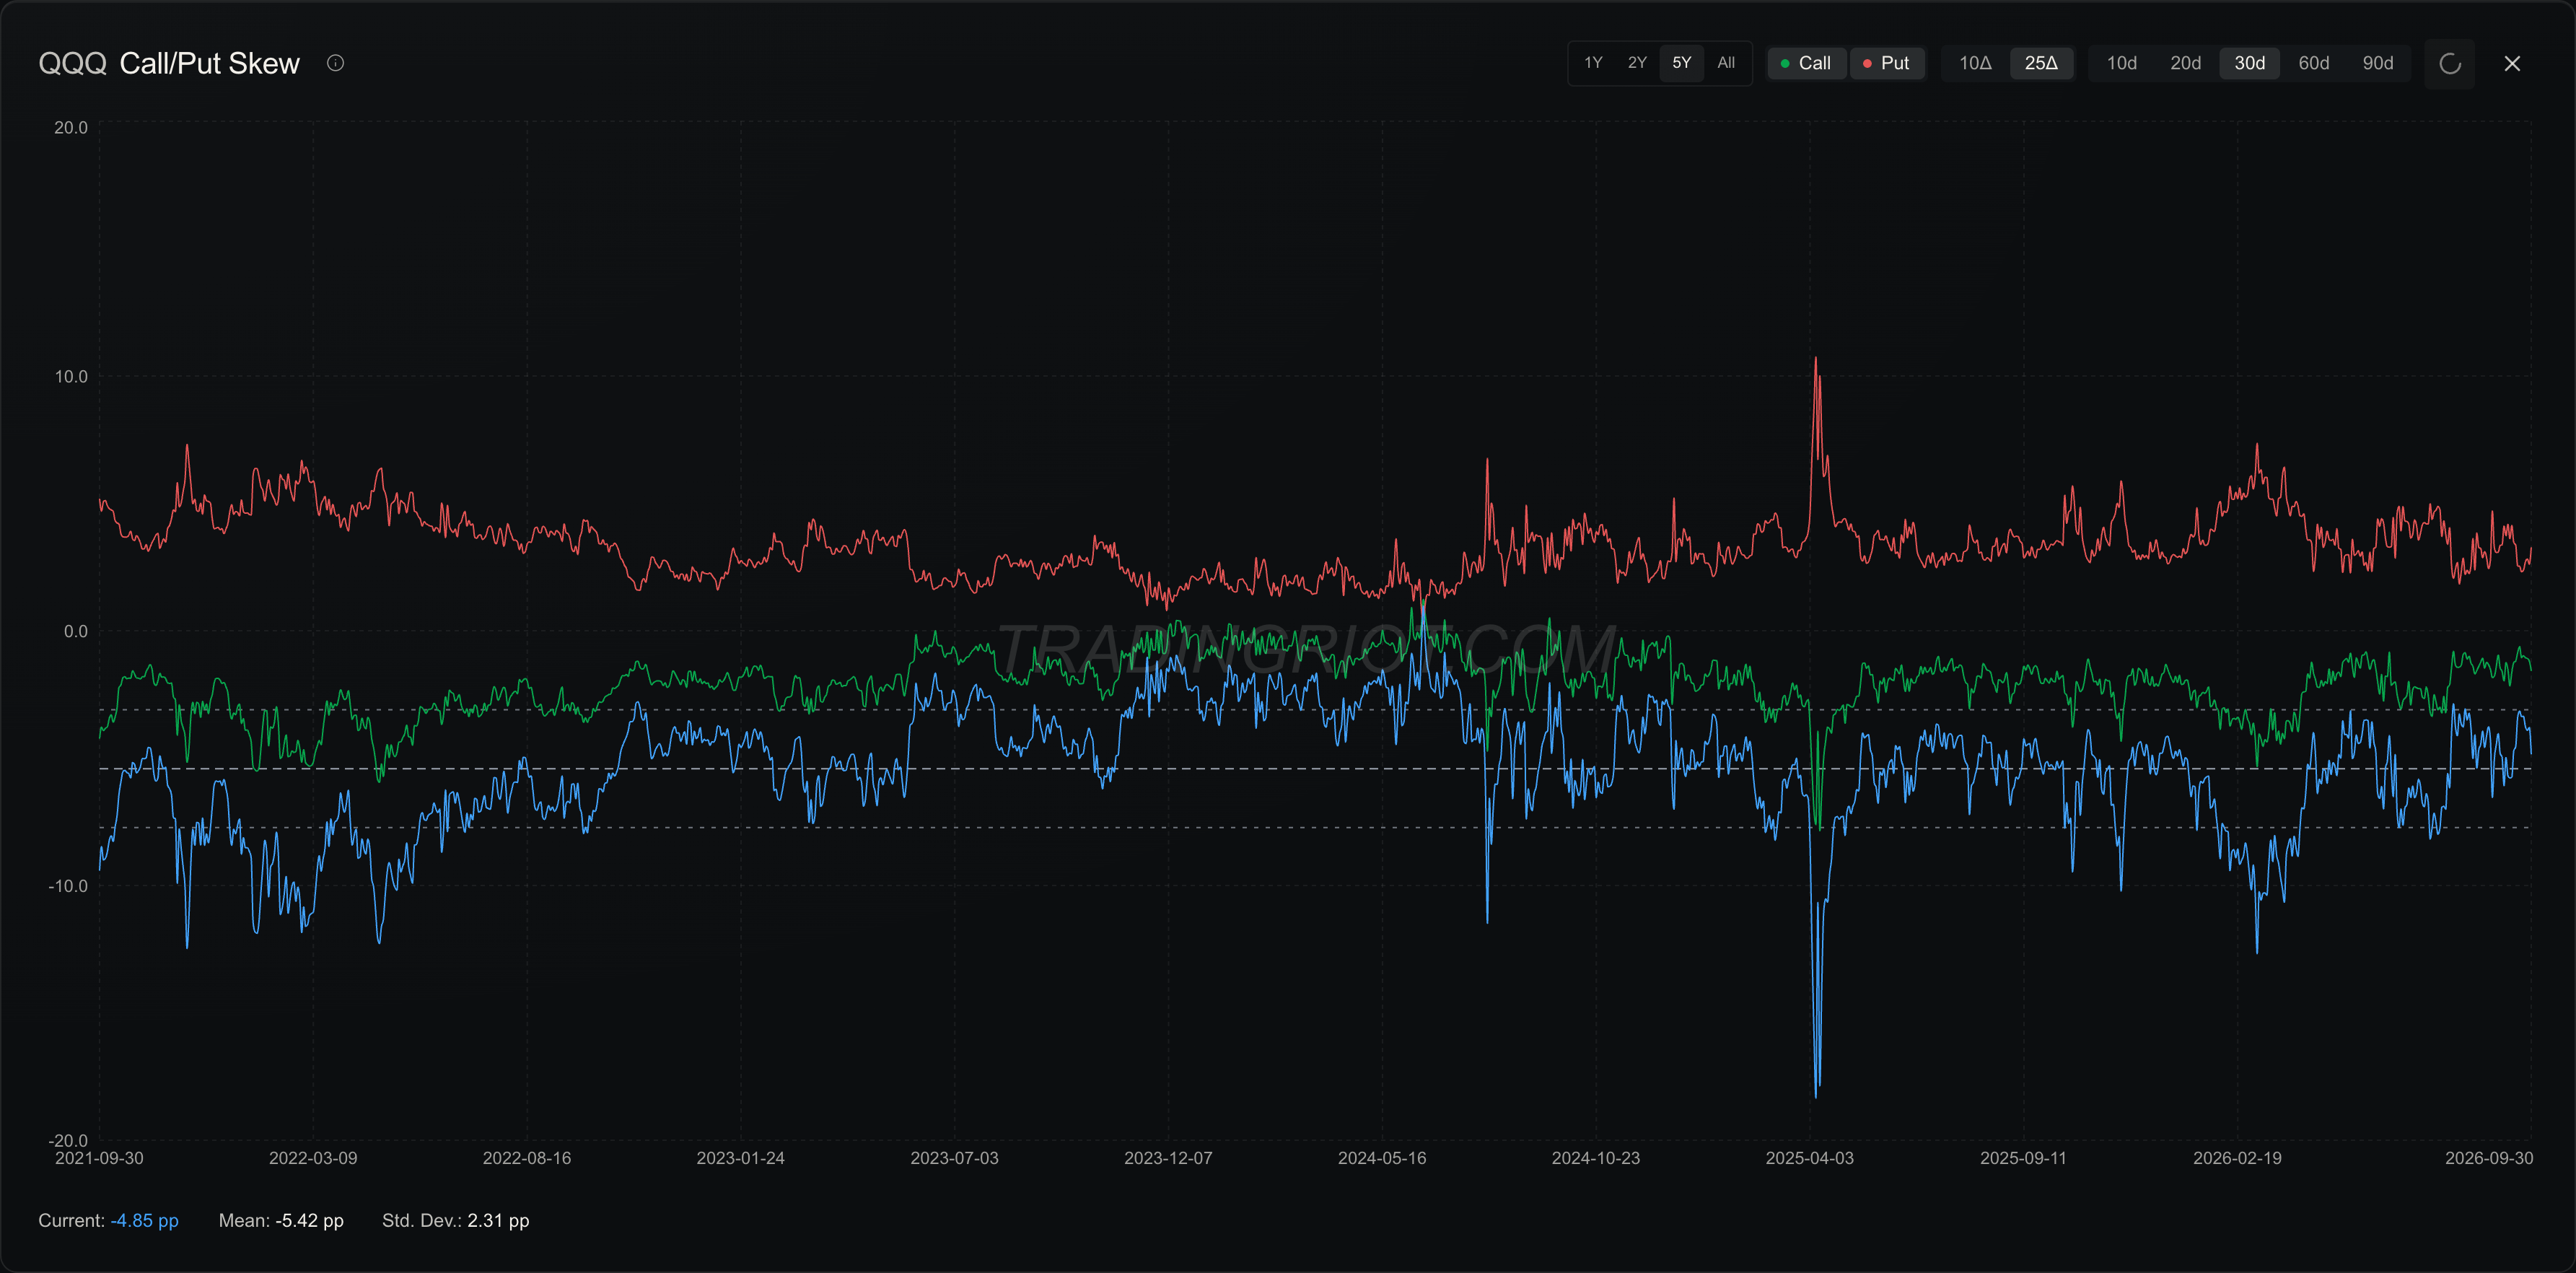
Over the last 5 years, the skew on average was -5.42 points in QQQ. In simple terms this means that buying OTM puts will cost you more than OTM calls since portfolio managers buy puts as crash insurance, regardless of price, driving this demand up.
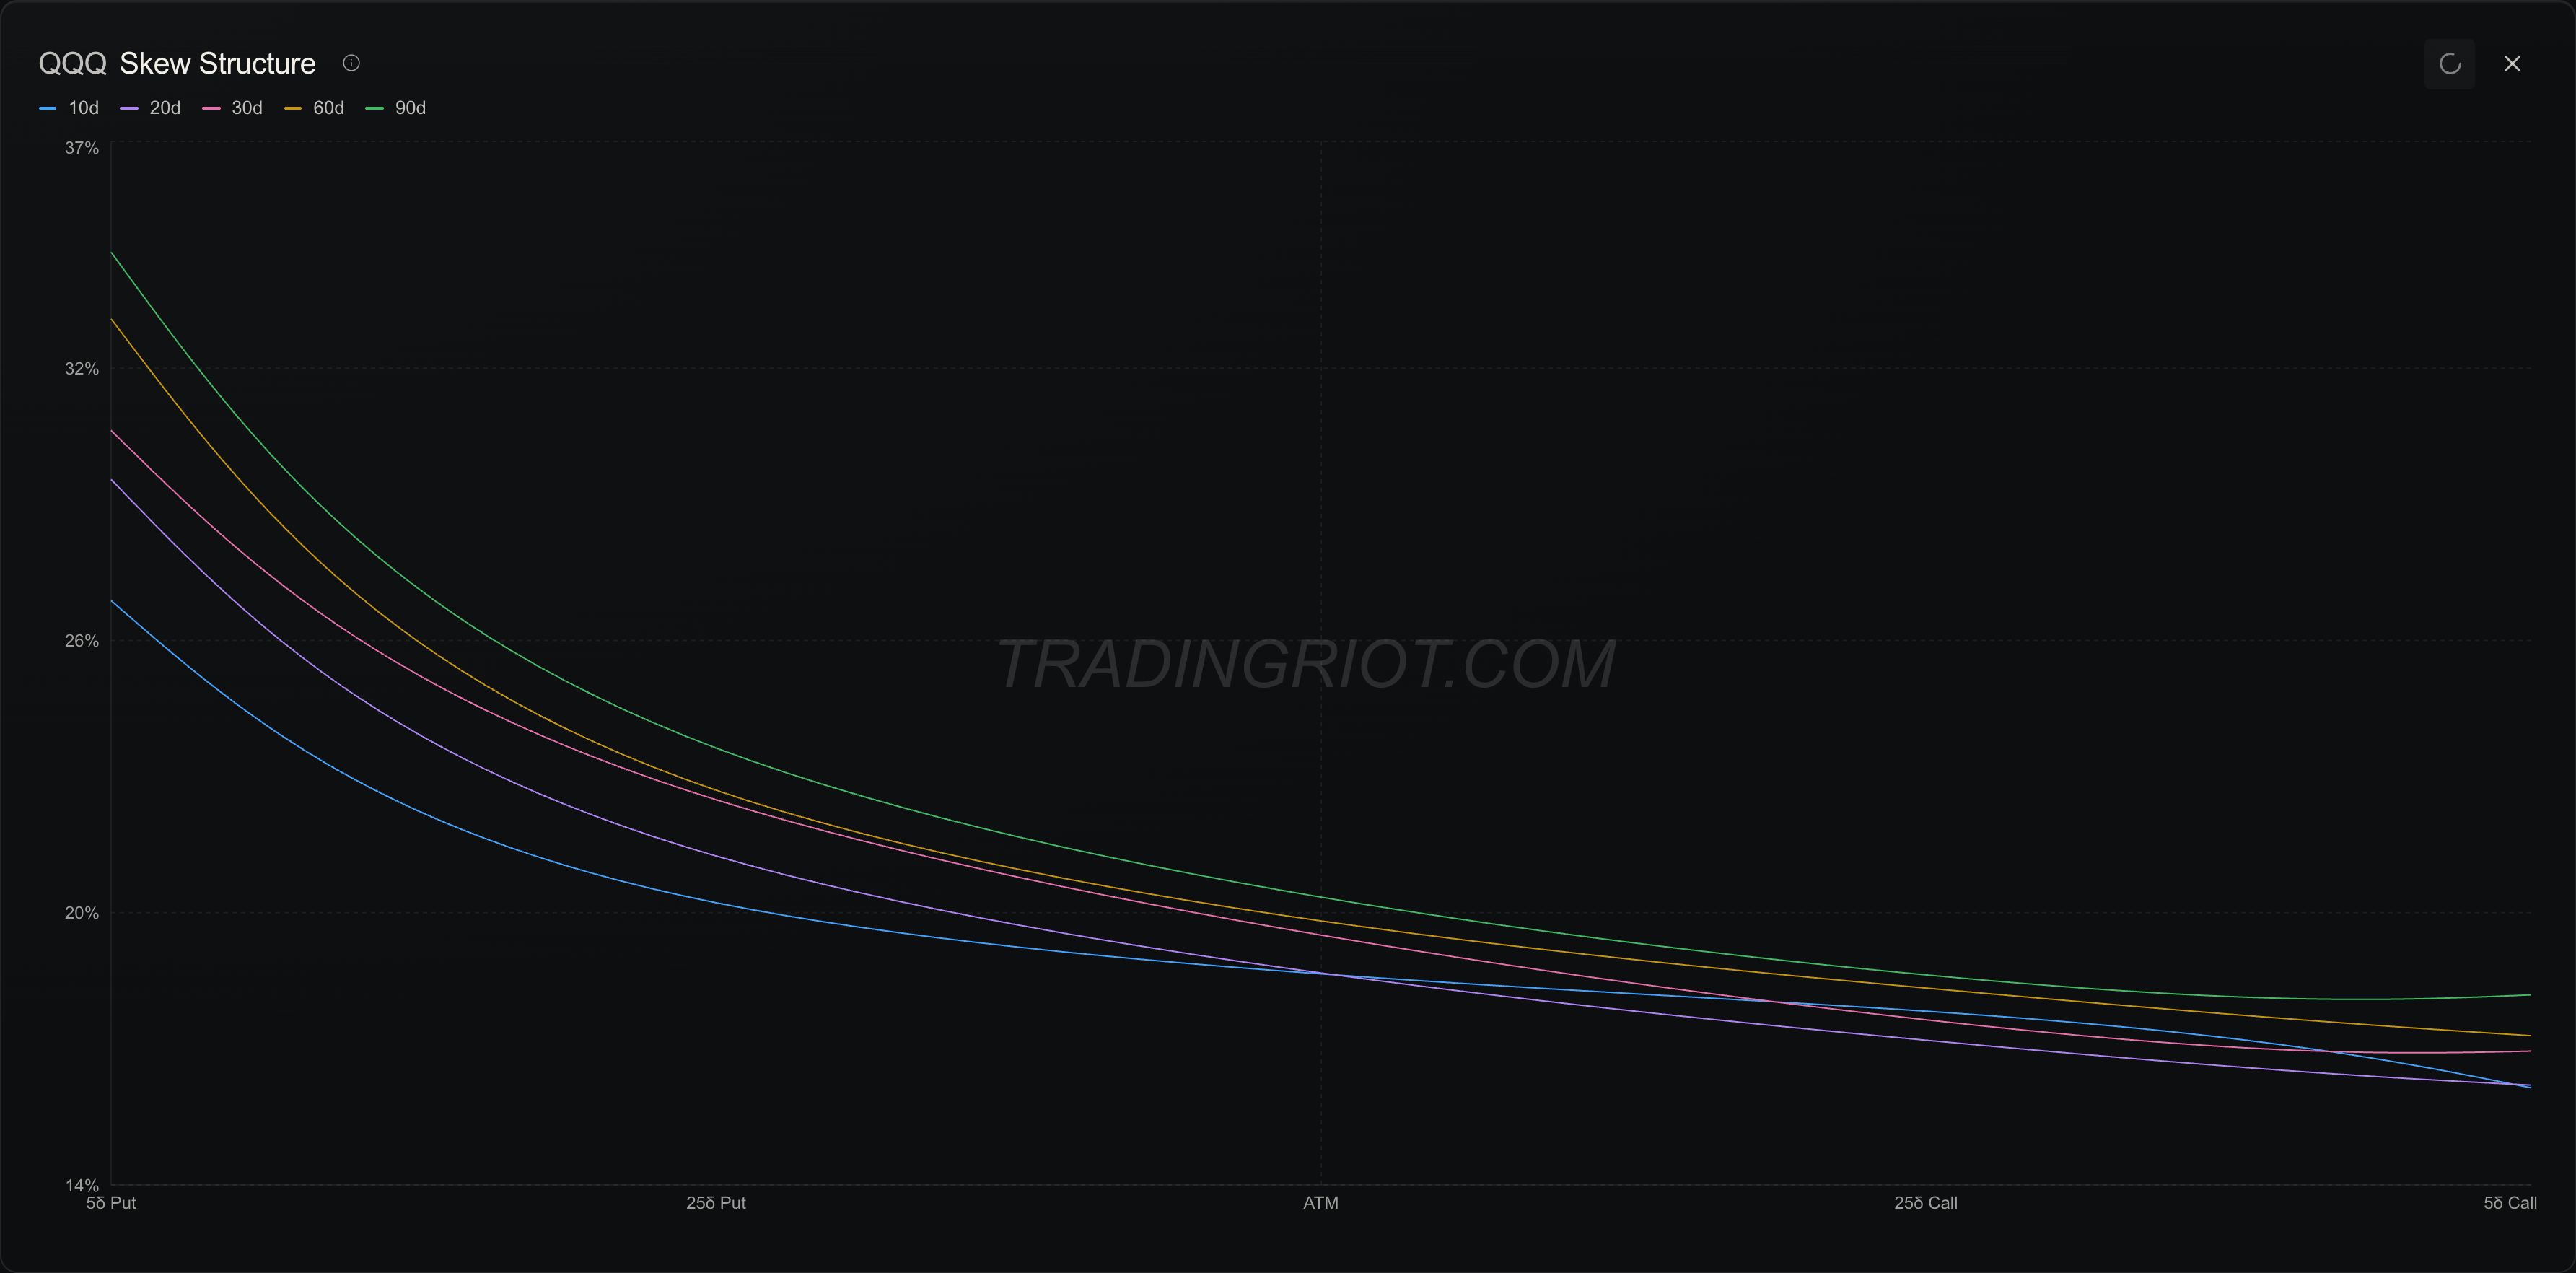
Compared to VRP, where we would sell a delta neutral structure like straddle or strangle, to harvest skew premium, we will be selling only the out-of-the-money options.
The risk profile is the same as selling straddles or strangles, with the difference that a short put collects a lower premium but benefits from positive drift, which stocks tend to have.
Either way you are getting paid for bearing a crash risk others are trying to hedge away; this has been persistent for decades but carries one of the ugliest tails from the group.
Term Premium
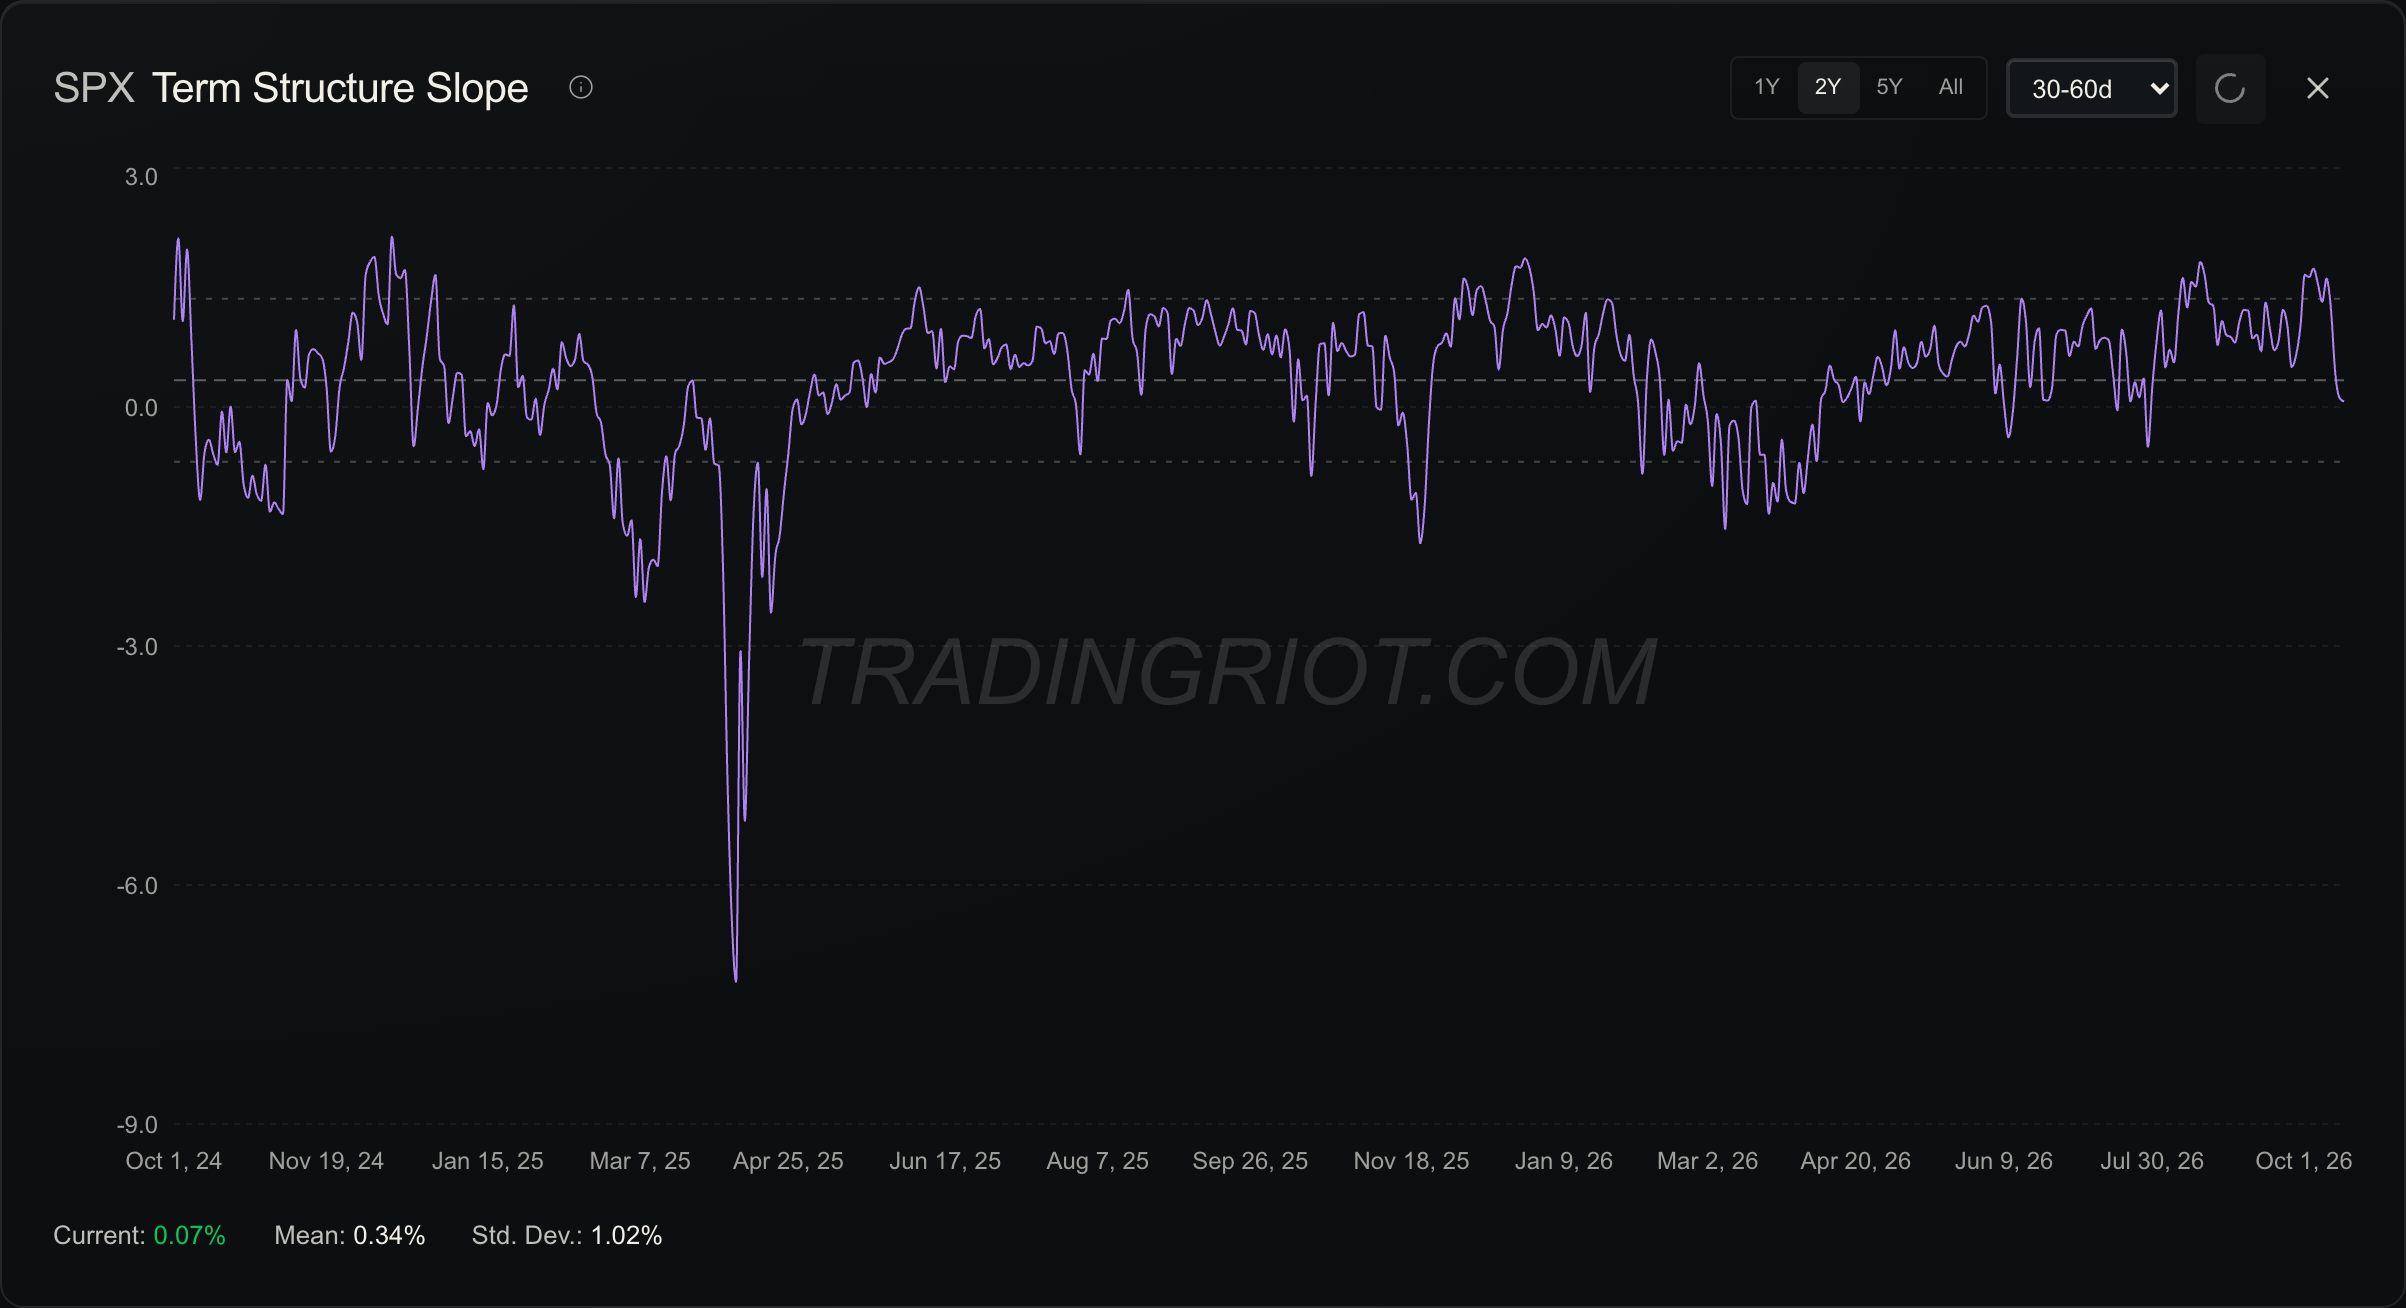
Futures usually sit in contango, meaning longer-dated futures cost more than spot. This has a pretty simple explanation since we are way more certain about near events compared to what is going to happen weeks or months from now. Volatility mean reverts, so when spot VIX is low, futures price in a drift back up. And hedgers pay a premium for protection since long volatility works as a hedge for equity portfolios.
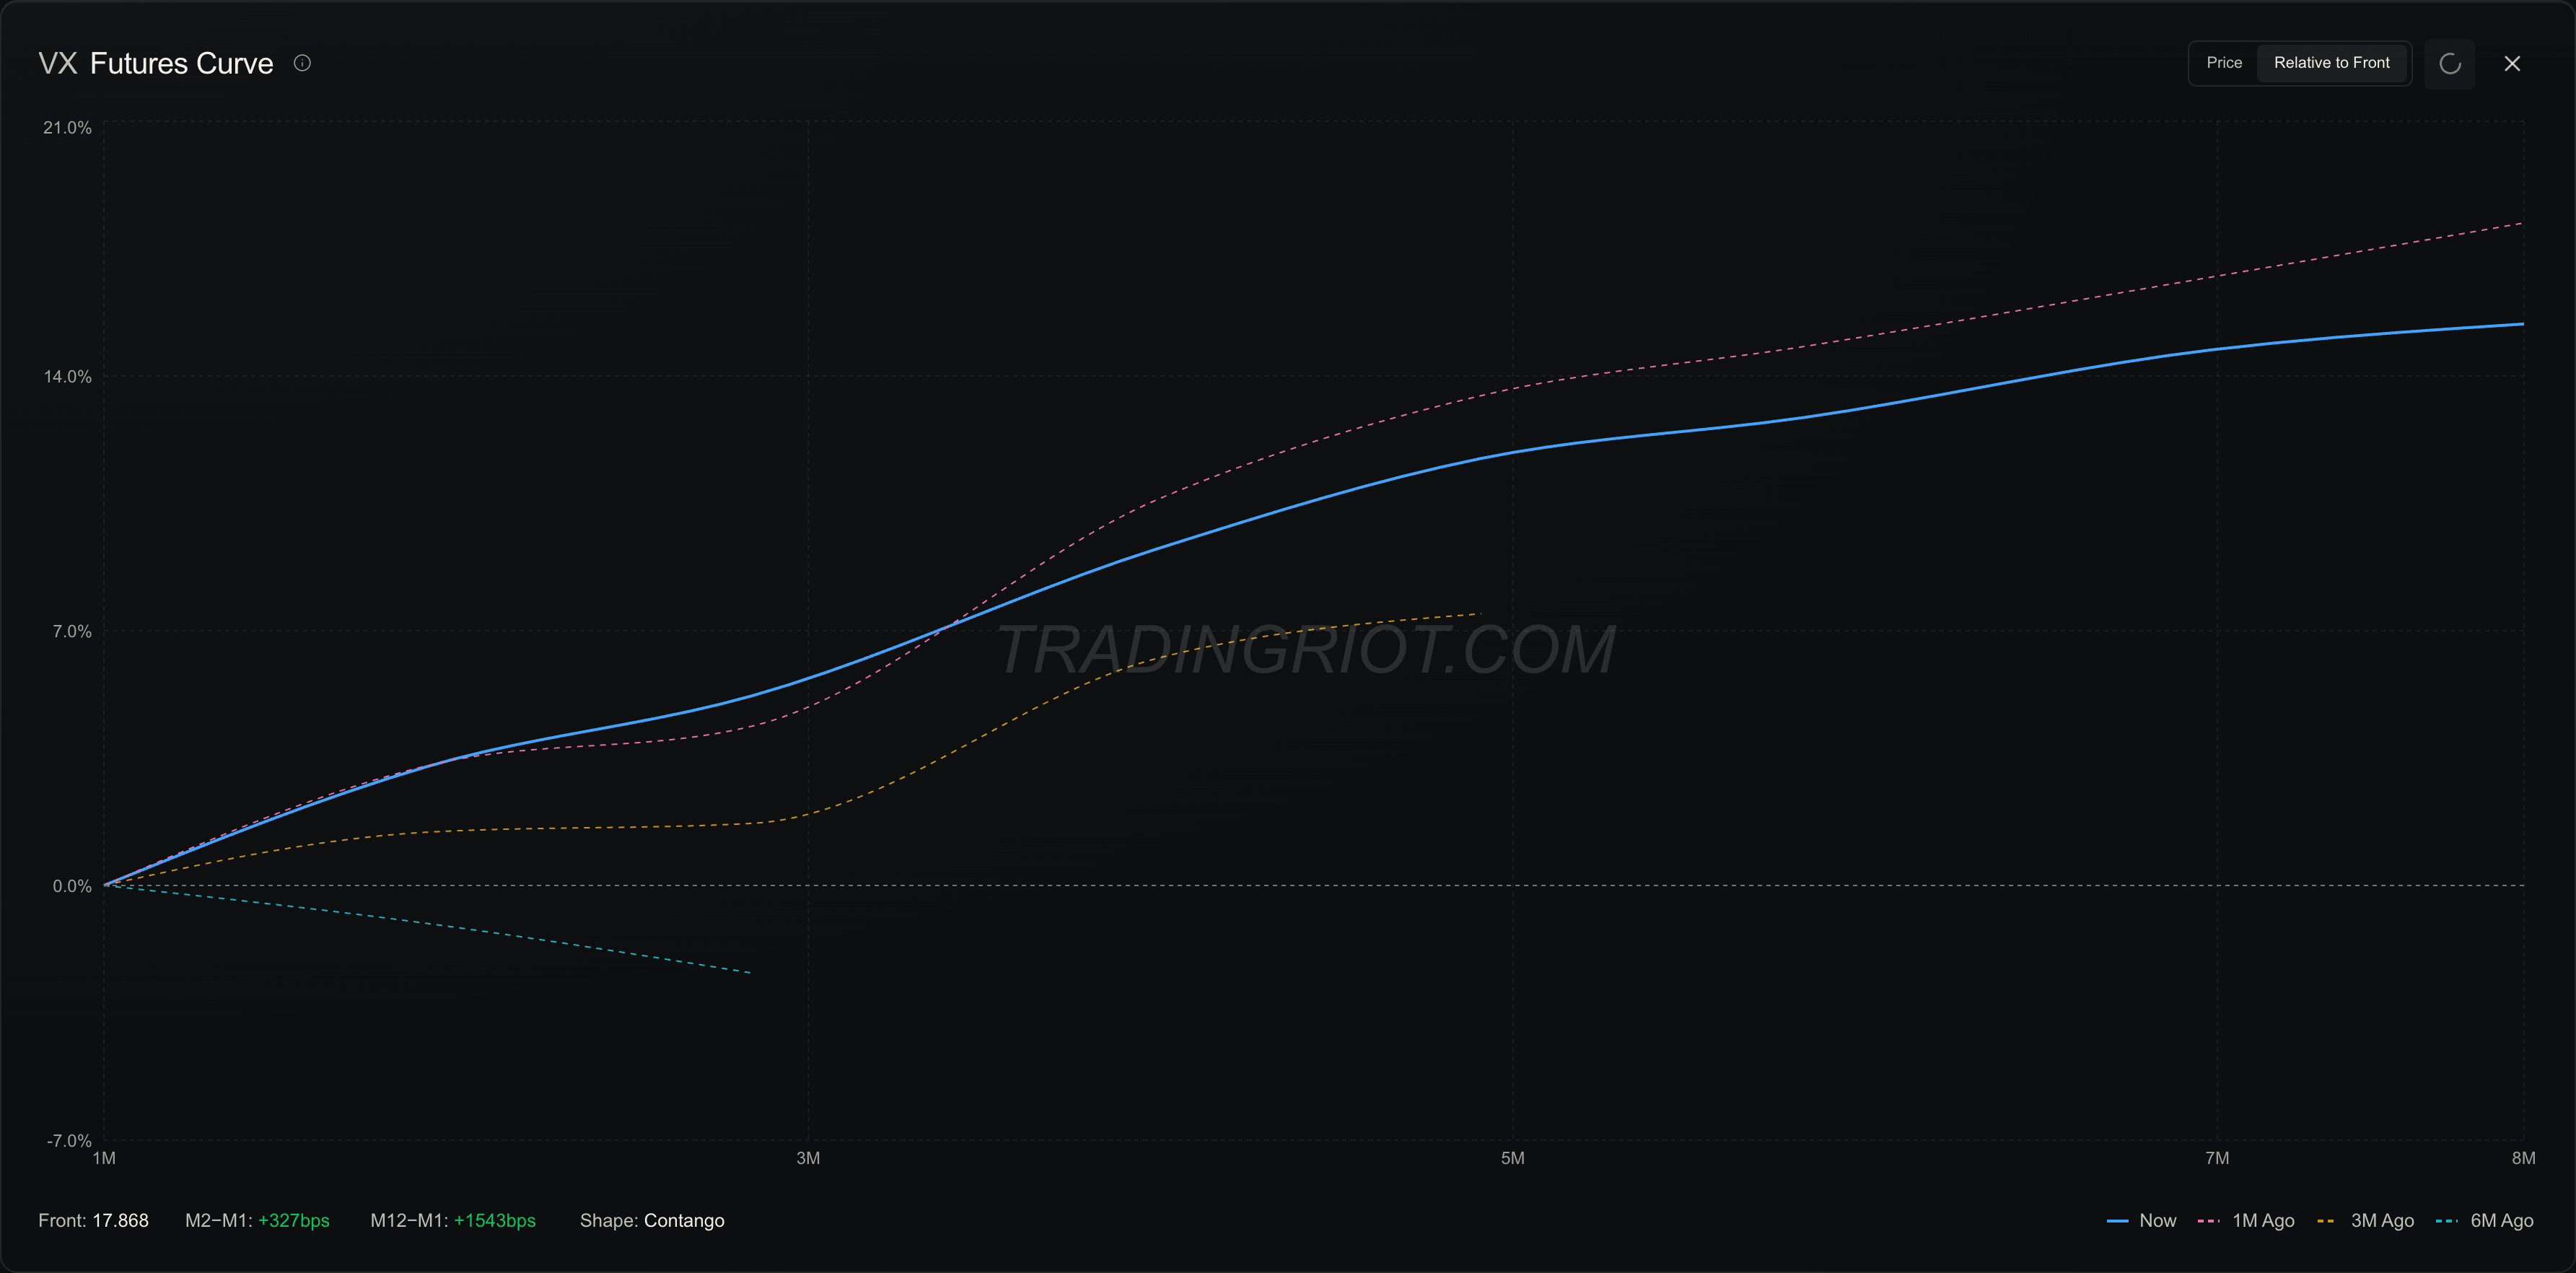
Looking at VIX futures here, which is the most popular product for this trade, we can see that futures expiring a month from now are trading about 3% higher compared to spot. This means that if we short the front-month contract, we can earn the roll-down as futures converge to the spot price.
While this type of trade got crowded again over the years with many ETFs and ETNs flooding the space, the underlying risk remained the same, and there are many participants trying to offset them.
This trade can be done in a range of futures markets from currencies to commodities, although it is most popular in the VIX since it does not have any directional drift.
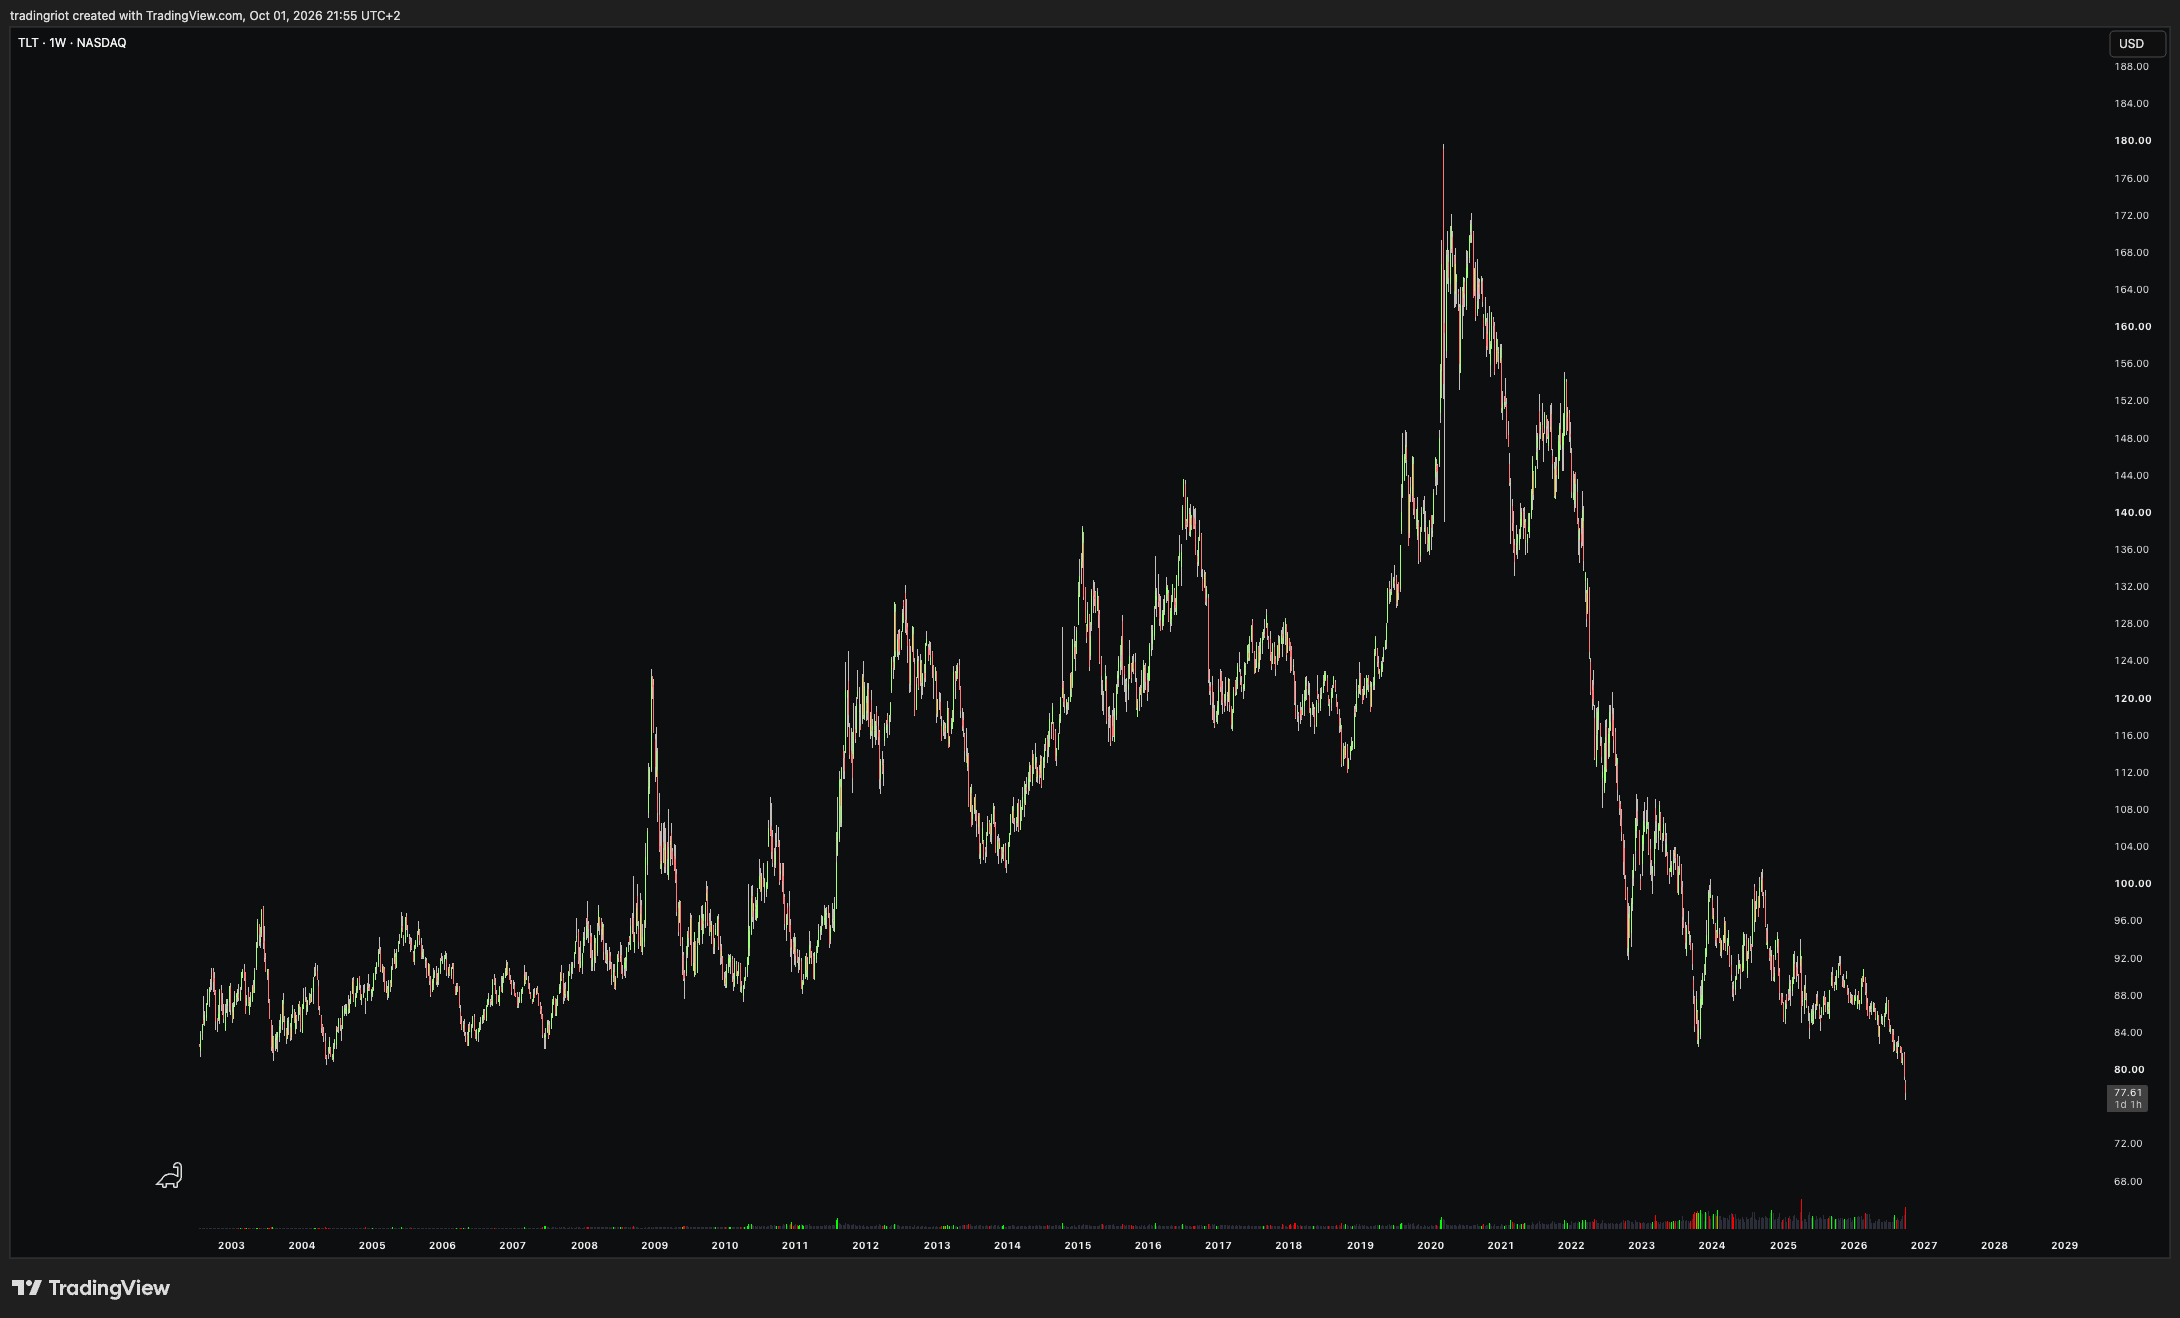
Bonds are another example, but this is more of an institutional-grade premium. Long-dated bonds pay more than short-dated ones because you carry interest rate risk. For US bonds, it now sits around 0.5 to 1%. That's a thin reward for the risk. Also worth mentioning that treasuries performed worse than many altcoins and lost roughly half their value in the past 5 years, so trading the roll-down in VIX sounds like a better use of your time.
Speaking of some other more nuanced premiums you probably won’t be harvesting but are worth mentioning in this article would be credit risk premium, where corporate bonds yield more than government bonds because companies can default. Or a liquidity premium, where illiquid assets pay more because you can’t sell them quickly.
These are the oldest and most durable premia here. Their size varies across cycles, but they’ve shown up consistently across many regimes. Nobody has arbitraged away the fact that lending to companies is riskier than lending to governments.
Carry
The original premise of a carry trade is simple: borrow where money is cheap and lend where it's expensive. You're paid for holding the higher-yielding asset, as long as prices don't move against you.
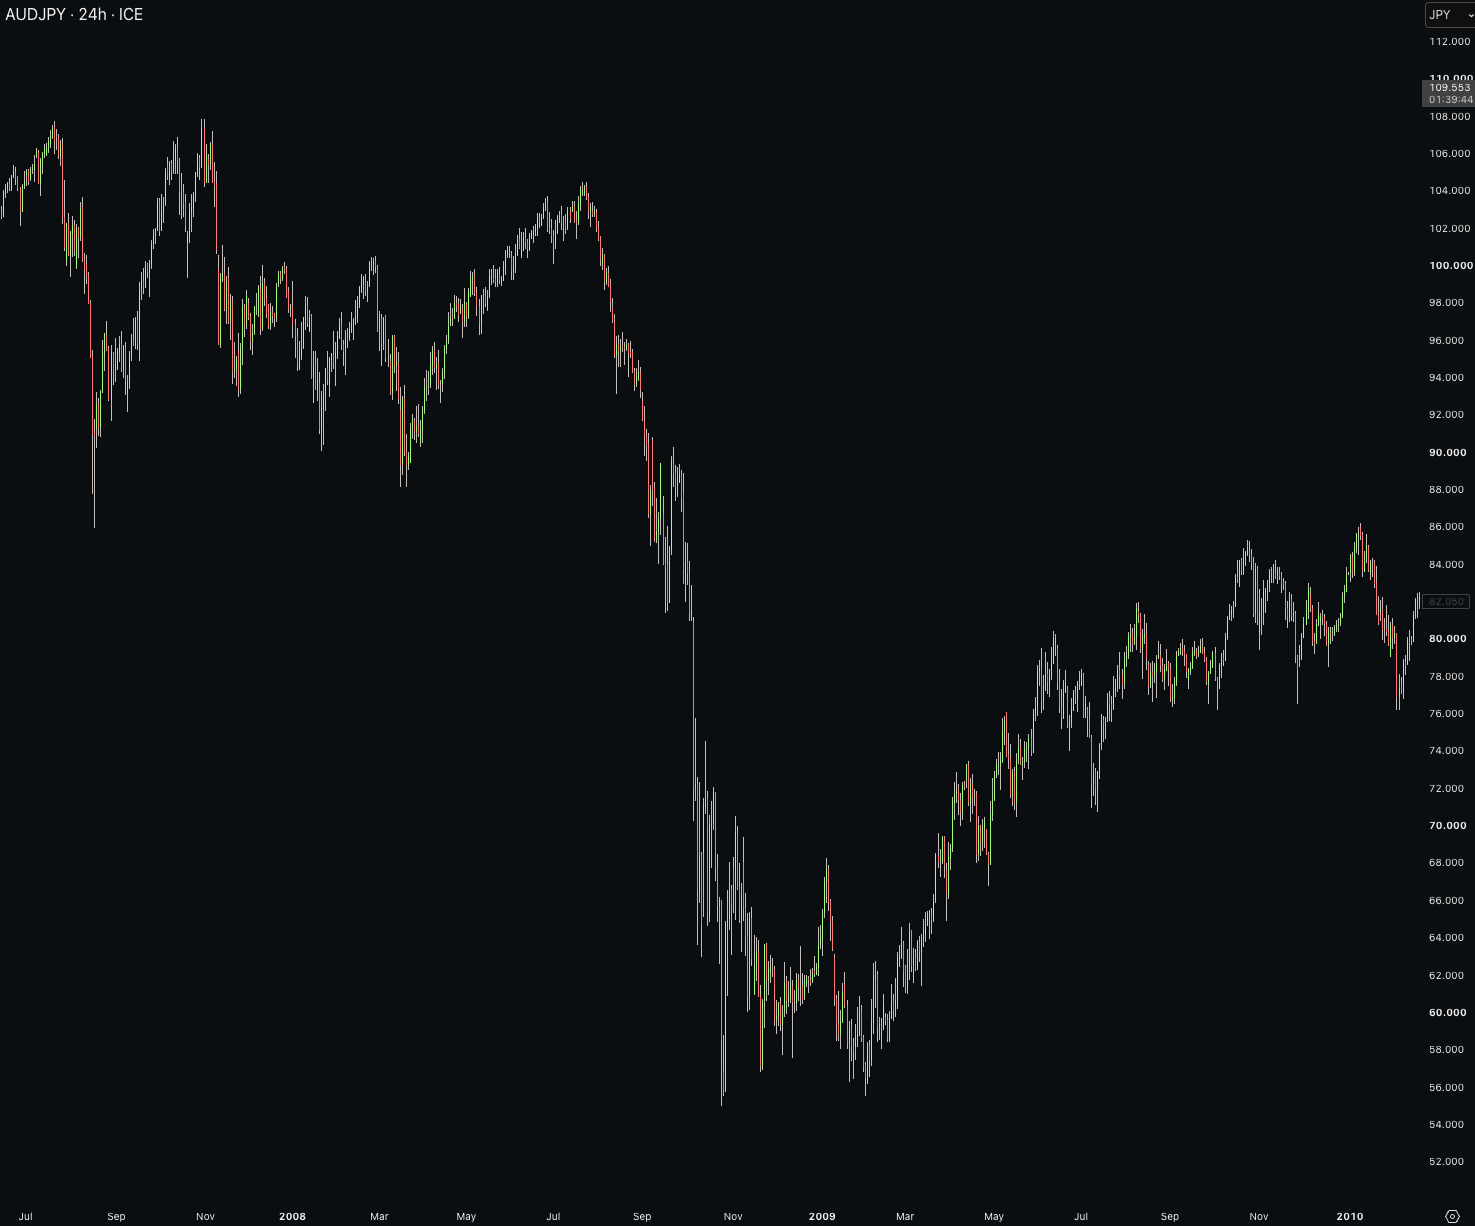
The classic carry trade works in currency markets. You borrow money in a low-interest-rate currency (e.g., Japanese yen at 0.5%) and invest it in a high-interest-rate currency (e.g., Australian dollars at 5%). You pocket the 4.5% difference. This is the currency carry trade, and it's been profitable historically.
When risk appetite collapses globally, high-yielding currencies tend to crash while safe-haven currencies like the yen and Swiss franc appreciate. Your carry profit gets wiped out in a few days of chaos. The steady income is compensation for the occasional violent reversal.
In futures markets, the same concept applies through basis trading. When futures trade at a premium to spot (contango), you can buy spot and short the future, locking in the difference as profit. This is called cash-and-carry arbitrage. Traditional futures on things like Treasury bonds or equity indices often have a basis that sophisticated players arbitrage.
In traditional markets, these opportunities have been compressed to almost nothing for retail traders. Hedge funds run Treasury basis trades with 30-50x leverage through repo financing, earning tiny spreads that only make sense at massive scale.
Luckily, similar to momentum, crypto still offers great opportunities not only in the delta-one space, like trend-following, but also in delta-neutral trades.
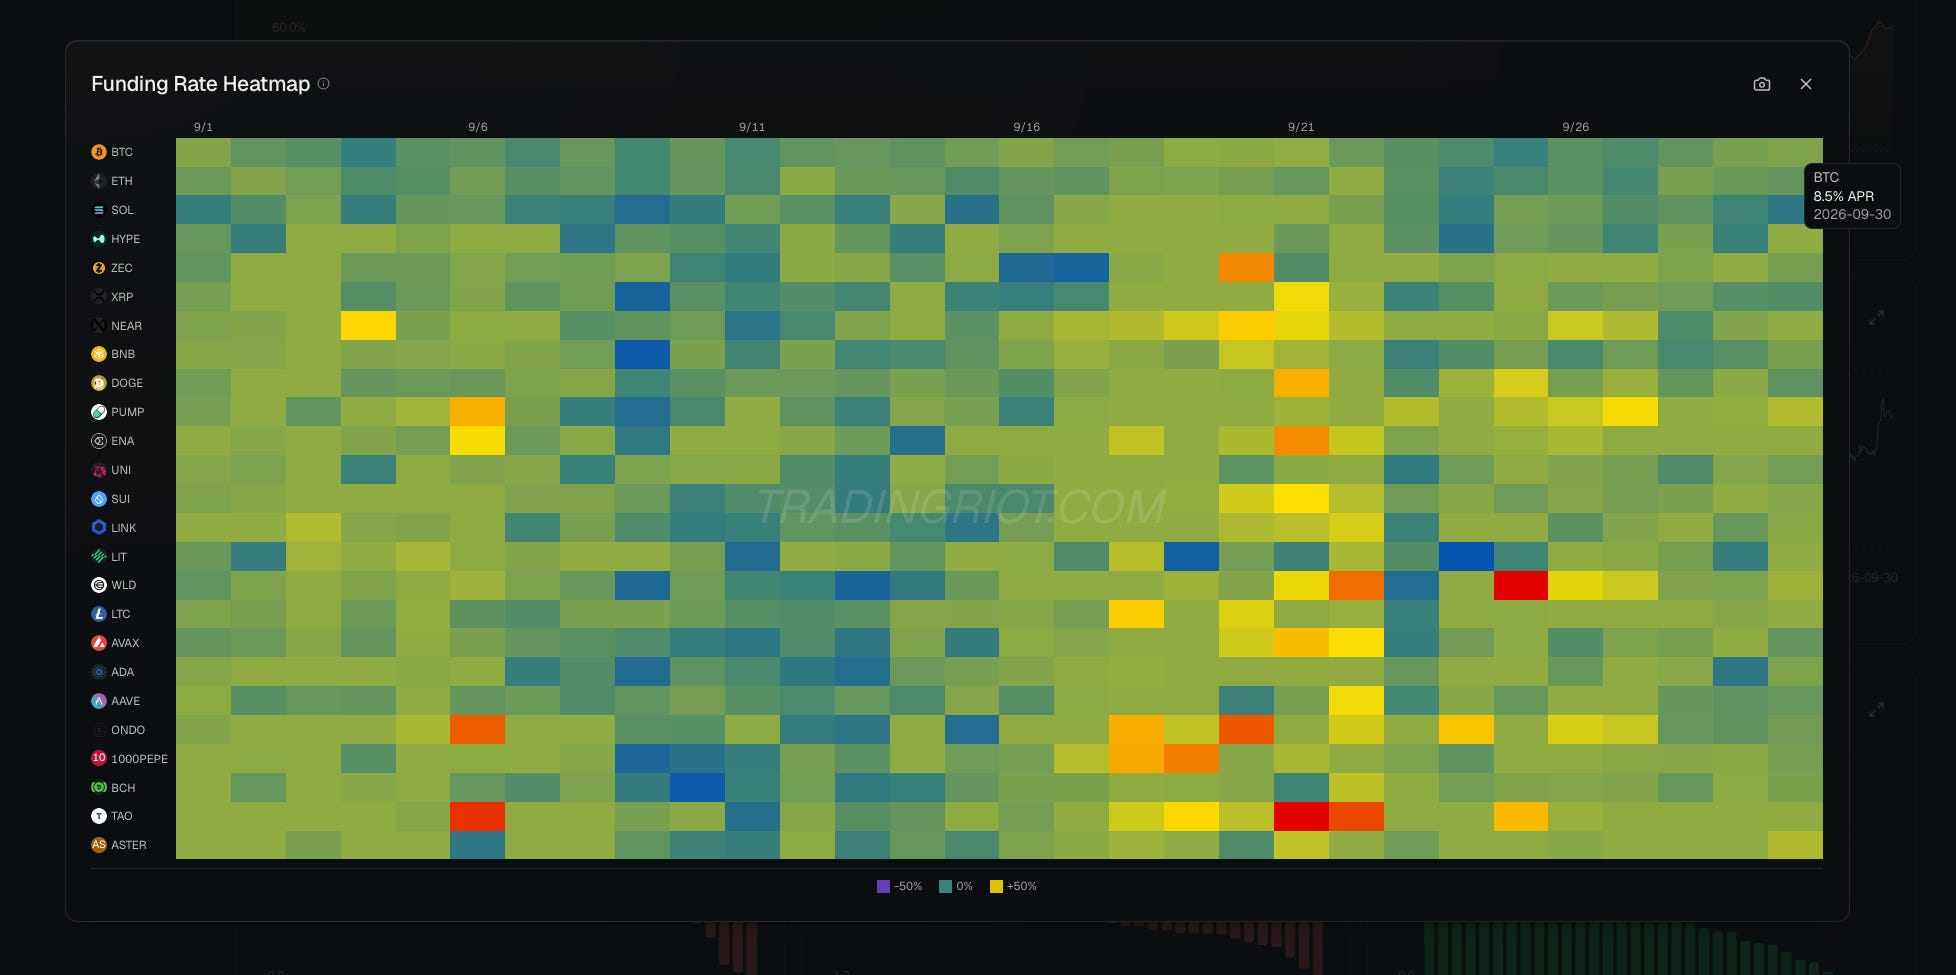
Because perpetual futures do not expire, to balance supply and demand, they pay a funding rate between longs and shorts. When traders crowd into longs (futures above spot price), longs pay shorts. Buy spot, short the perp, and you collect funding while staying market neutral.
This is again a classic example of risk premium, since demand for leveraged long exposure is persistent, and the people supplying the other side get compensated.
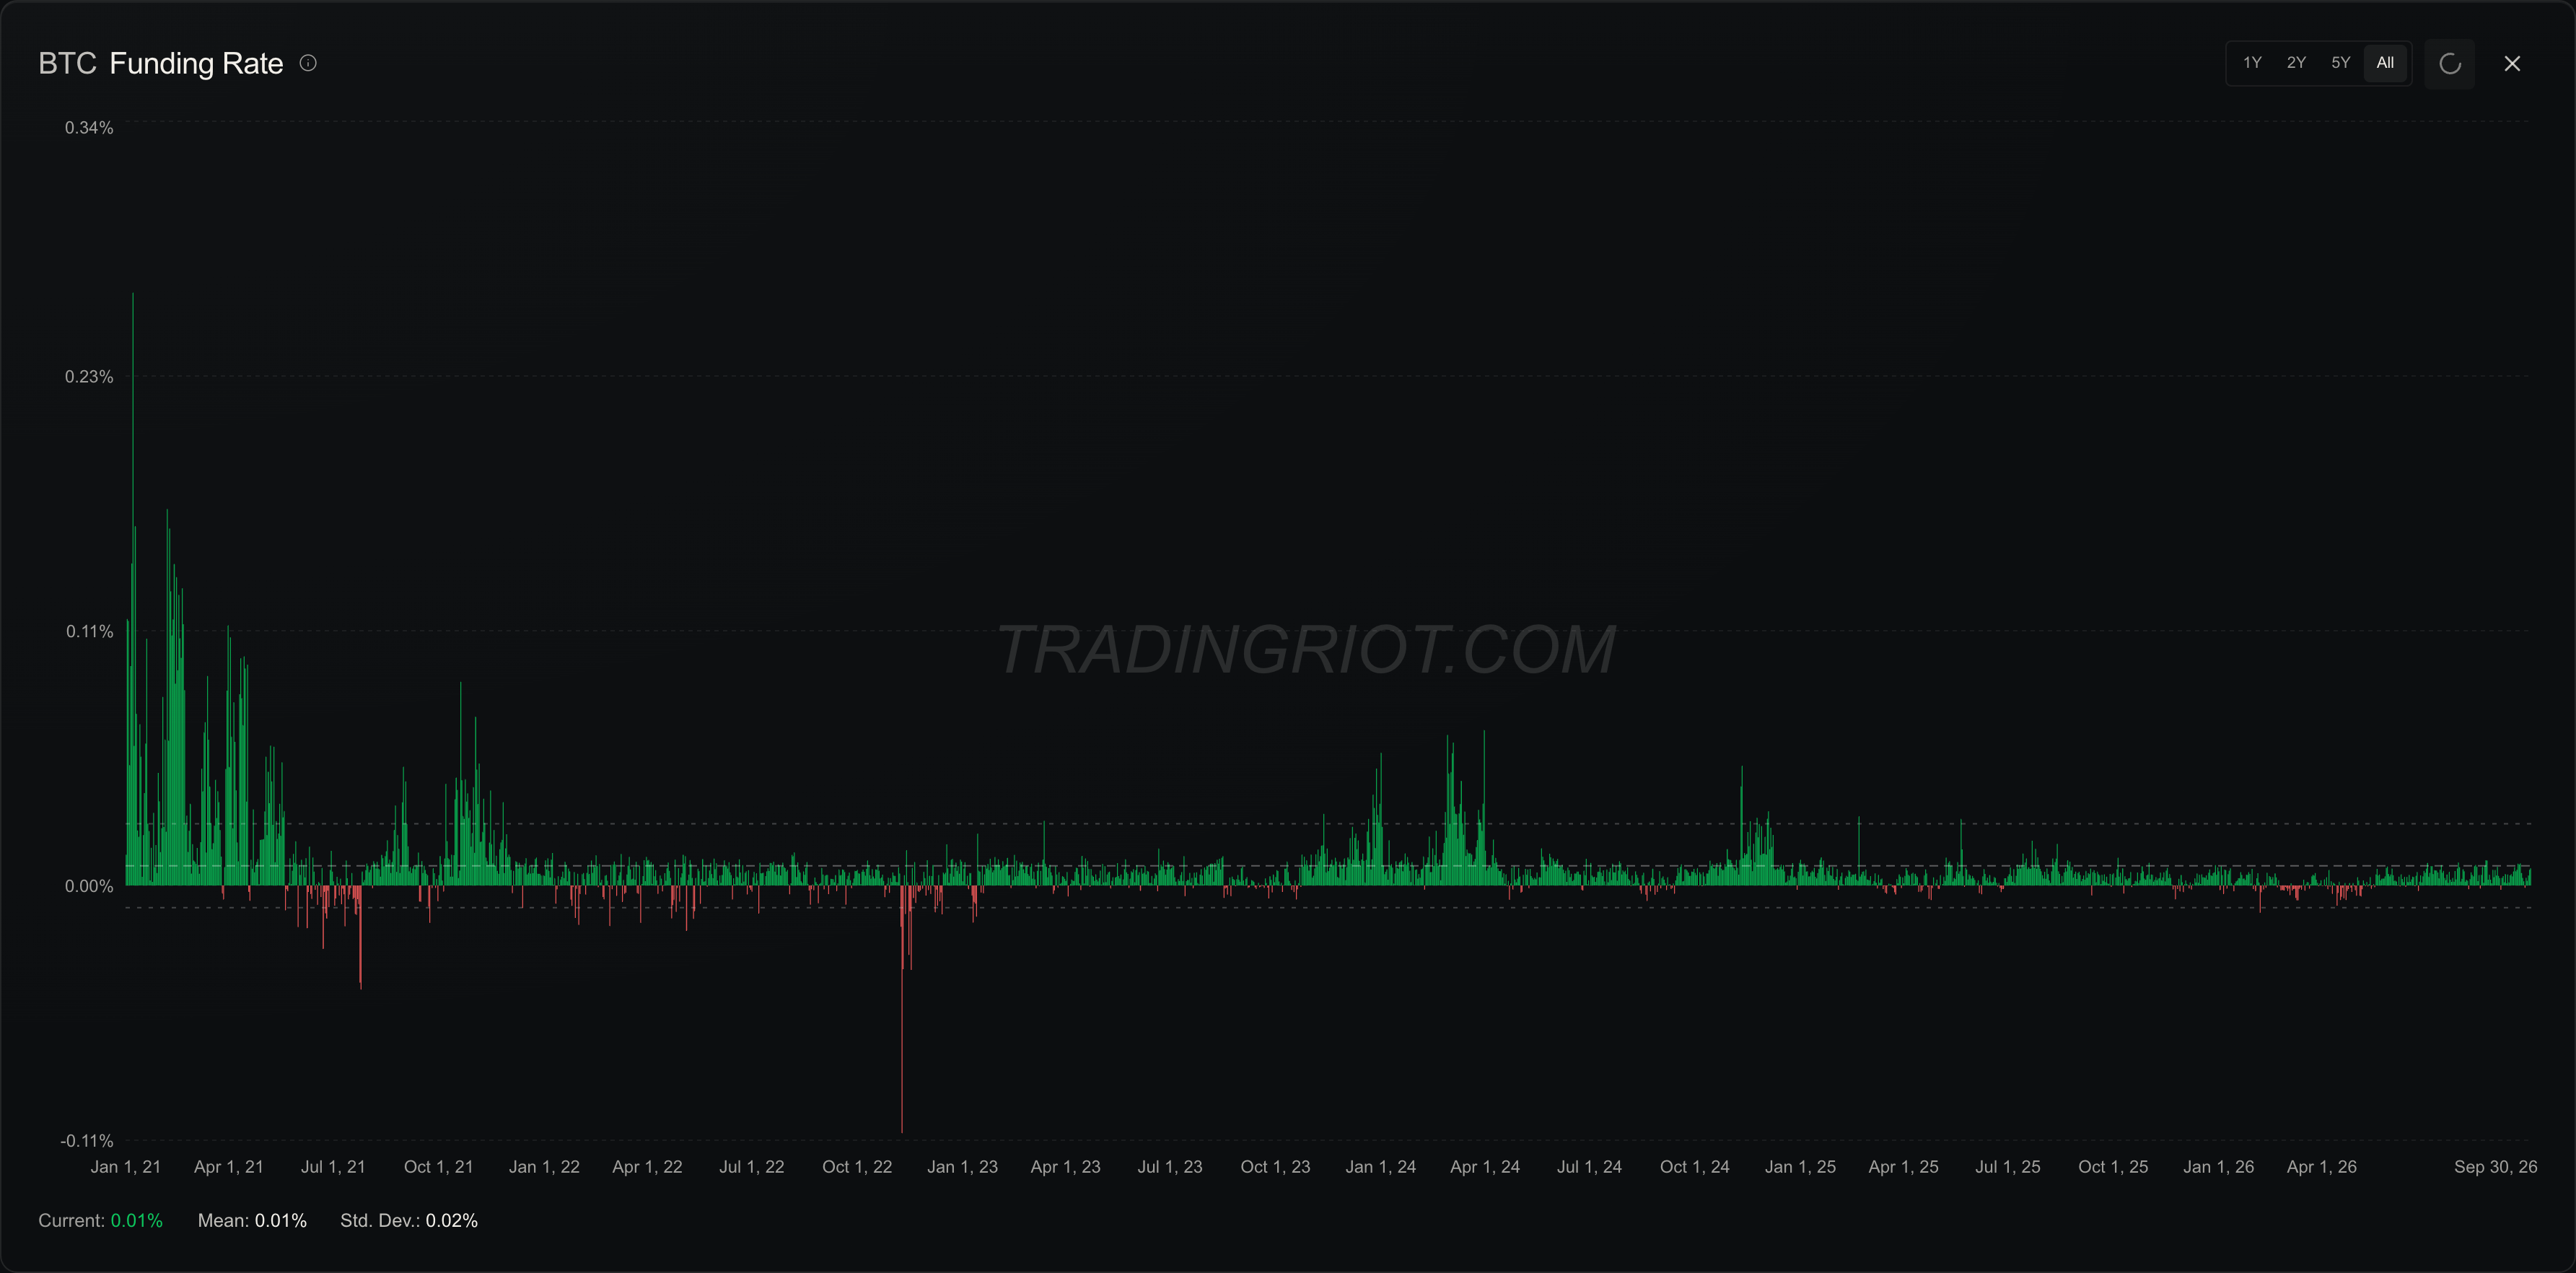
In the majors it compressed a lot over the years as more sophisticated capital arrived. But the huge yields are not fully gone; they are just more risky. To find them, you have to scout less liquid symbols on often shady venues that sit on-chain where you have to constantly stress about the exchange going under. But even for BTC the annualized basis has been around 5-10%, which is higher than any traditional futures assets.
Mean Reversion
When you research risk premium harvesting, mean reversion is not brought up despite having several clear cases when you can get paid to hold risk others are trying to avoid.
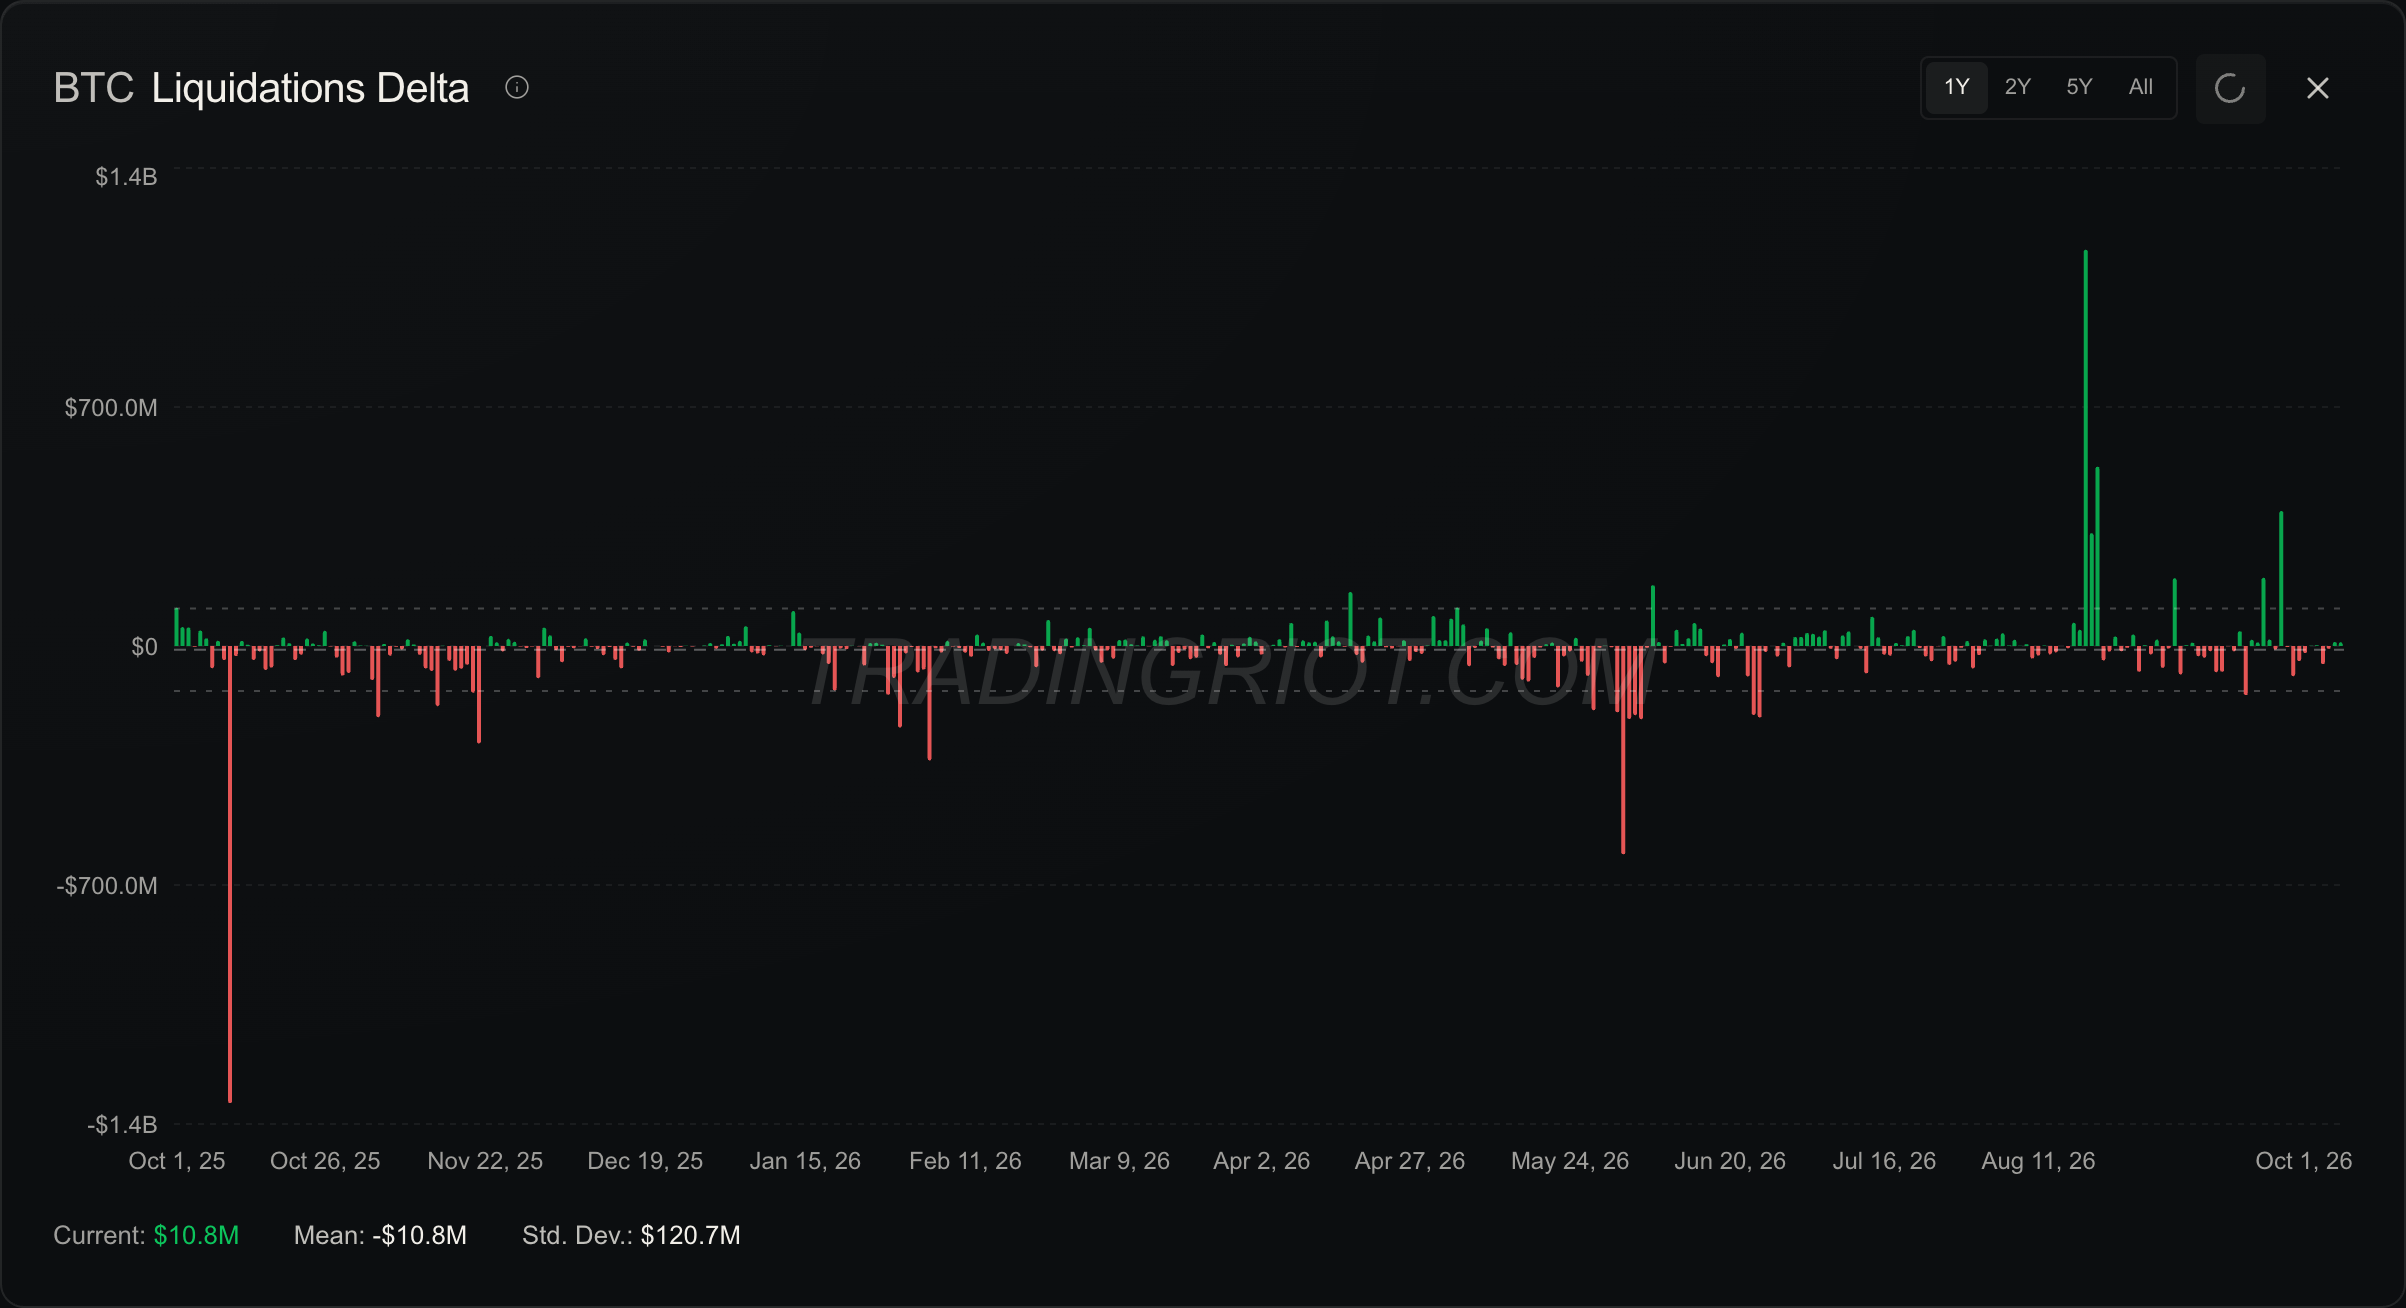
When markets are in stress, they are usually not in stress for very long; liquidation cascades in crypto, deeply backward-dated term structures, and blowouts of spreads tend to revert to the longer to mean.
During these extreme conditions no one really want to to trade se stepping in and providing liquidity in thin markets is harvesting a risk premium, of course the risk here is that you are stepping in too early and markets will remain irrational longer than you can remain solvent.
Building a Systematic Portfolio
When it comes to trading, theory only gets you so far. While there are a lot of different risk premiums you can harvest, I will show you which one I am running and how you can run them as well.
Why would I share this? This portfolio is only one smaller part of strategies I trade, and I felt like it is nice to be able to offer something that actually has systematically backtested results, is simple, and I have run myself for years at this point. Even if you decide not to copy my exact portfolio, use these strategies as a showcase of the concepts I shared in the article.
To access this portfolio, you will have to subscribe on tradingriot.com. After you do that, besides the access to derivatives data for thousands of equities, cryptocurrencies, or futures, you will be able to set up your trading balance inside the systematic cockpit, where you will be automatically prompted to set up the trades based on the strategies. You will also get rebalance notifications inside the private Discord.
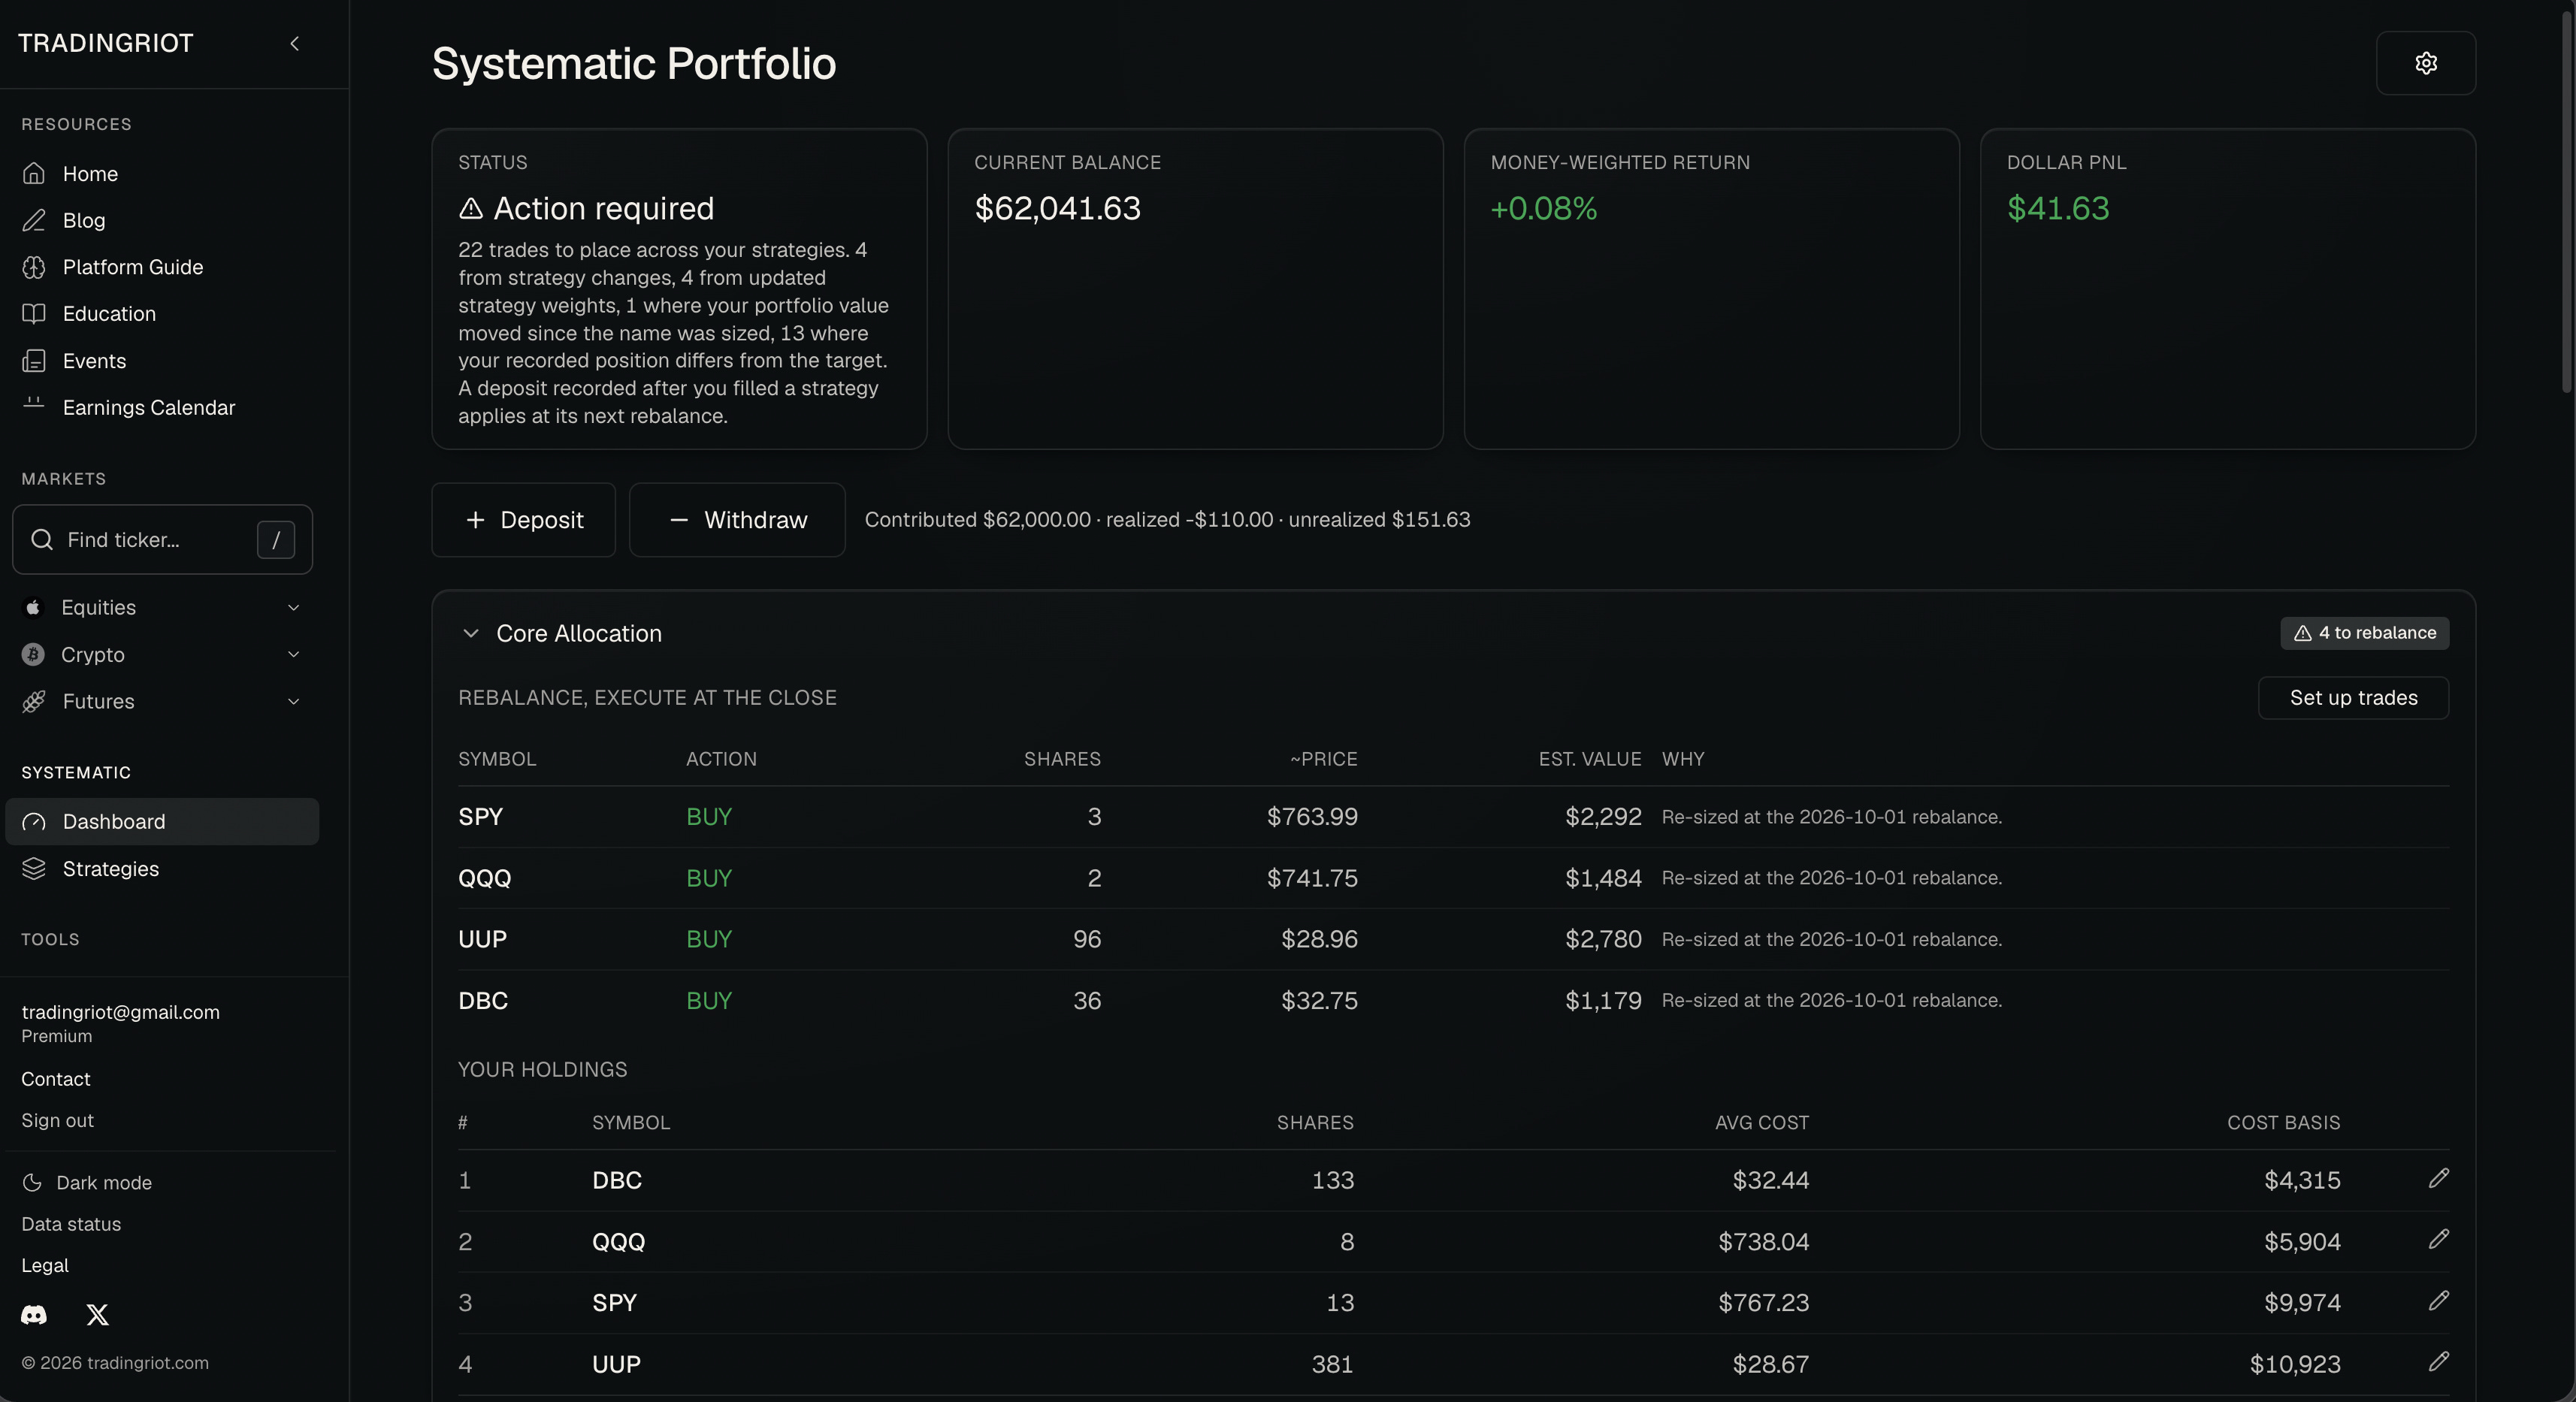
The portfolio is harvesting risk premiums, which were tested over decades and are very likely to stay for more decades to come.
Core Allocation
This can be viewed as sort of a main leg of the portfolio, which works on the simple premise that assets go up over time. While stonks tend to go up the most, during some market cycles commodities go up, the dollar goes up, or bonds go up.
This is why core allocation of the portfolio allocates long-only into main ETFs using a set of trend-following rules. Namely, this “all-weather” portfolio trades ETFs for bonds, commodities, dollars, equities, and gold during different market cycles rebalanced once per week.
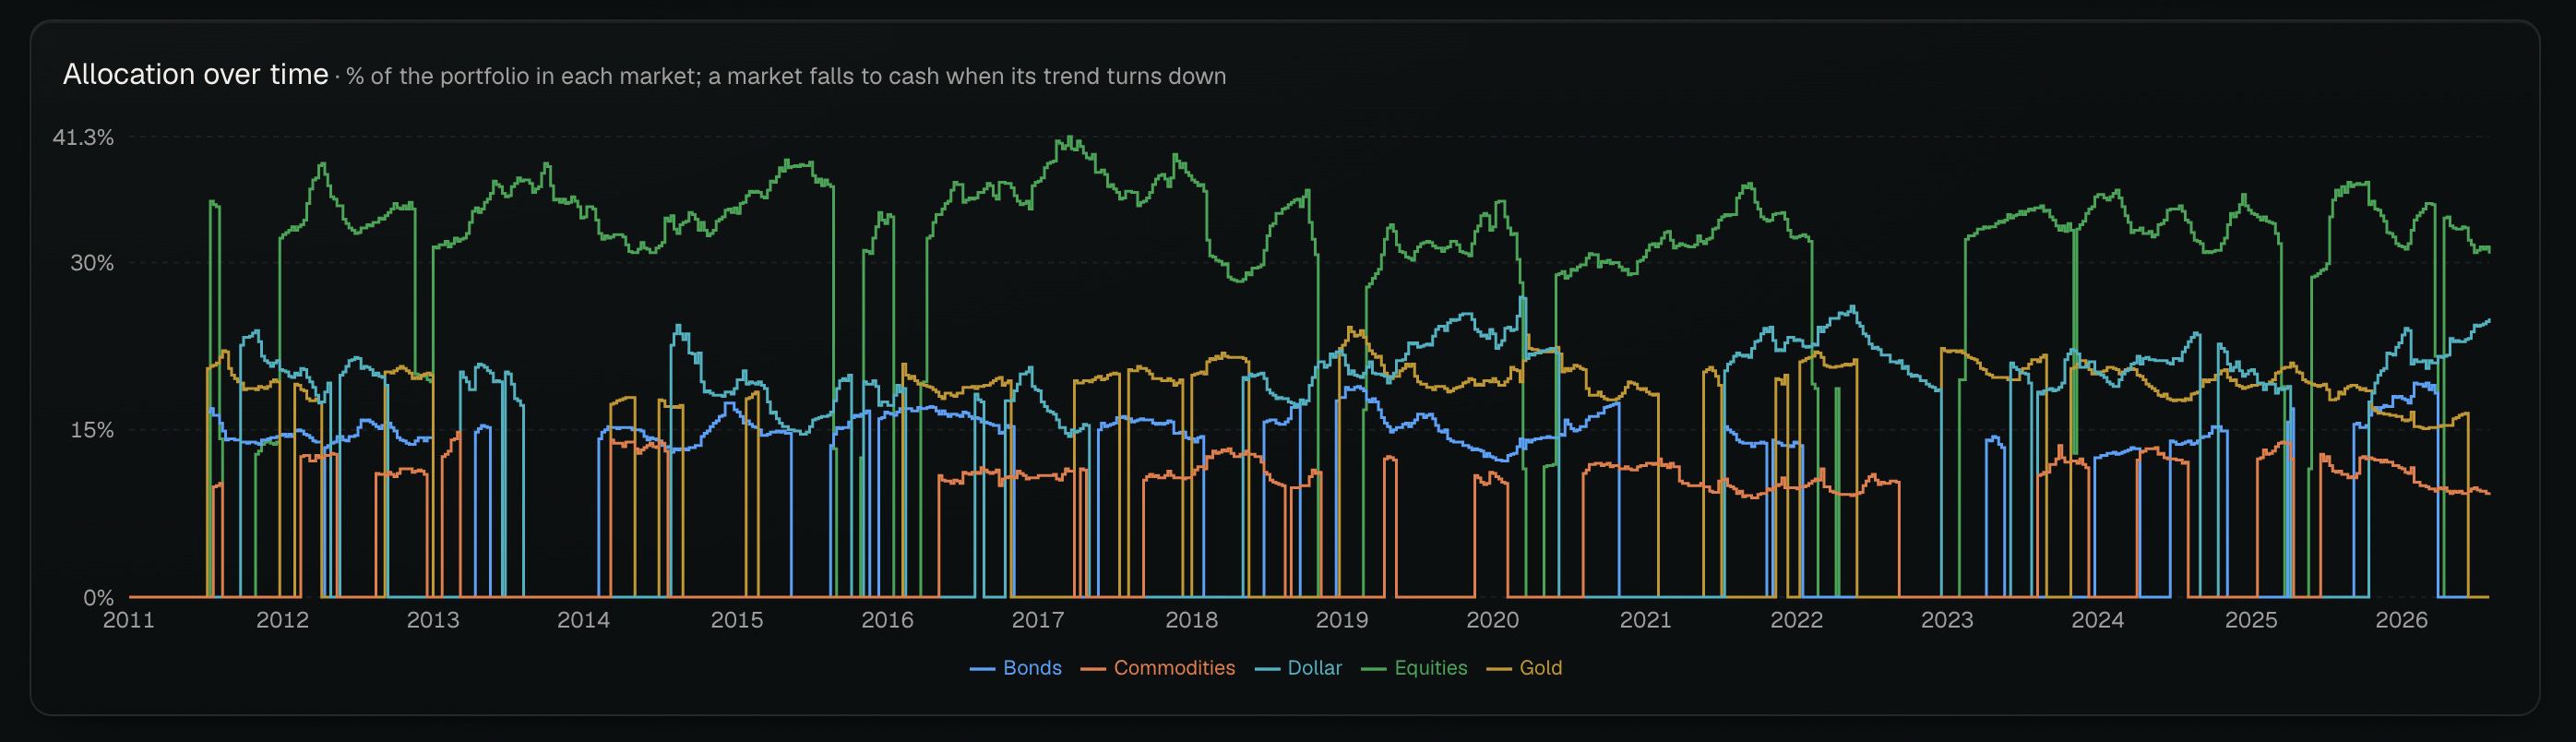
This is nothing too fancy; we are obviously still exposed to the unexpected market crashes, which is the risk we are compensated for, but trend-following rules soften these blows, which has been proven over time.
VIX Term Premium
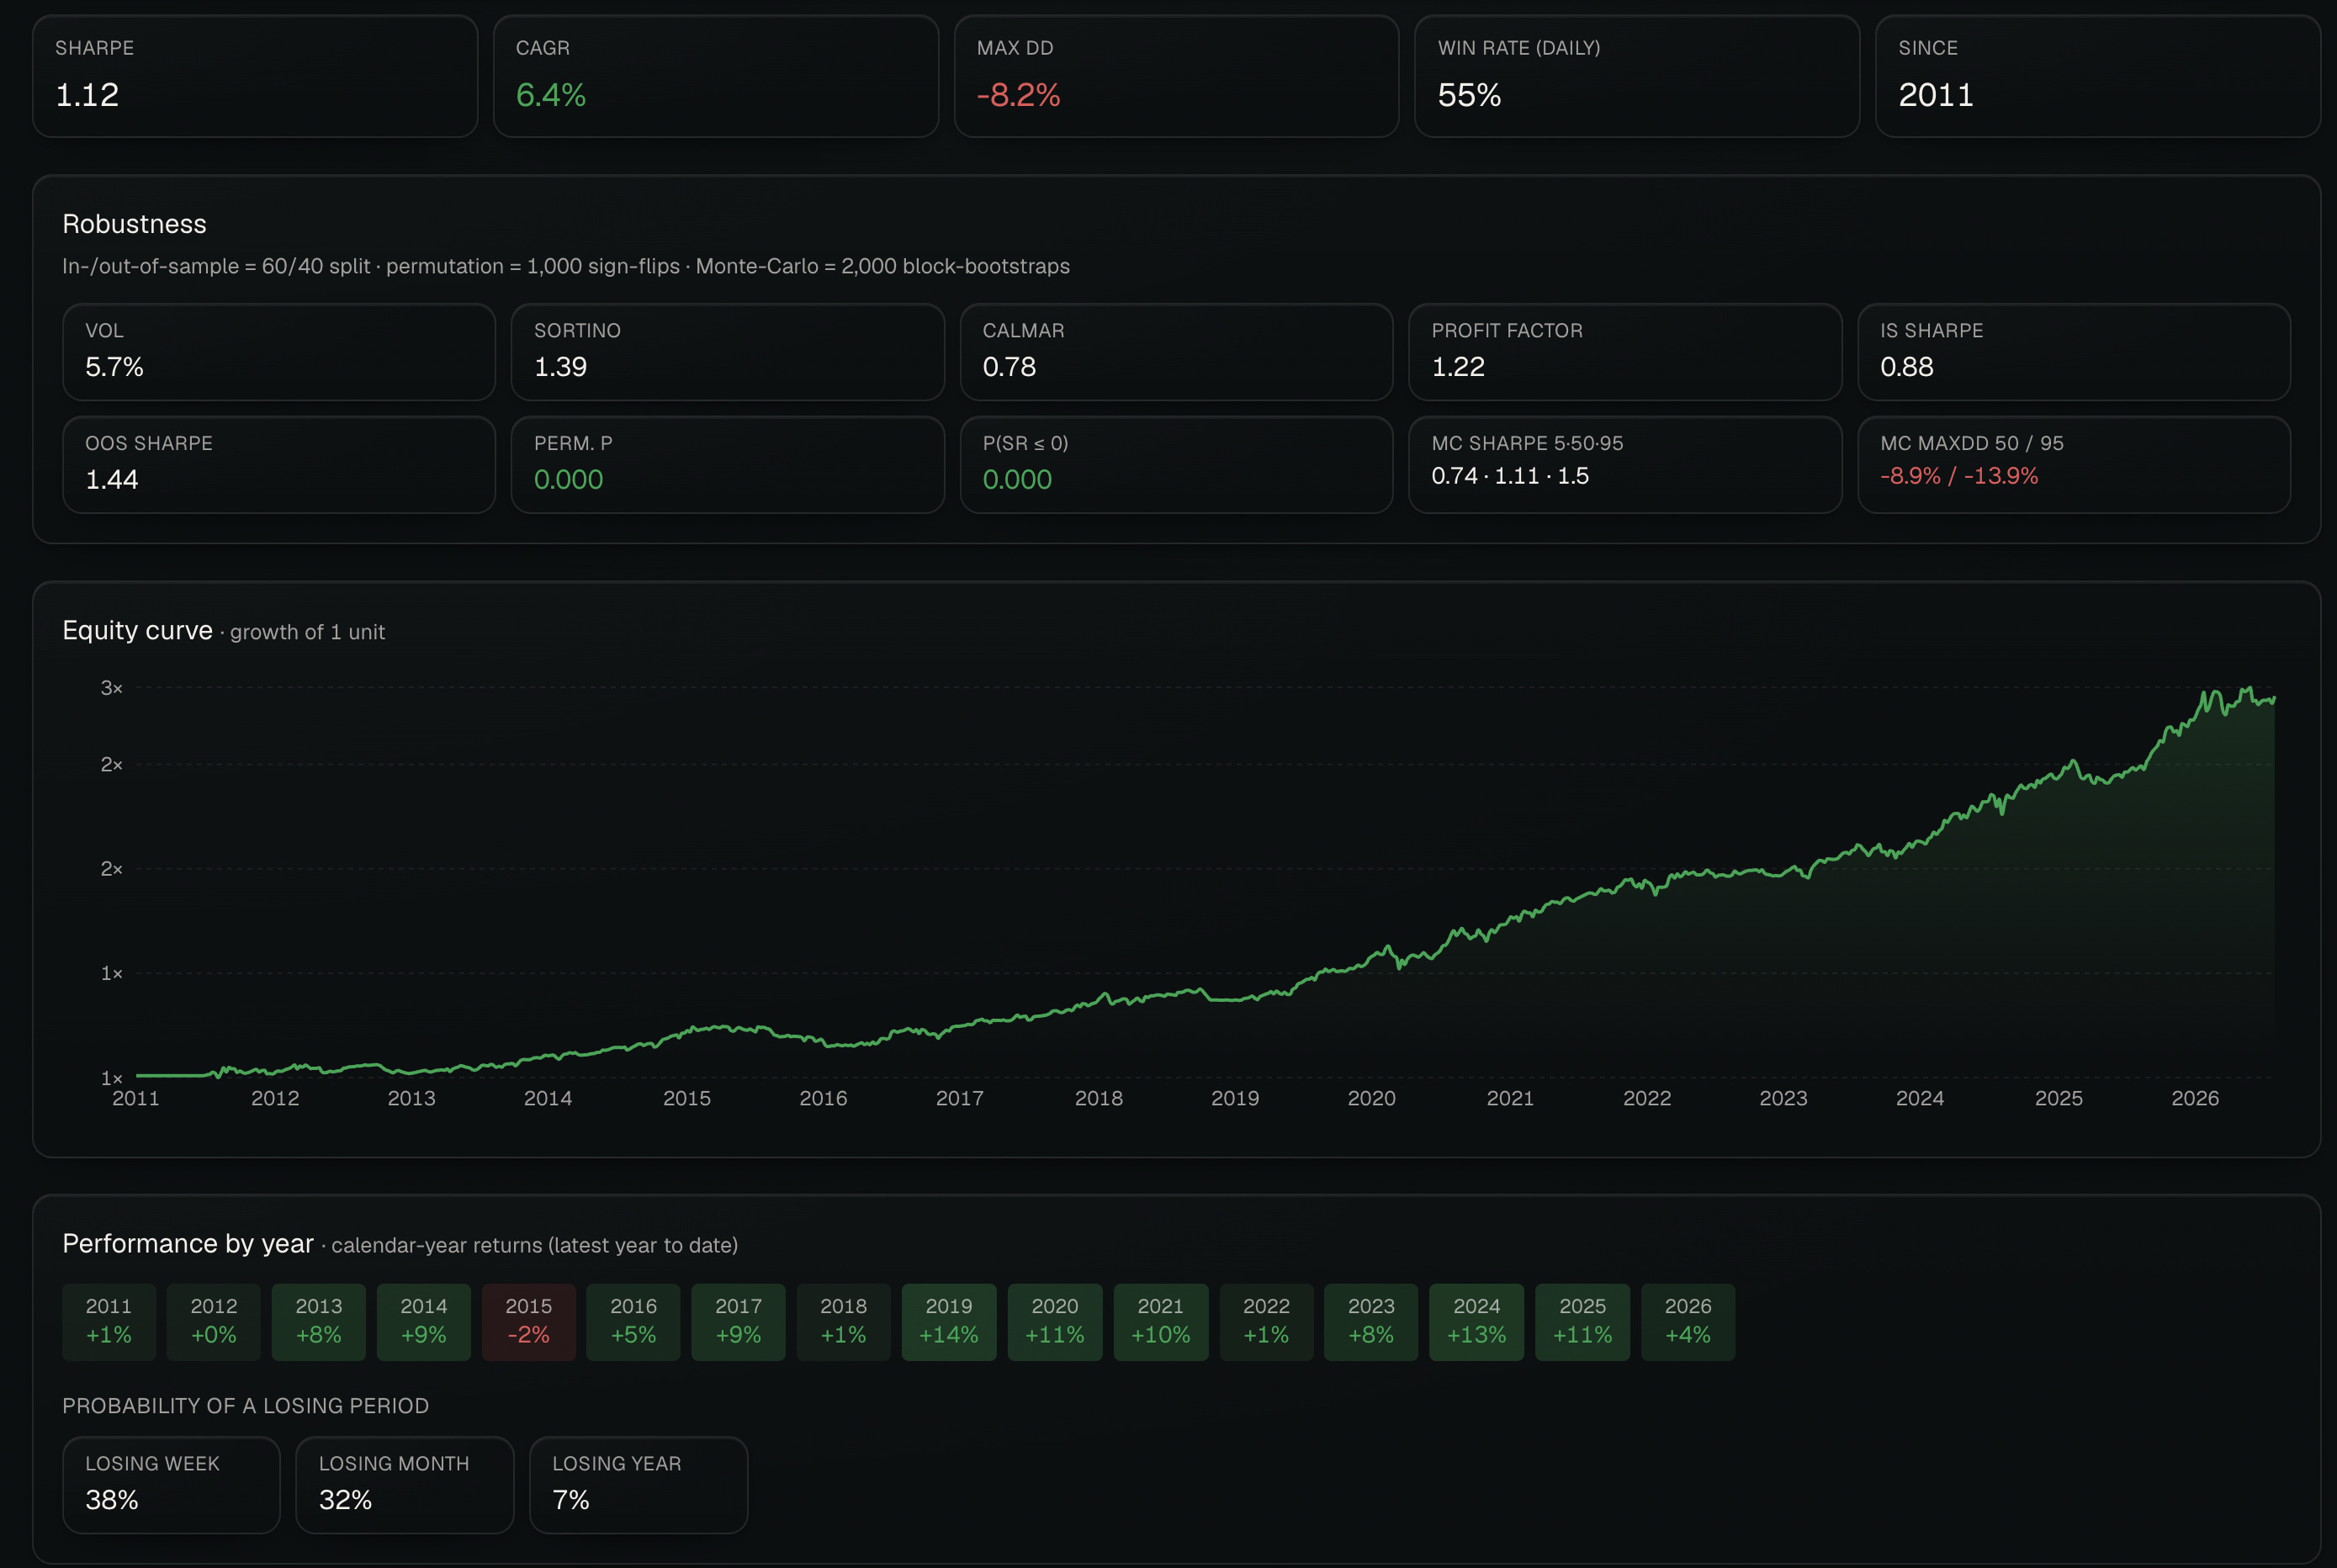
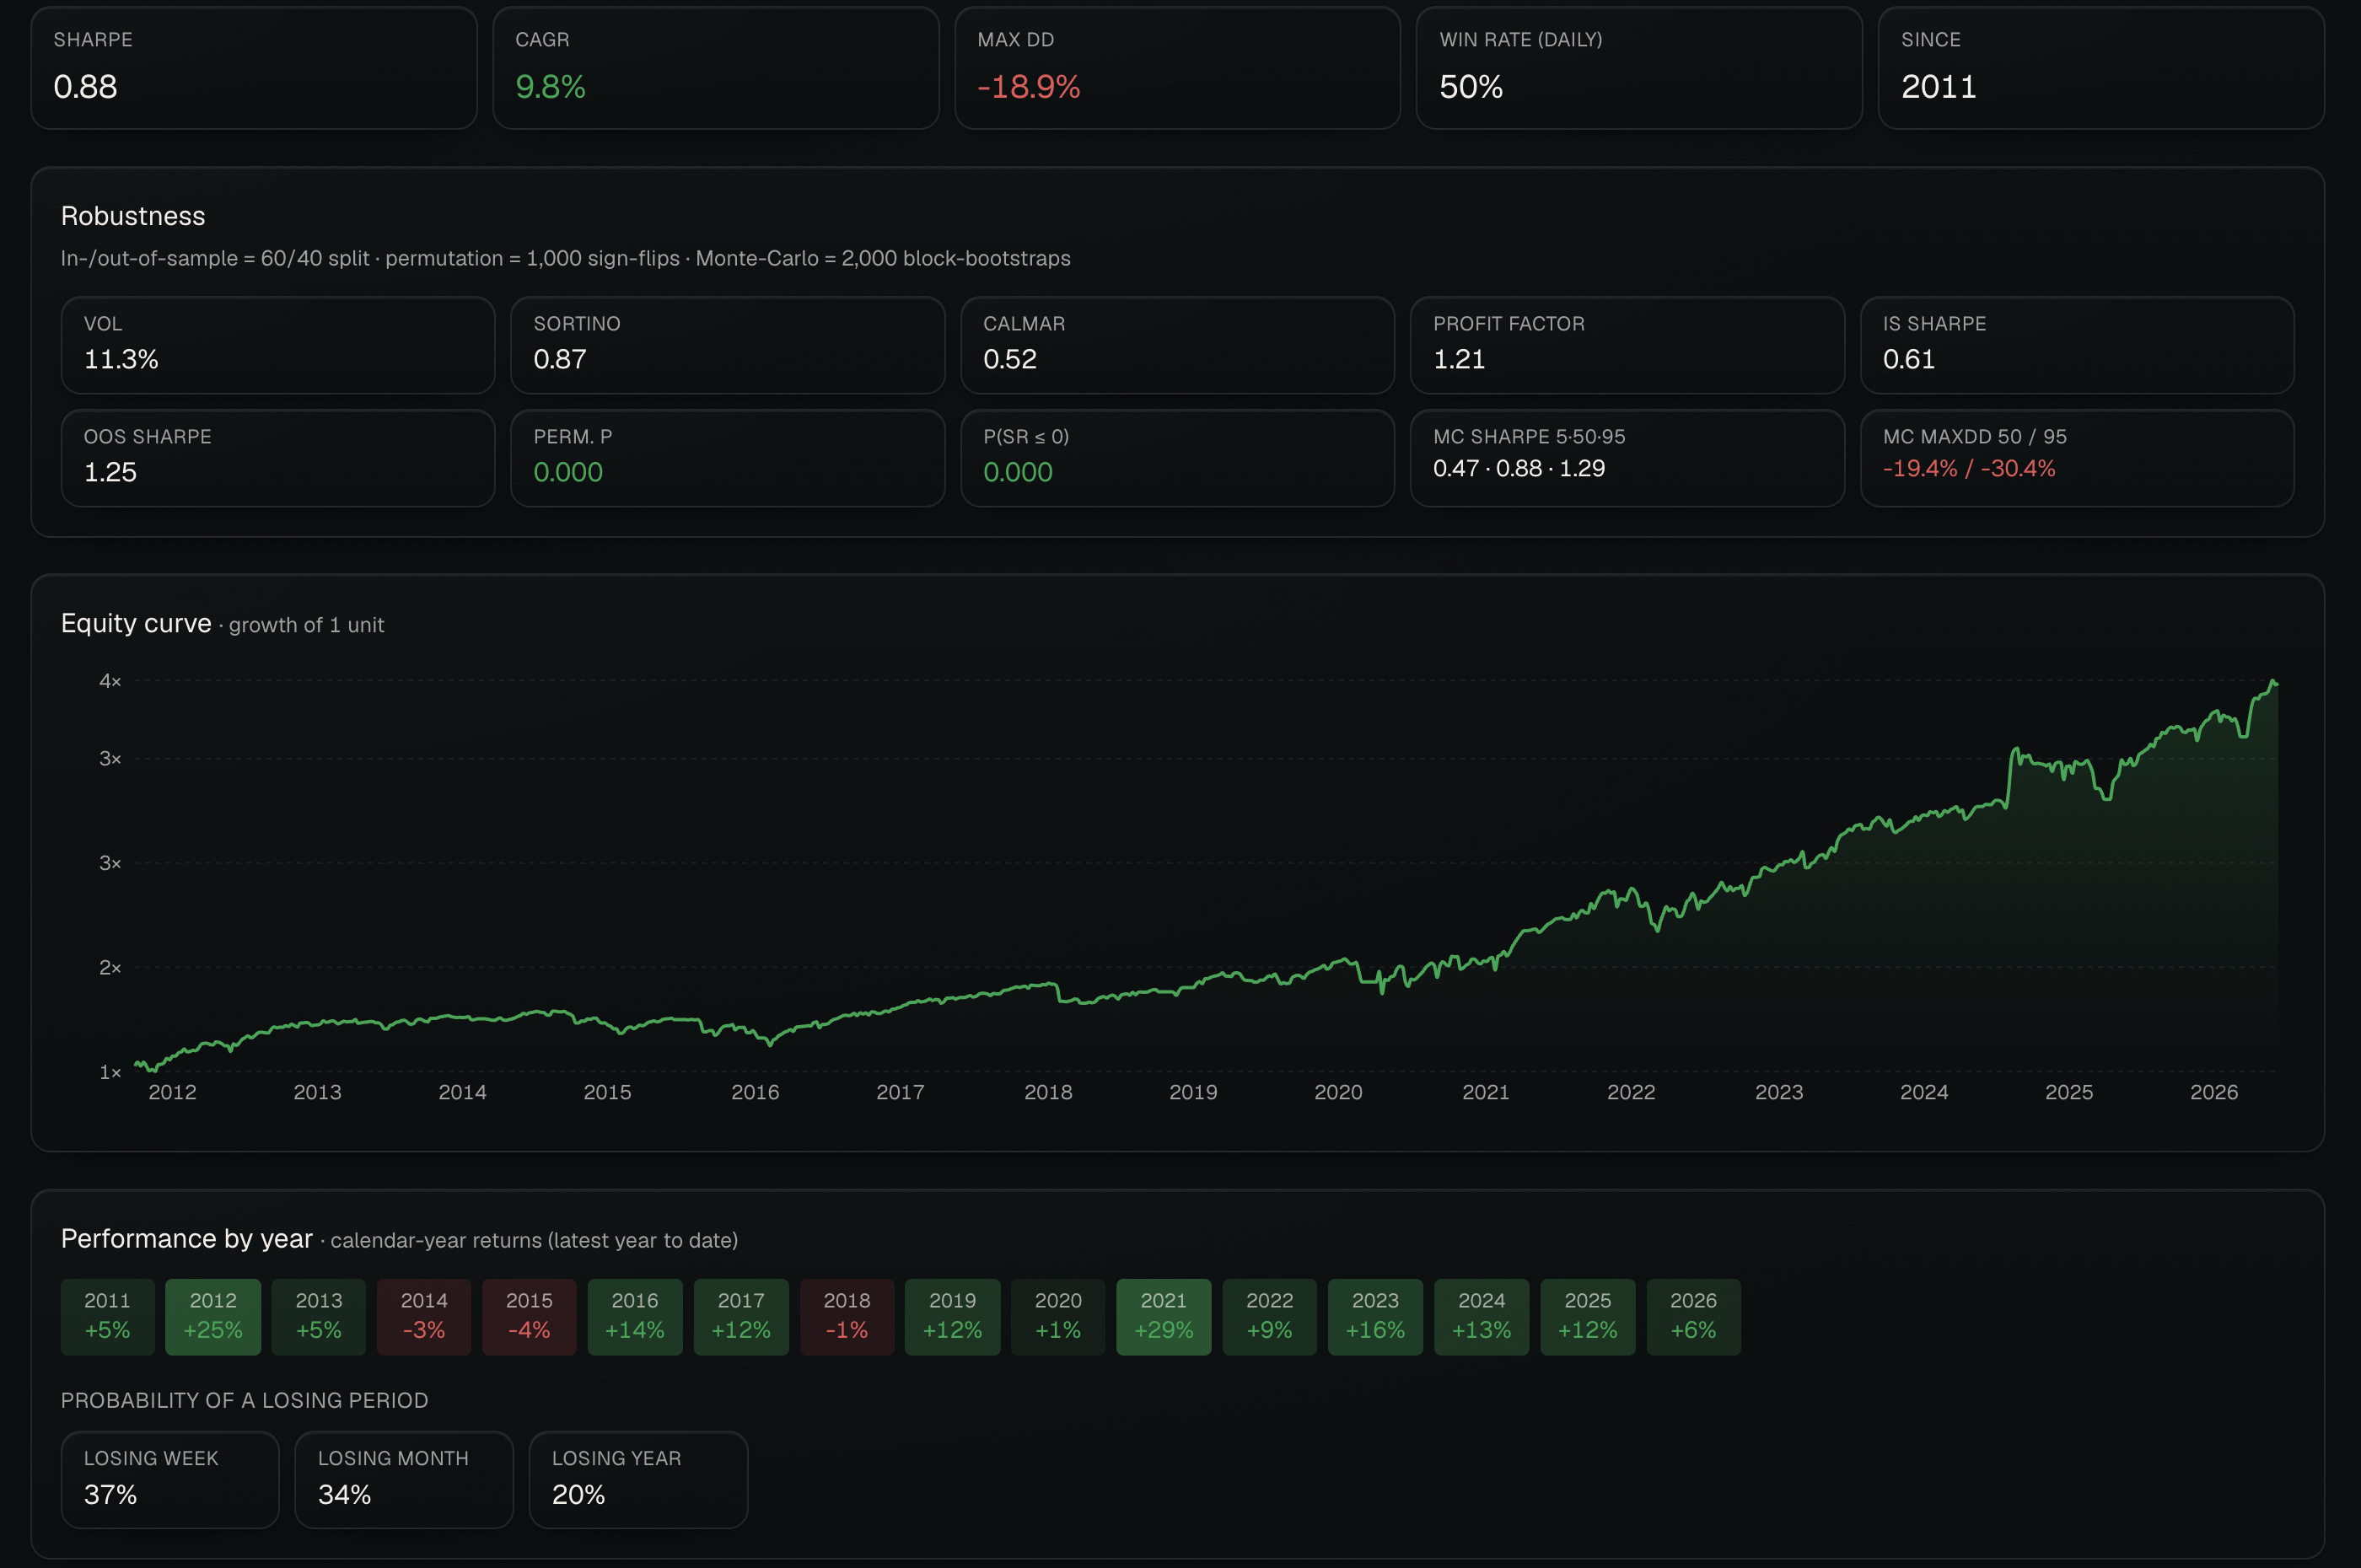
A short-volatility strategy that harvests the term premium embedded in equity hedging demand while the volatility environment stays stable. Because markets tend to go crazy sporadically, strategy tracks the term structure slope and only shorts VIX ETN VXX when markets are in contango and goes flat during backwardation.
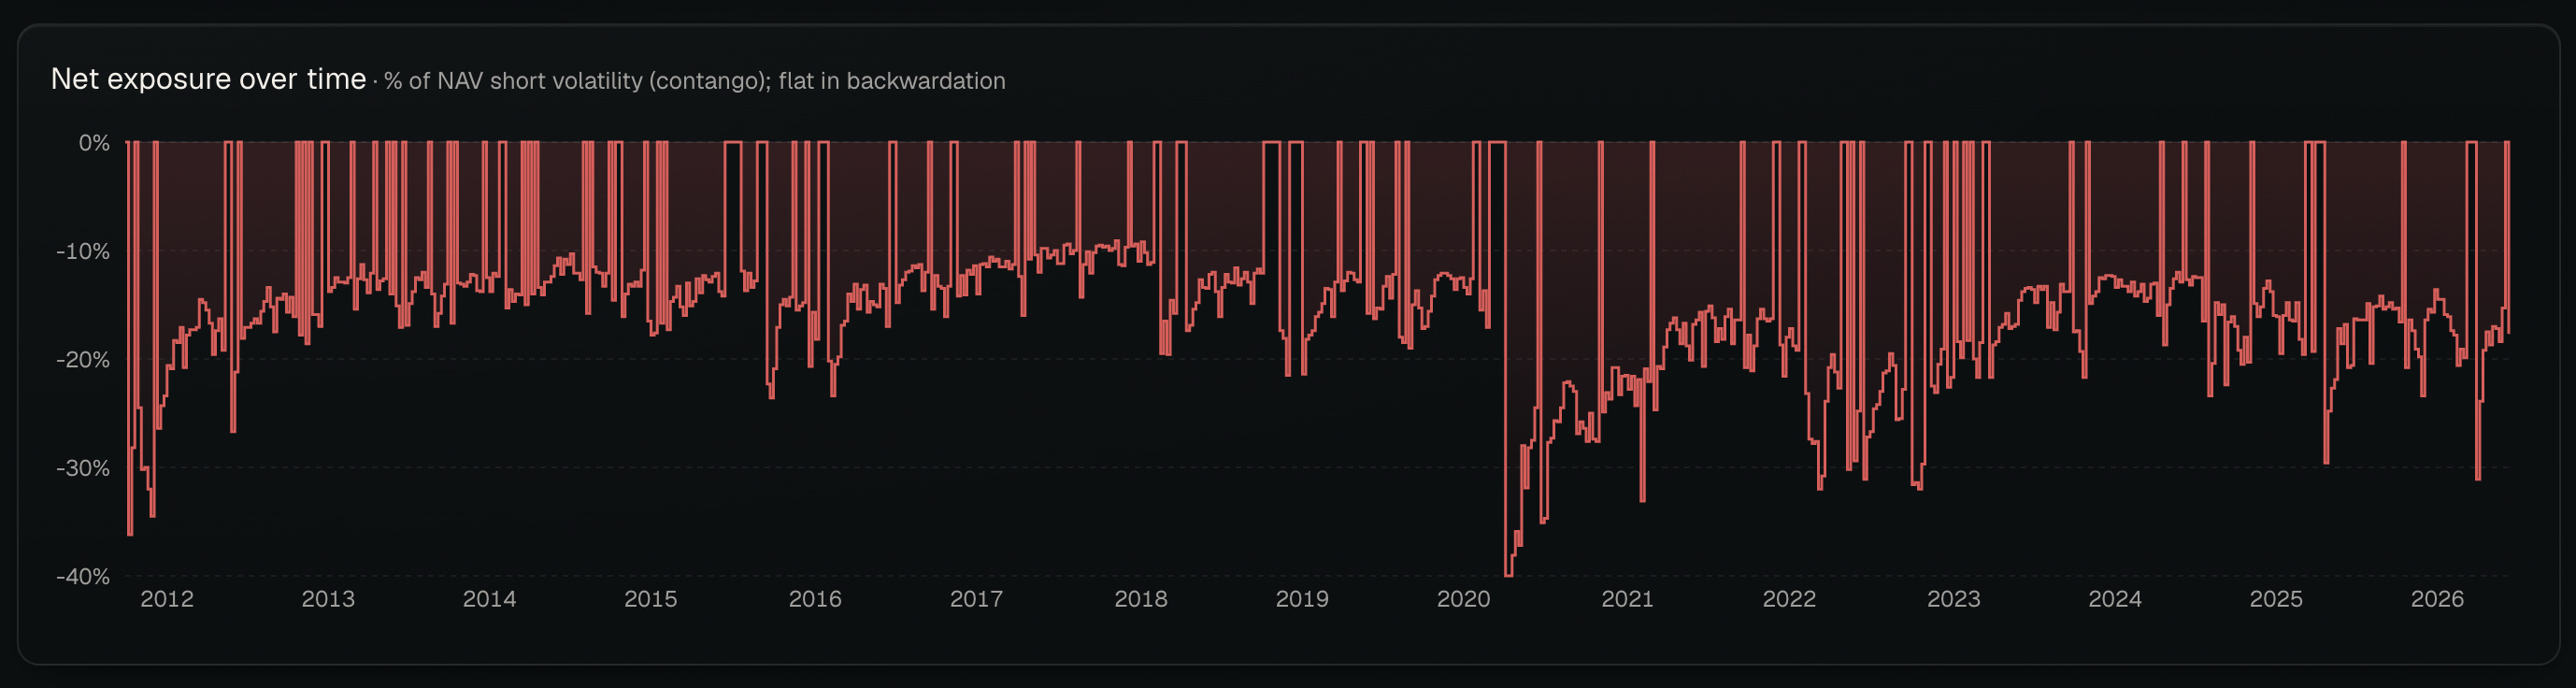
The same as the core allocation strategy rebalances once per week, and it is built to earn steady carry in calm markets while limiting participation in volatility spikes.
Equity momentum
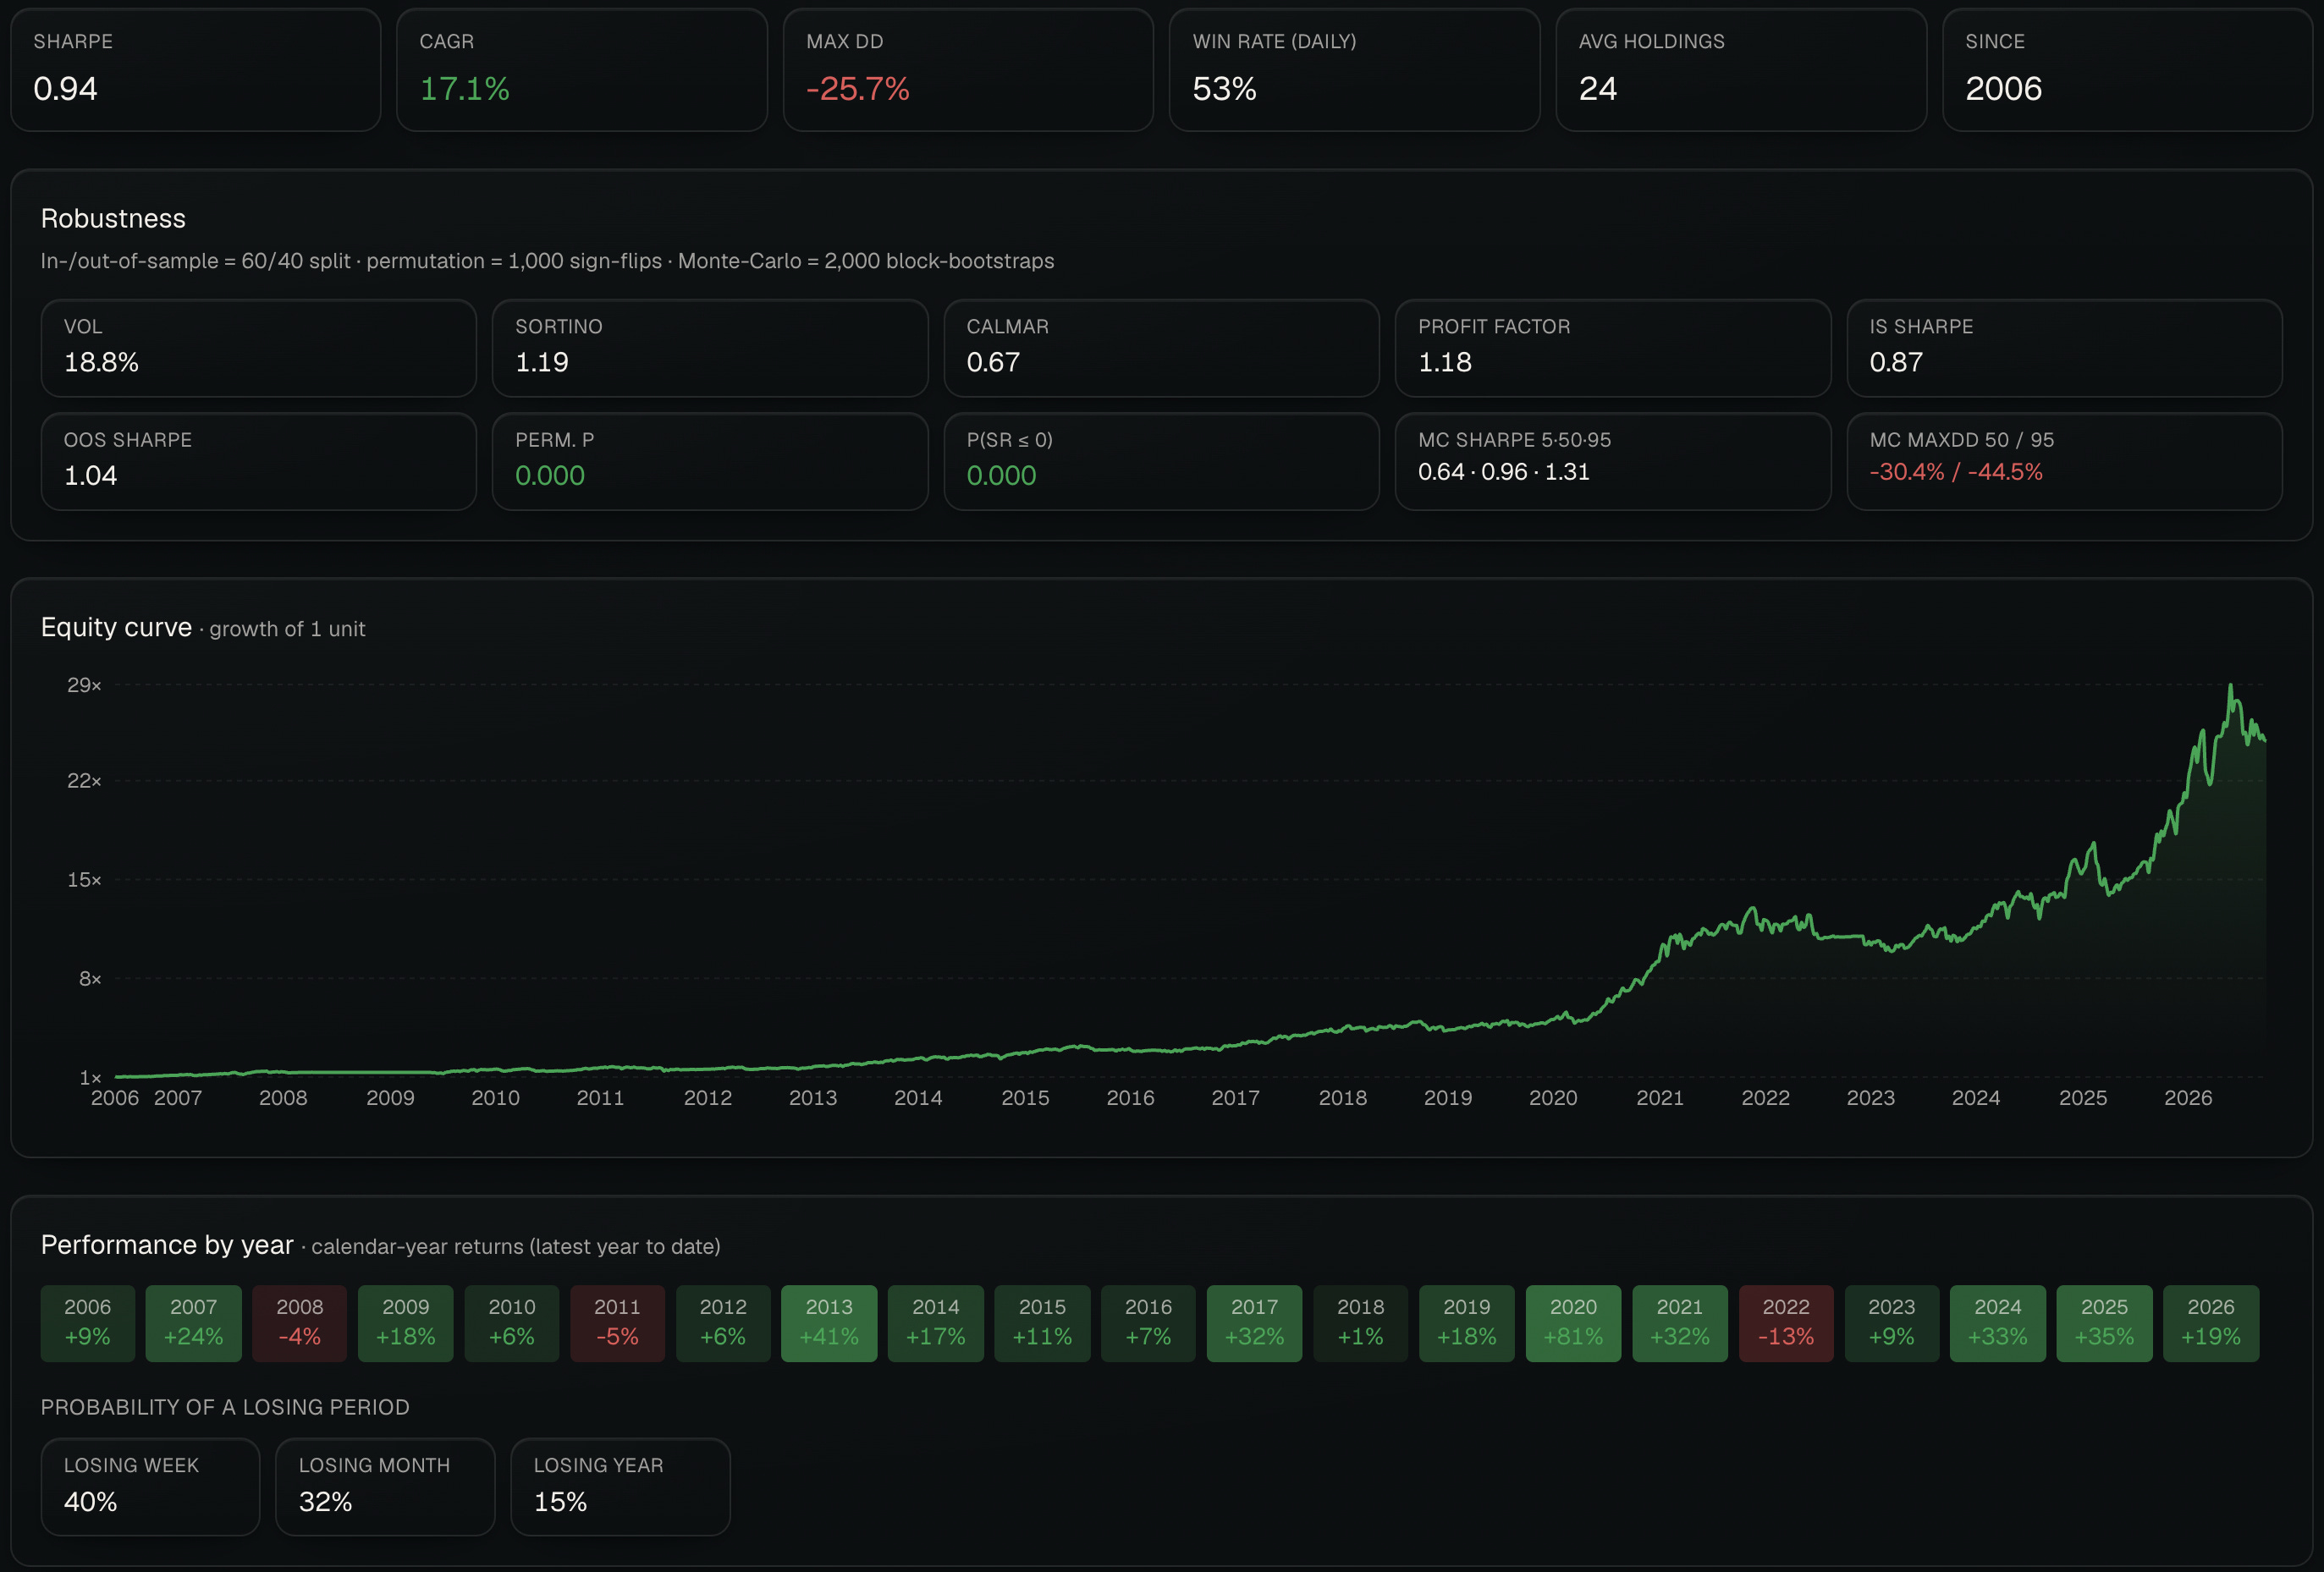
Stonks go up, so I want to own stonks, but I also don’t want to spend 10 hours a day stock picking and trying to find the next best performer. In the momentum section I have spoken about cross-sectional momentum; this strategy is a pretty classic example of one.
It scans the whole stock market once per month using several filters such as liquidity and market cap to find the best performers across the whole stock market; it is also using some trend-following filters to again avoid the massive tail risks.

While VIX and core allocation trade once per week, this only rebalances once per month, so there is really not much you need to do here. Below you will find the strategy performance since 2006, which was tested on survivorship bias-free data.
SPX Tactical Long / Short
The last strategy in the portfolio is mean reversion; it shorts SPX during the extreme complacency and longs during the panic. To get these signals, it is using the data from credit markets, VIX term structure slope, and overall market breadth.
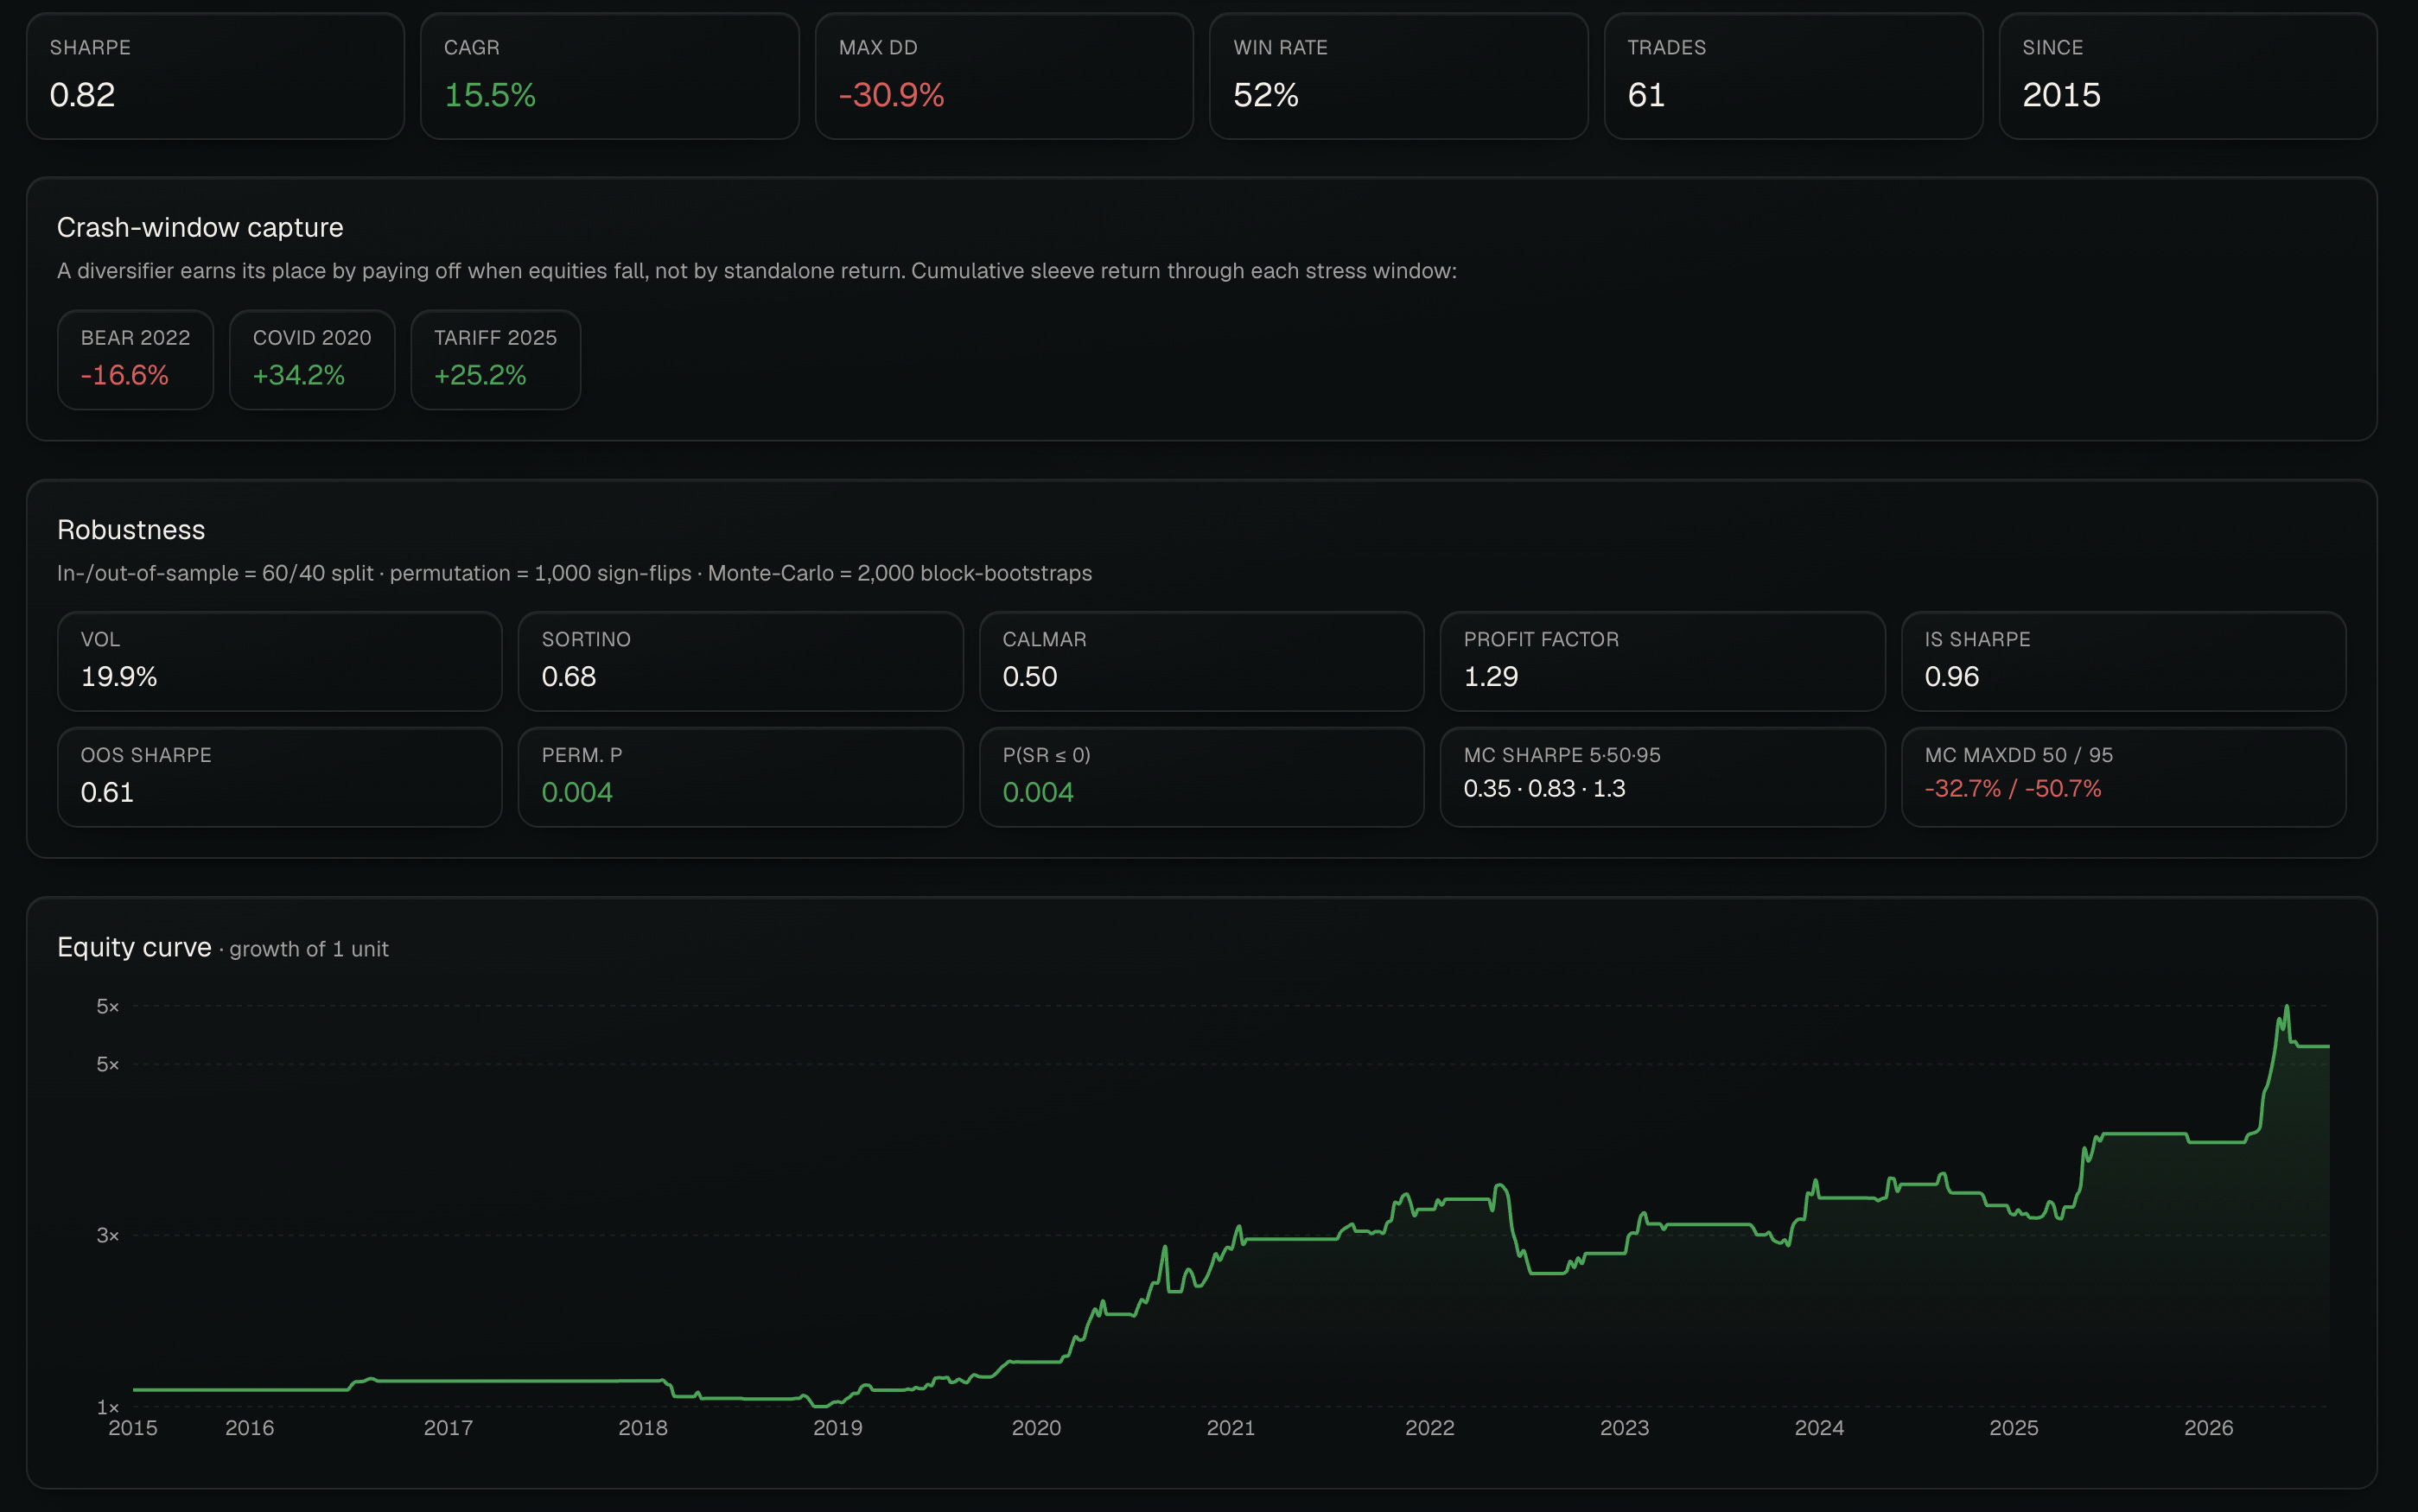
The strategy does not trade much; the signals trigger every few months or so, but historically this has worked very well, especially on the long side where you are the other side of forced selling, with again filters in place so you are not turned into forced sellers just a few days after if the reversion does not happen.
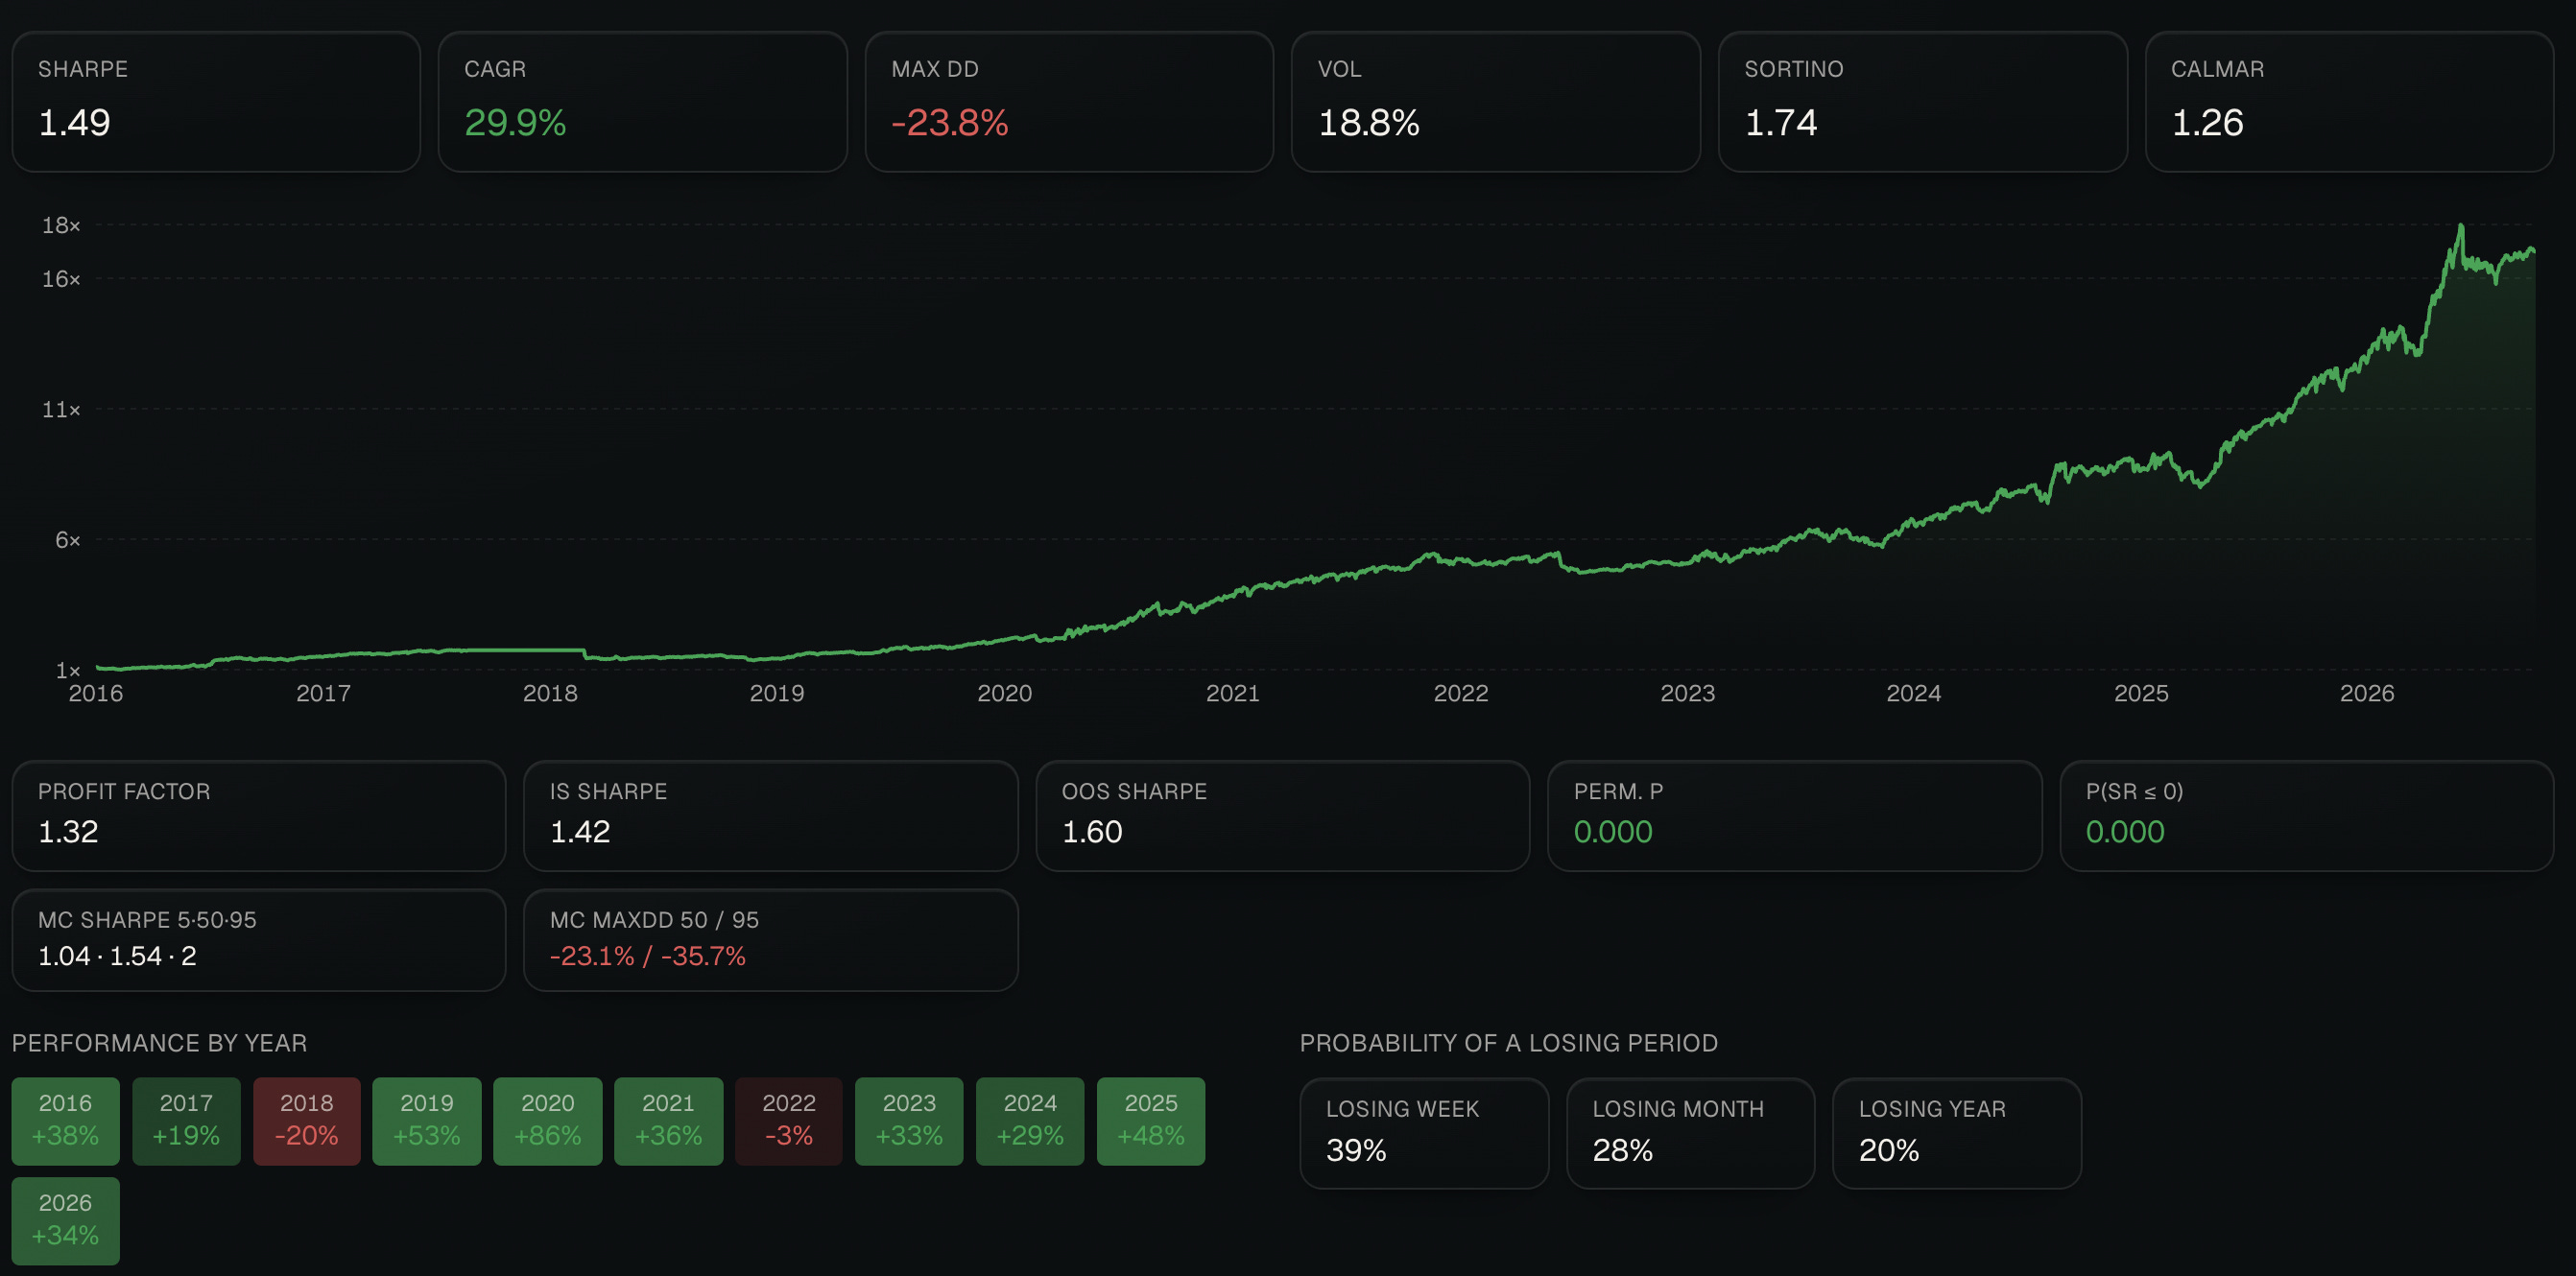
These four strategies put together achieved about a 1.5 Sharpe ratio over the last decade with a 30% compound annual growth rate and a 24% maximum drawdown targeted at 20% volatility.
Conclusion
Risk premium harvesting is nothing fancy; you are not going to make millions overnight. But in my opinion these strategies should be a backbone of every robust portfolio since they are benefiting from profit mechanisms that were documented over many decades and are consistently persistent in the market.
You are getting paid because you are doing something useful (for once); it ain’t much but it’s honest work.
Wonderful introduction to some of the risk premia and inefficiencies found in the market. There are so many more that can be found in niche areas and markets, but the scalability differs. Some will work for smaller (institutional or retail) investors that are too small for bigger institutions
Fama's EMH rests on certain assumptions about how returns from share and commodity markets are distributed. They were assumed to be distributed 'normally' despite Mandelbrot showing returns are distributed according to a Power law. That may sound a bit esoteric, but it's actually pretty important because normal distributions' volatility can be captured by the standard deviation - a Power law's volatility is without bound (risk is infinite).
Here's a good read that explains it - but (Mis)Behaviour of Markets does too.
https://acrobat.adobe.com/id/urn:aaid:sc:AP:88b8a15f-1272-4531-9011-af7fe0e724cd