
Volatility Trading Around Earnings
How to trade implied earnings volatility

Earnings announcements are the single most important recurring event for any stock. Four times a year, a company steps up and tells the market whether it got things right or wrong.
Price action always differs, and there’s a separate phenomenon called PEAD (Post-Earnings Announcement Drift) that falls outside the scope of this article. But what stays almost constant is the massive repricing of options.
This article covers three distinct approaches to trading around these events.
First, we look at why earnings matter so much and how they dominate stock price movement throughout the year. Then we get into trading volatility at the earnings event itself. Finally, we explore the weeks before earnings, where implied volatility ramps up in ways that create opportunities for both buyers and sellers.
Each approach has real edge and real ways to blow up if you don’t respect the risks.
All analytics in this article are powered by TradingRiot Analytics. Sign up to access data for 1,000+ futures, crypto, stocks, and ETFs, plus education on turning data into strategies. You can use code “ANALYTICS“ to get 50% off your first month.
Why Earnings Dominate Stock Price Movement
Stocks move every day. Usually up a small amount, sometimes down a lot. But a disproportionate share of a stock’s annual volatility gets concentrated into just a handful of days: the earnings announcements.
On any random day, a stock might drift 0.5% on no news. On earnings day, that same stock gaps 8% before the market even opens. These events compress months of uncertainty into a single overnight repricing.
Stocks scheduled to report earnings historically earned an annualized abnormal return of roughly 9.9% just from holding through their announcement windows. More recent research suggests this premium has shrunk as companies now disclose material events more frequently throughout the year. But the core point holds: earnings days produce outsized moves, and that volatility gets priced into options.
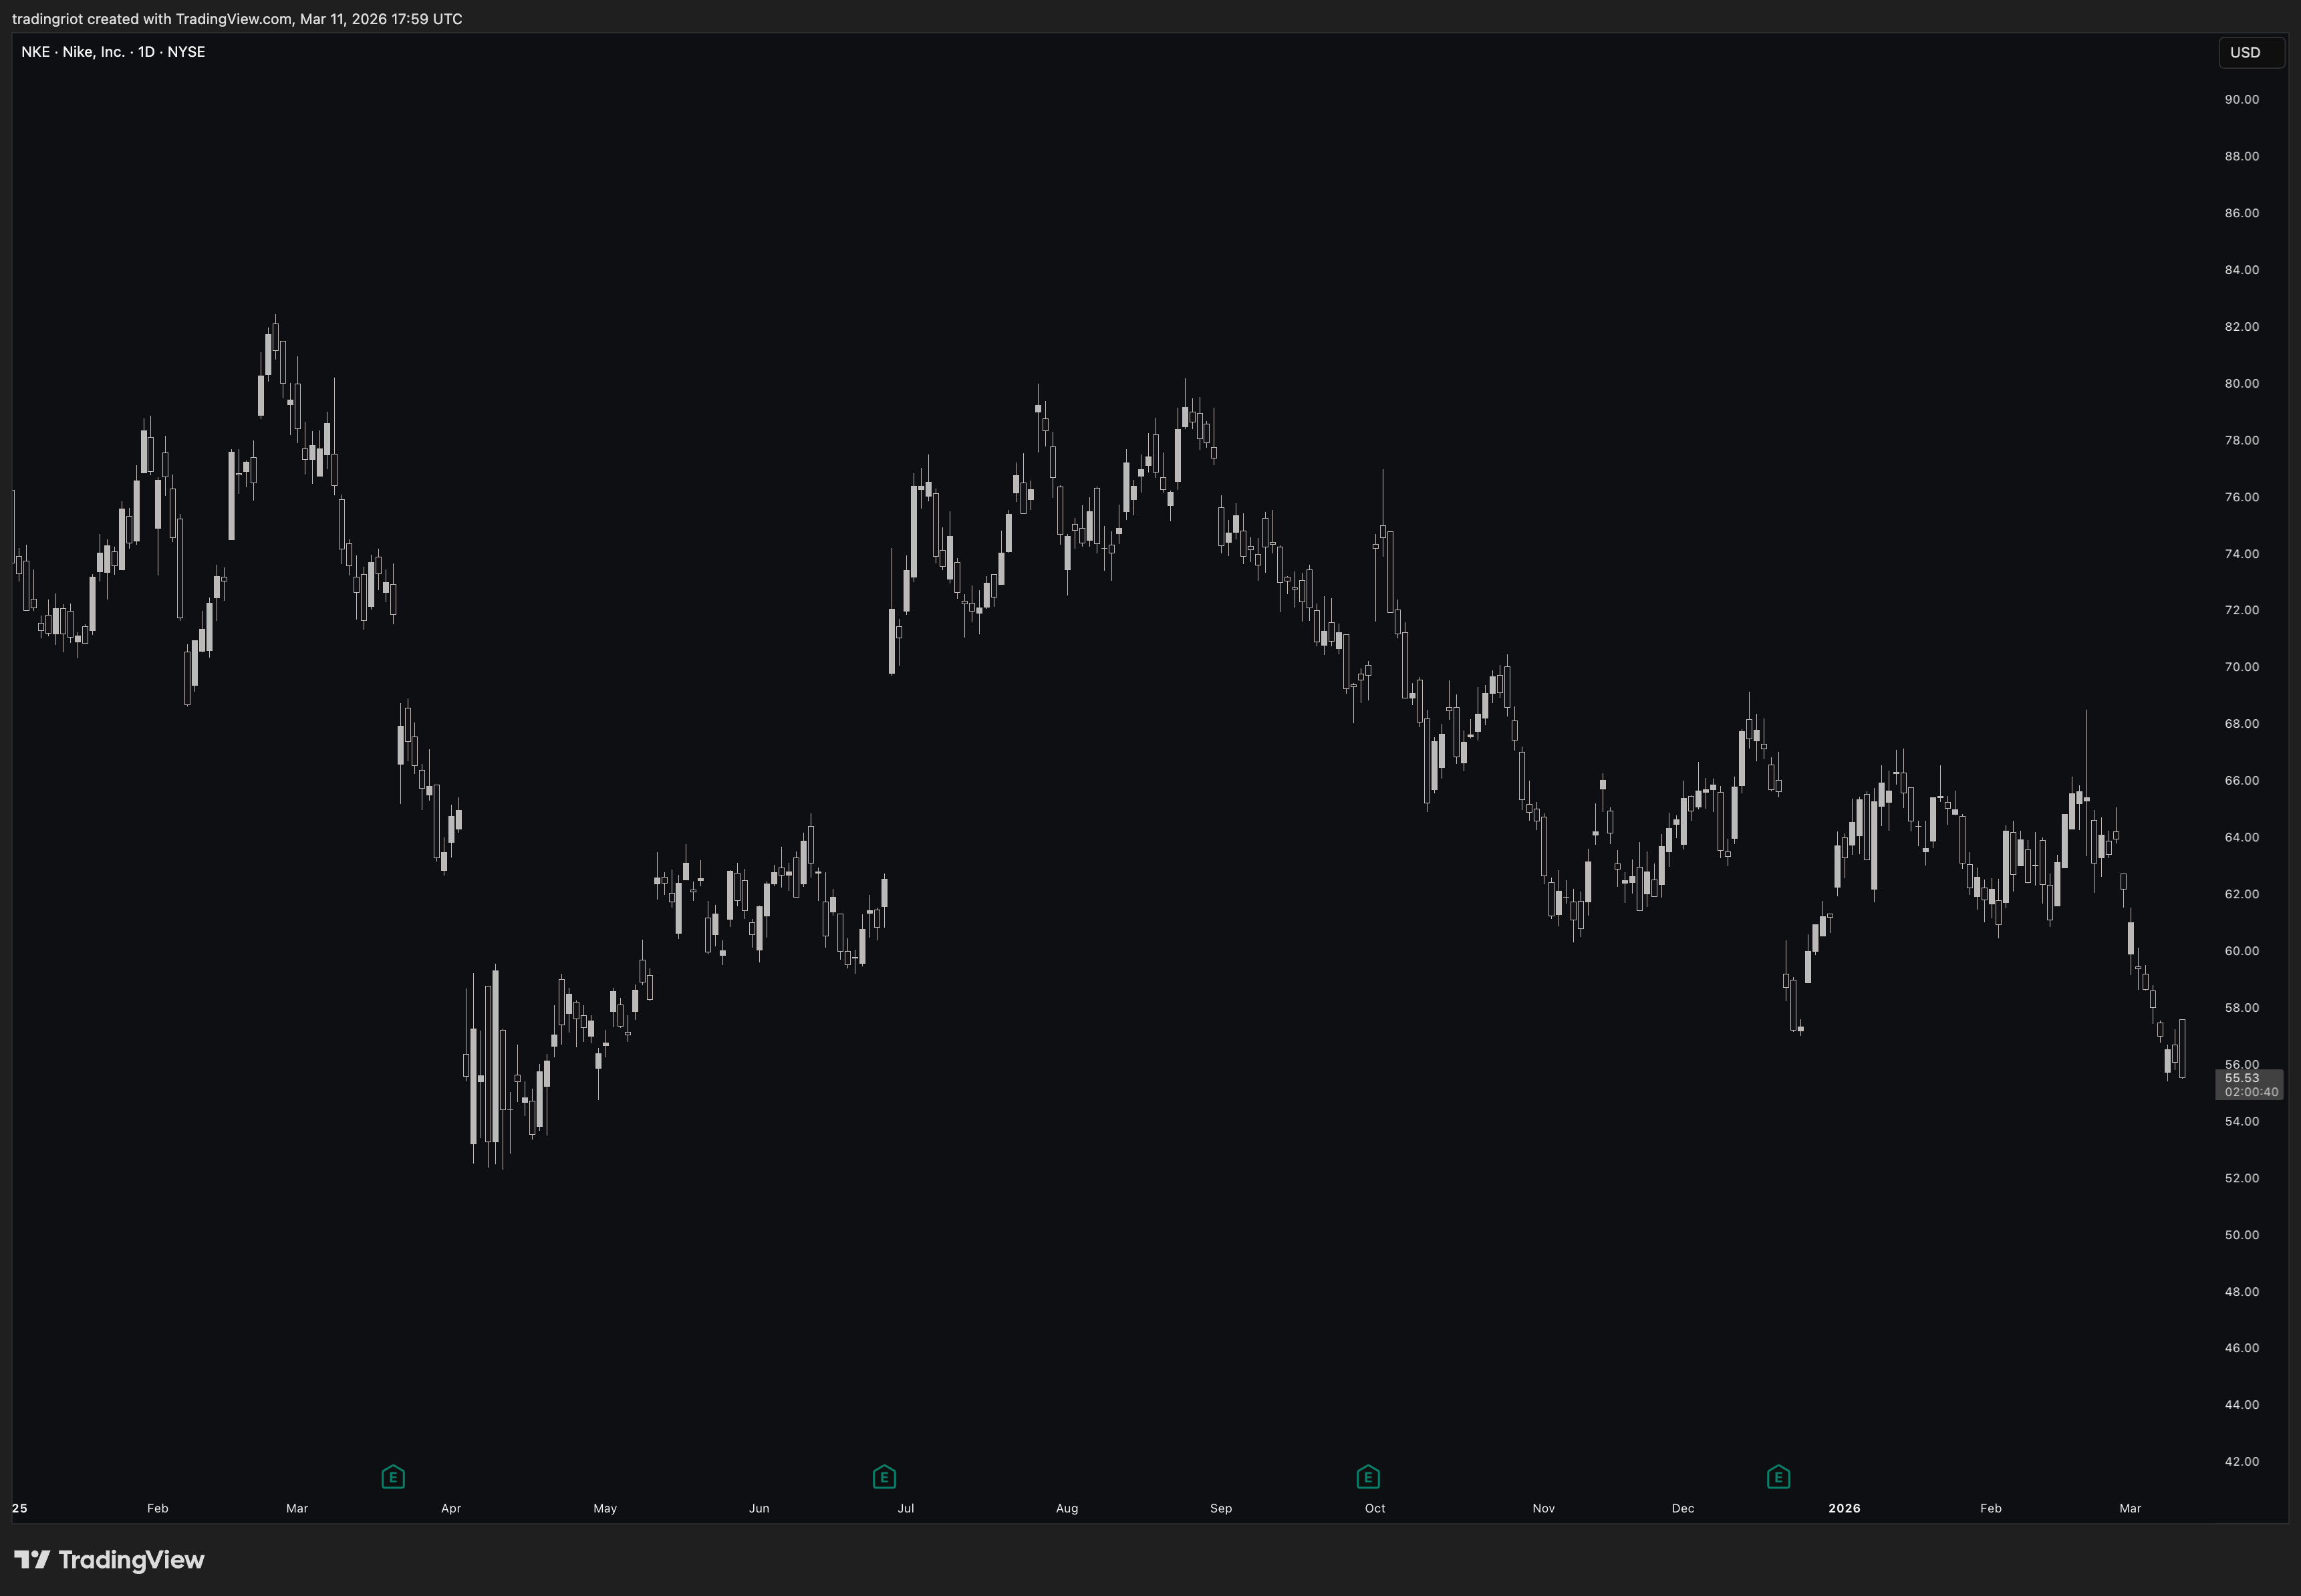
You can see on this Nike chart, all those big ugly gaps are caused by earnings (besides one).
This “earnings announcement premium” was first identified back in 1968 and keeps showing up across different time periods and countries. Some researchers attribute it to systematic risk, since earnings reveal information about the broader economy, not just the reporting company. Others blame limited investor attention, since earnings grab eyeballs and trigger retail buying. The explanations vary, but the fact holds: earnings days are where the action is.
For any trader, the massive uncertainty these events create gets priced into options well before the announcement. That pricing is where the real opportunities live.
How Implied Volatility Behaves Around Earnings
The pattern has been studied since the late 1970s and it’s straightforward: implied volatility increases in the weeks leading up to an earnings announcement, peaks just before the event, and drops sharply once the numbers drop.
This is the famous “IV crush.”
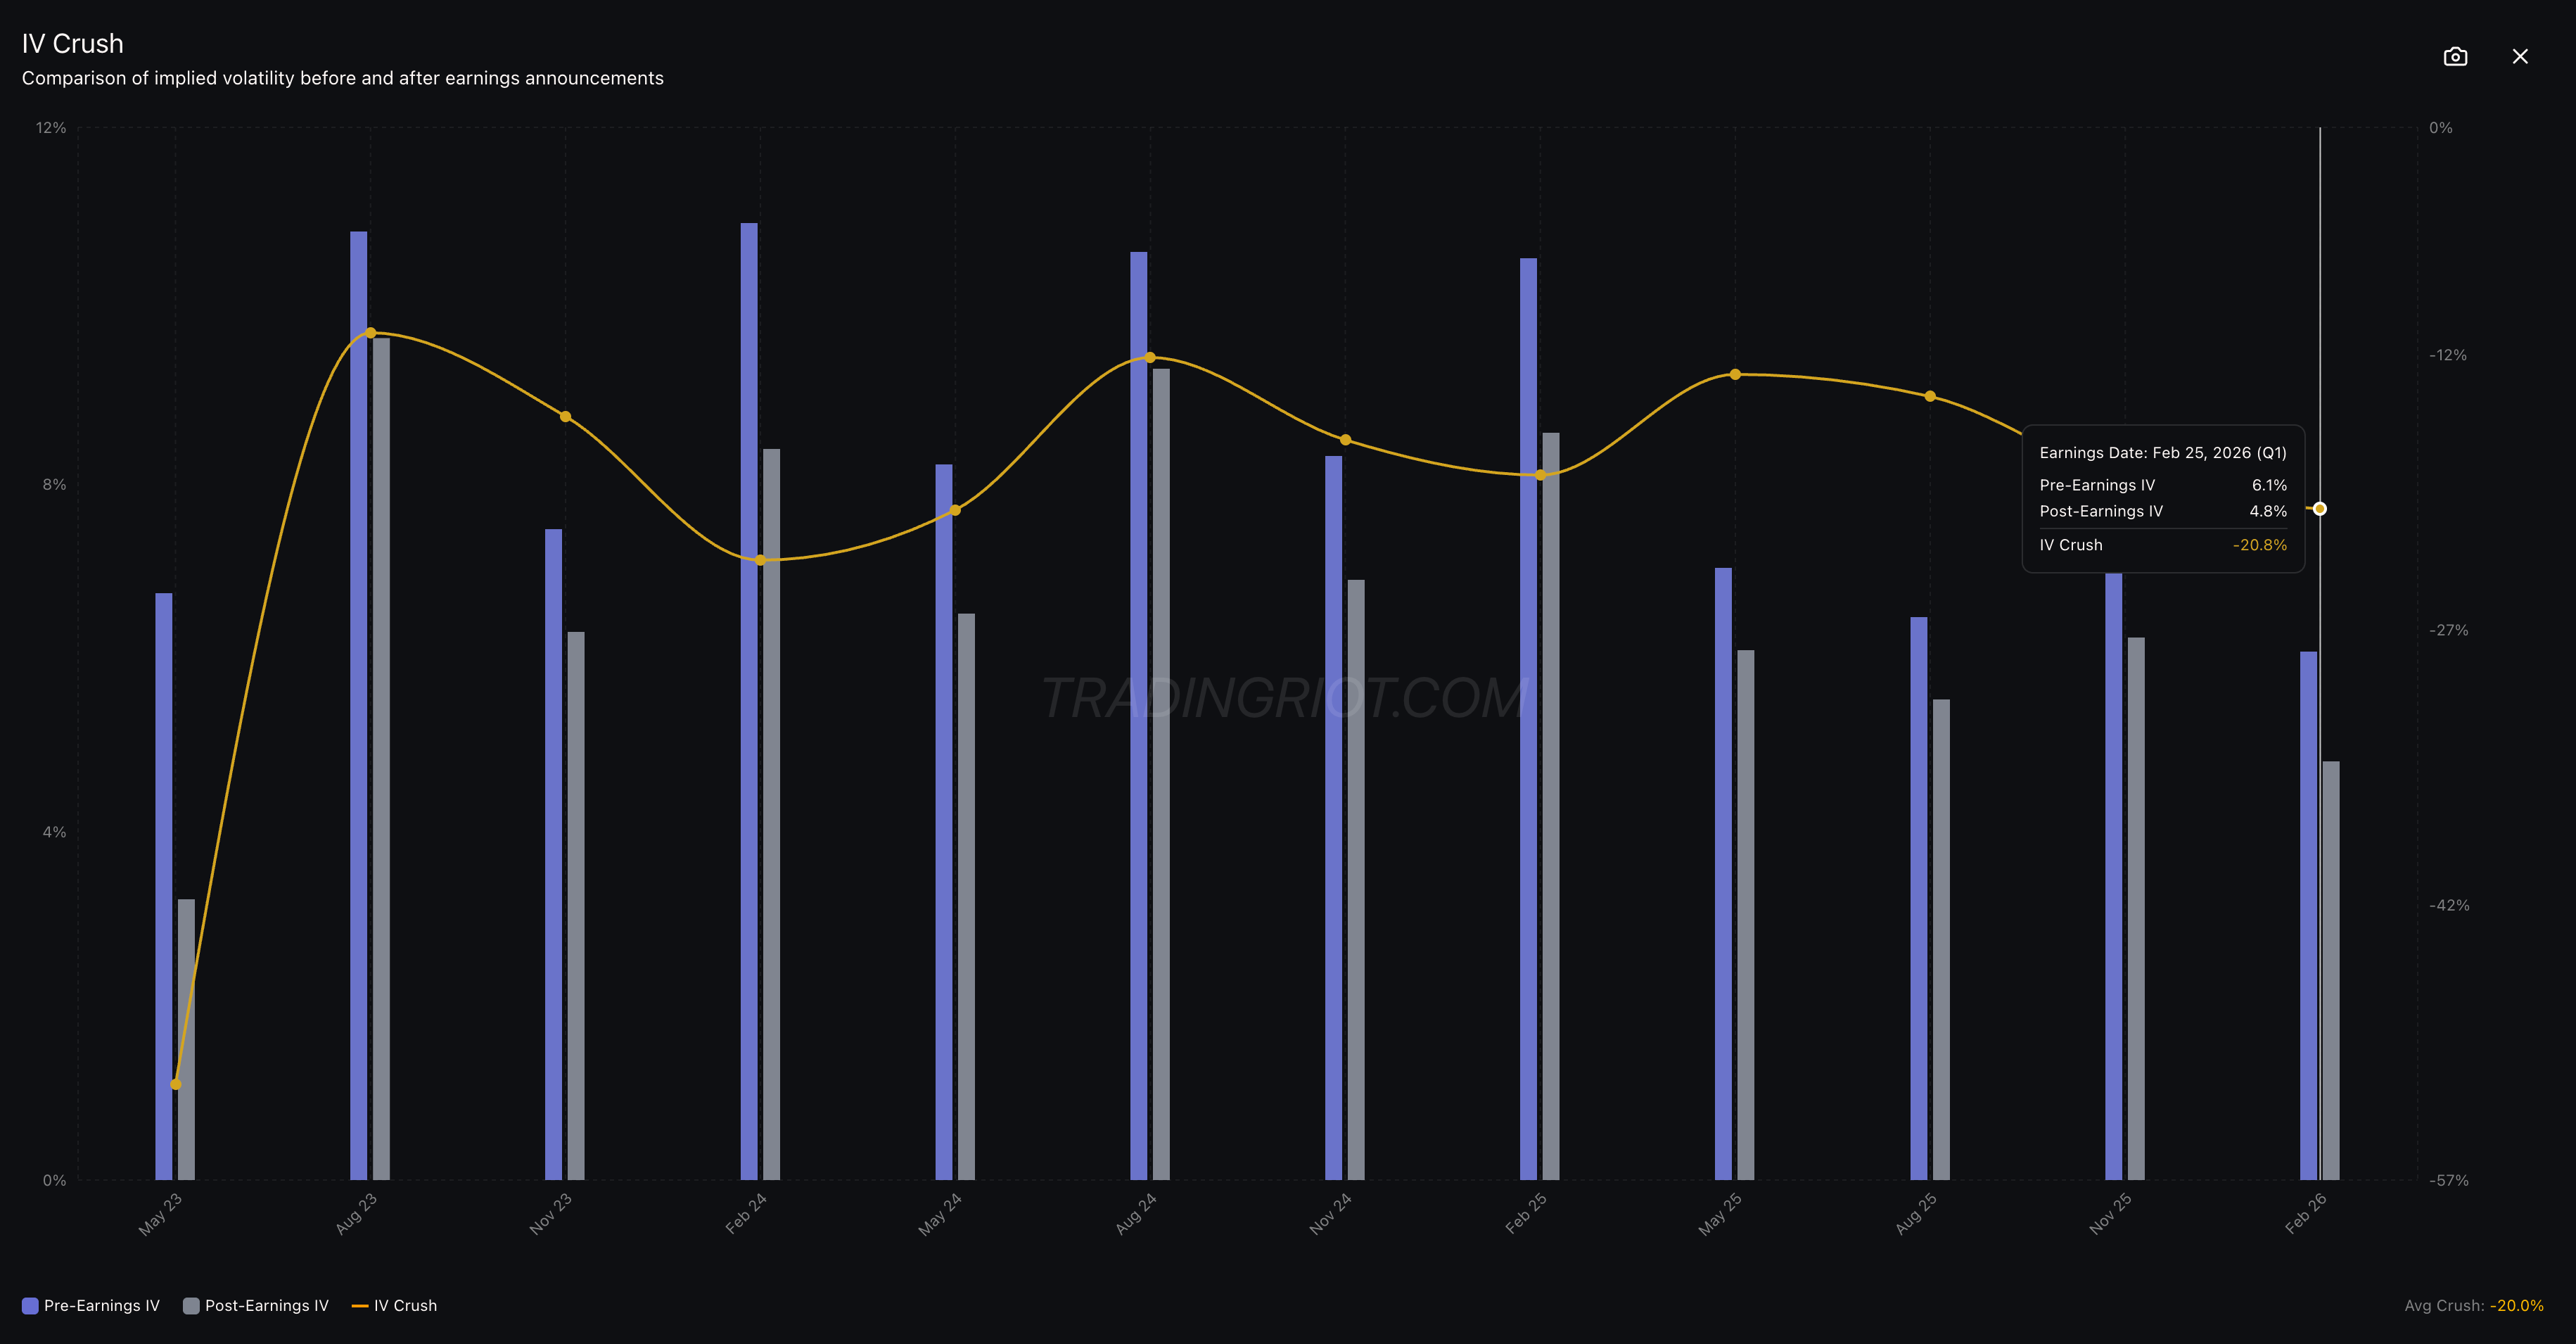
Below you can see a chart of the NVDA IV crush.
During the last earnings, pre-earnings IV sat at 6.1% while post-earnings IV came in at 4.8%.
That means before earnings, buying an ATM straddle would cost 6.1% of the stock price. After the announcement, that same straddle was only worth 4.8%.
The -20.8% IV crush means the straddle lost roughly 21% of its value overnight as the earnings uncertainty got removed.
It makes intuitive sense when you think about it in terms of variance.
An option expiring after an earnings announcement has to price in two things: the “normal” day-to-day volatility of the stock (call it ambient volatility) and the one-day jump that earnings can produce (event volatility).
As each trading day passes and the earnings date gets closer, that one-day event becomes a larger percentage of the option’s remaining life. The event’s contribution to total variance stays fixed, but you’re dividing by fewer remaining days, so annualized implied volatility keeps climbing.
Here’s the nuance that trips up most traders: the “IV ramp” heading into earnings is not free money for straddle buyers. The rise in annualized IV is largely mechanical.
It reflects the increasing weight of a fixed event variance as ambient days get consumed. Total variance in the option can actually decline even as the quoted IV number rises. This distinction matters enormously for anyone trying to trade the pre-earnings period. We’ll get into specifics later.
What matters for the volatility trader is how the market prices this event risk, and whether that pricing is systematically too high or too low.
Selling Earnings Volatility
There’s solid empirical evidence that the market consistently overprices the uncertainty around earnings announcements. Implied volatility before earnings typically exceeds the actual move that shows up after the numbers drop.
You can harvest that gap by selling straddles or strangles on stocks reporting earnings. You’re not predicting whether earnings will be a beat or a miss. You’re betting that the market’s expectation exceeds reality.
Why the Premium Exists
Several groups bid up options before earnings. Institutional hedgers need to protect concentrated positions through the event. Portfolio managers with single-stock exposure are often mandated to hedge. Retail traders pile into protective or speculative positions. Market makers widen spreads to account for jump risk. This combination creates systematically inflated premiums.
The premium is compensation for bearing a real risk. Earnings can produce gap moves that no amount of delta hedging can cover. That’s also why this trade sucks a lot (remember all those gaps on the Nike chart).
You as a seller are providing a genuine service: absorbing the uncertainty that others don’t want to hold. The edge exists because the market, on average, overestimates how bad things will be.
Euan Sinclair covers this well in Positional Option Trading, framing it as one of several harvestable risk premiums available to options traders. His key distinction is useful here: this is not a market inefficiency. It’s a risk premium.
People aren’t stupid for buying these options. They’re paying for insurance they genuinely need. But the insurance is, on average, priced too expensively. The seller captures that spread over many trades.
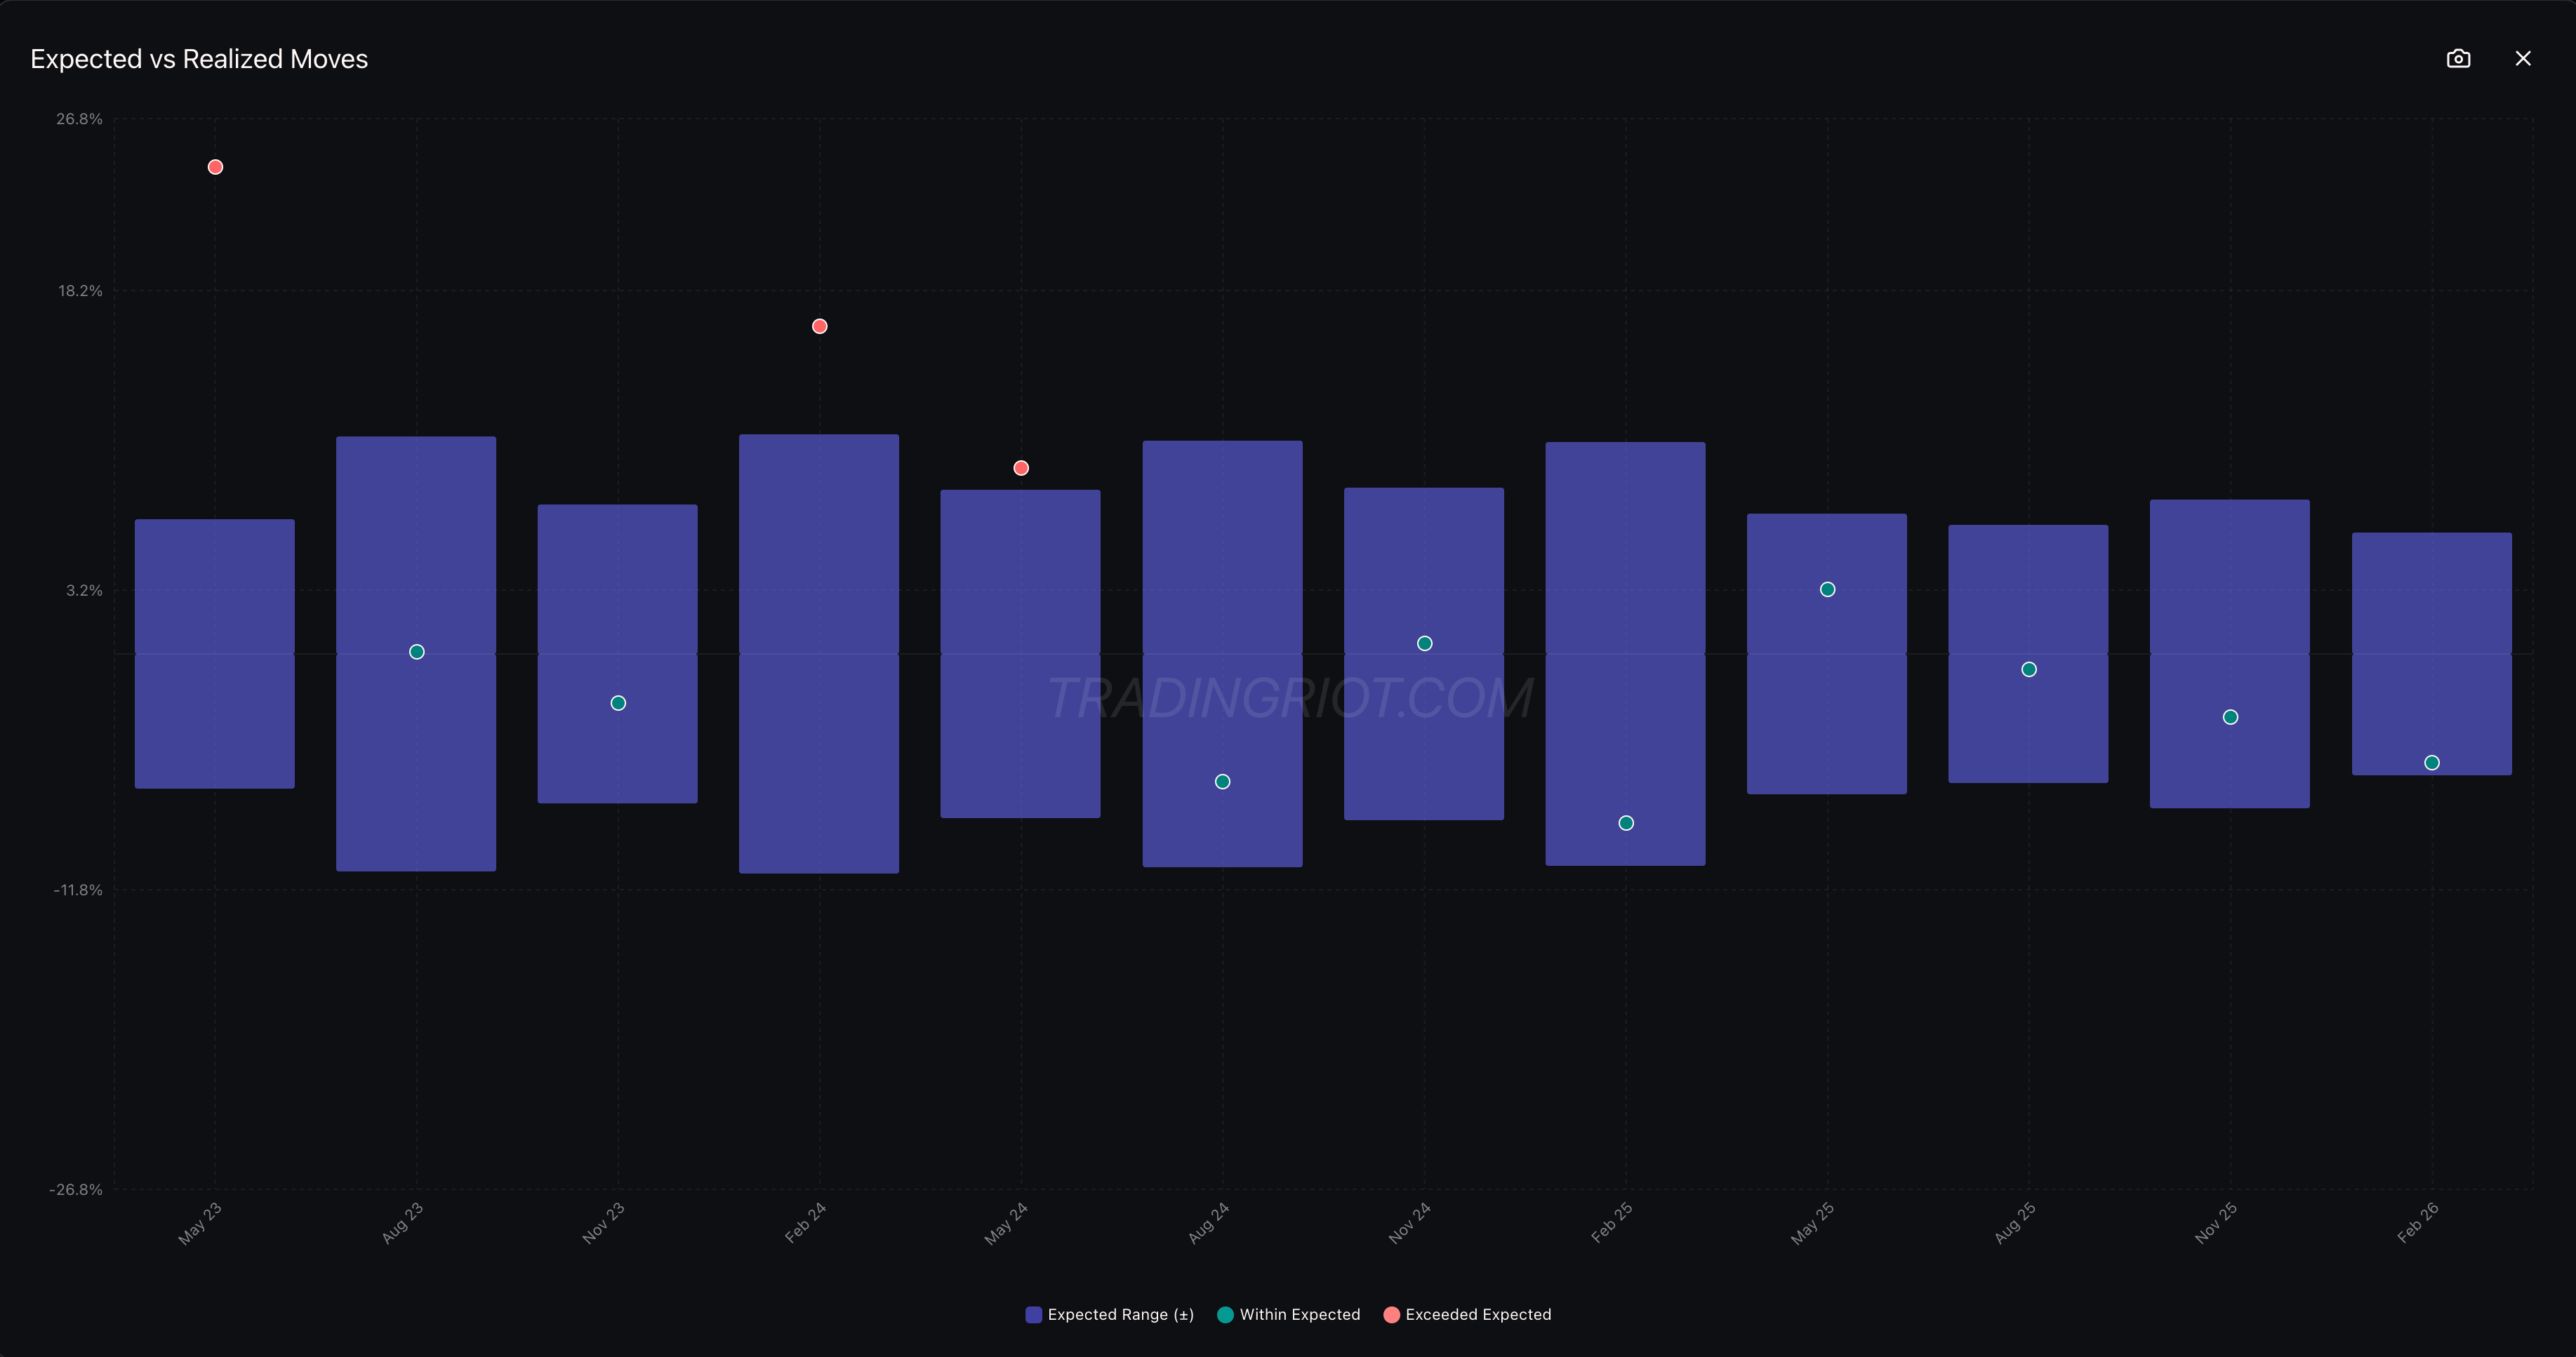
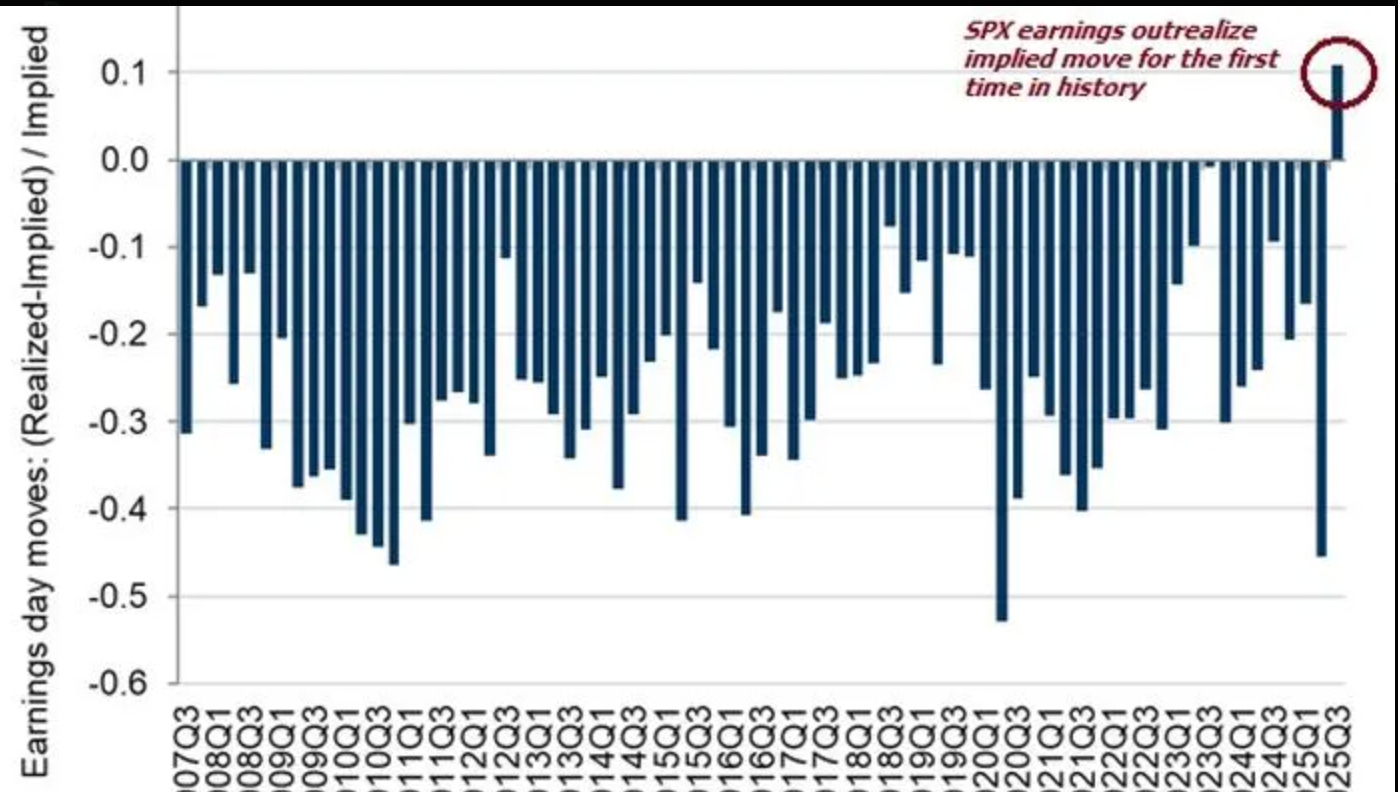
The implied-versus-realized gap shows up clearly in the data. When you compare the implied move priced by options to the actual move that shows up after earnings, the implied tends to overshoot. Not every time. Not even most times by a huge margin. But consistently enough that selling premium across a large sample of earnings events has positive expected value.
The key predictor of earnings straddle returns is simple: the gap between historical realized moves and the current implied move. When the implied move significantly exceeds what the stock has historically done on earnings, short straddles tend to profit. When the implied move is low relative to historical moves, long straddles tend to profit. Intuitive, and confirmed repeatedly.
Why Buying Vol Into Earnings Sucks
I will explain why selling vol sucks in a moment, but before doing that let me cover why buying vol also sucks.
This is one of the most common mistakes in options trading. Buying straddles right before earnings sounds great in theory: “The stock is going to move big, so I should own options!”
The problem is that implied volatility before earnings is already extremely elevated. The market knows the event is coming and prices it aggressively. For a long straddle to profit, the stock needs to move significantly more than the implied move, which is already inflated.
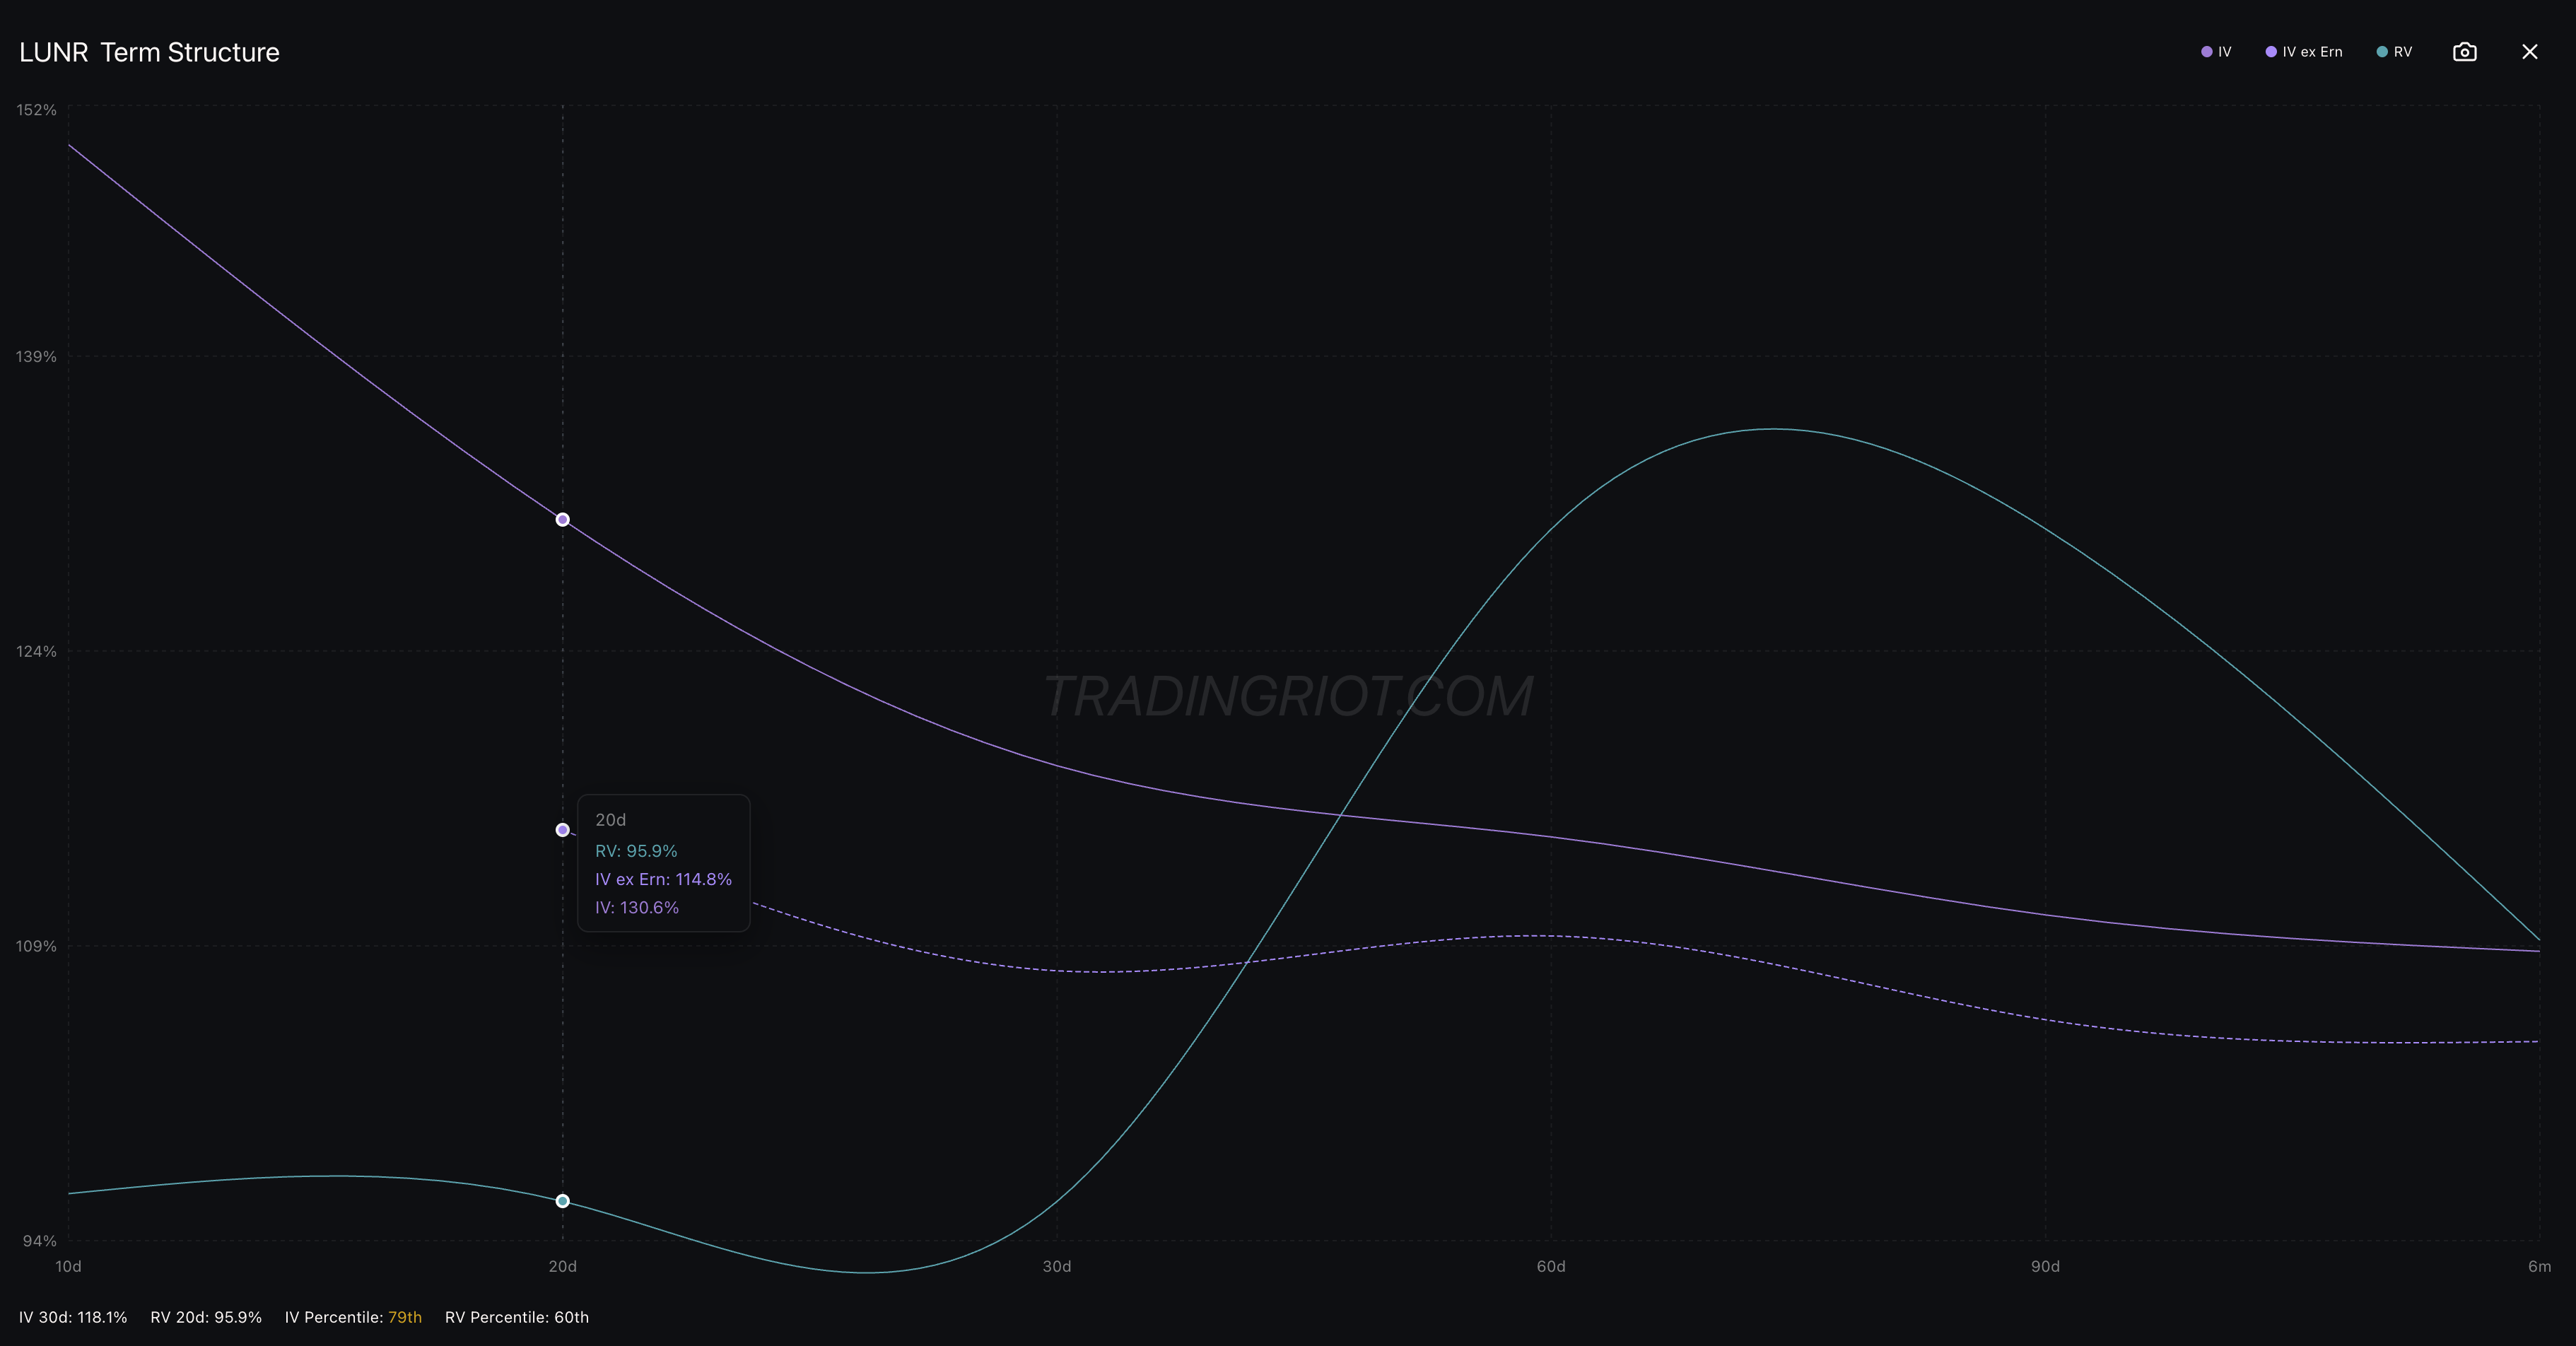
LUNR, for example, is one of the stocks with earnings coming up soon. You can see that 20-day IV, which includes the earnings event, sits at about 130%. But if we exclude earnings, IV drops to 114%. That means buying those options already carries the earnings premium baked in.
Run the math. If a stock has a 10% implied move and you buy the straddle, the stock needs to move well beyond 10% just to break even. Most stocks don’t deliver moves that far exceed what’s implied. The rare ones that do are impossible to predict in advance. Over a large sample, the systematic overpricing of earnings events means selling premium has the statistical edge.
As Sinclair puts it in Volatility Trading, the entire concept of the volatility risk premium comes down to implied volatility being, on average, higher than realized volatility. This phenomenon is amplified around earnings because event risk gets priced at a premium. Buying that premium right at its peak is fighting the strongest headwind in options.
Selling Options is a Concave Strategy
Selling earnings straddles has a specific payoff profile that you need to internalize before trading it. Your profit is capped at the credit received. Your loss is theoretically unlimited if the stock makes a massive gap. You win small and often. You occasionally lose big. Very big.
This is the classic short gamma payoff. Small payouts against occasional large losses. The same dynamic as writing insurance. An insurance company collects small premiums repeatedly and occasionally pays out on catastrophic claims. The edge comes from diversification across hundreds of uncorrelated events, not from any individual policy.
Expect individual trades losing 3-5x the premium collected on moderate gaps. Expect occasional trades losing 10x or more on extreme moves. Expect multi-day winning streaks followed by a single trade that wipes them all out. This will happen. It is the cost of doing business.
The edge is real, but it only shows up over a large number of trades. This is the law of large numbers at work. Any small sample will look random and painful. You need dozens of events each quarter, repeated over multiple quarters, for the statistical advantage to compound. Single quarters can and will be losers.
Improving the results
While some literature frames this trade purely as a law of large numbers where you should sell earnings vol on every single stock, I don’t think that’s 100% true. The outcome of any single earnings event is random, but for some stocks the implied moves are consistently way higher than the average realized moves.
This can of course mean there is information we don’t know about. But selecting stocks that historically show higher implied than realized moves and tend to be profitable to short on earnings beats the approach of just selling volatility on every stock with earnings coming up.
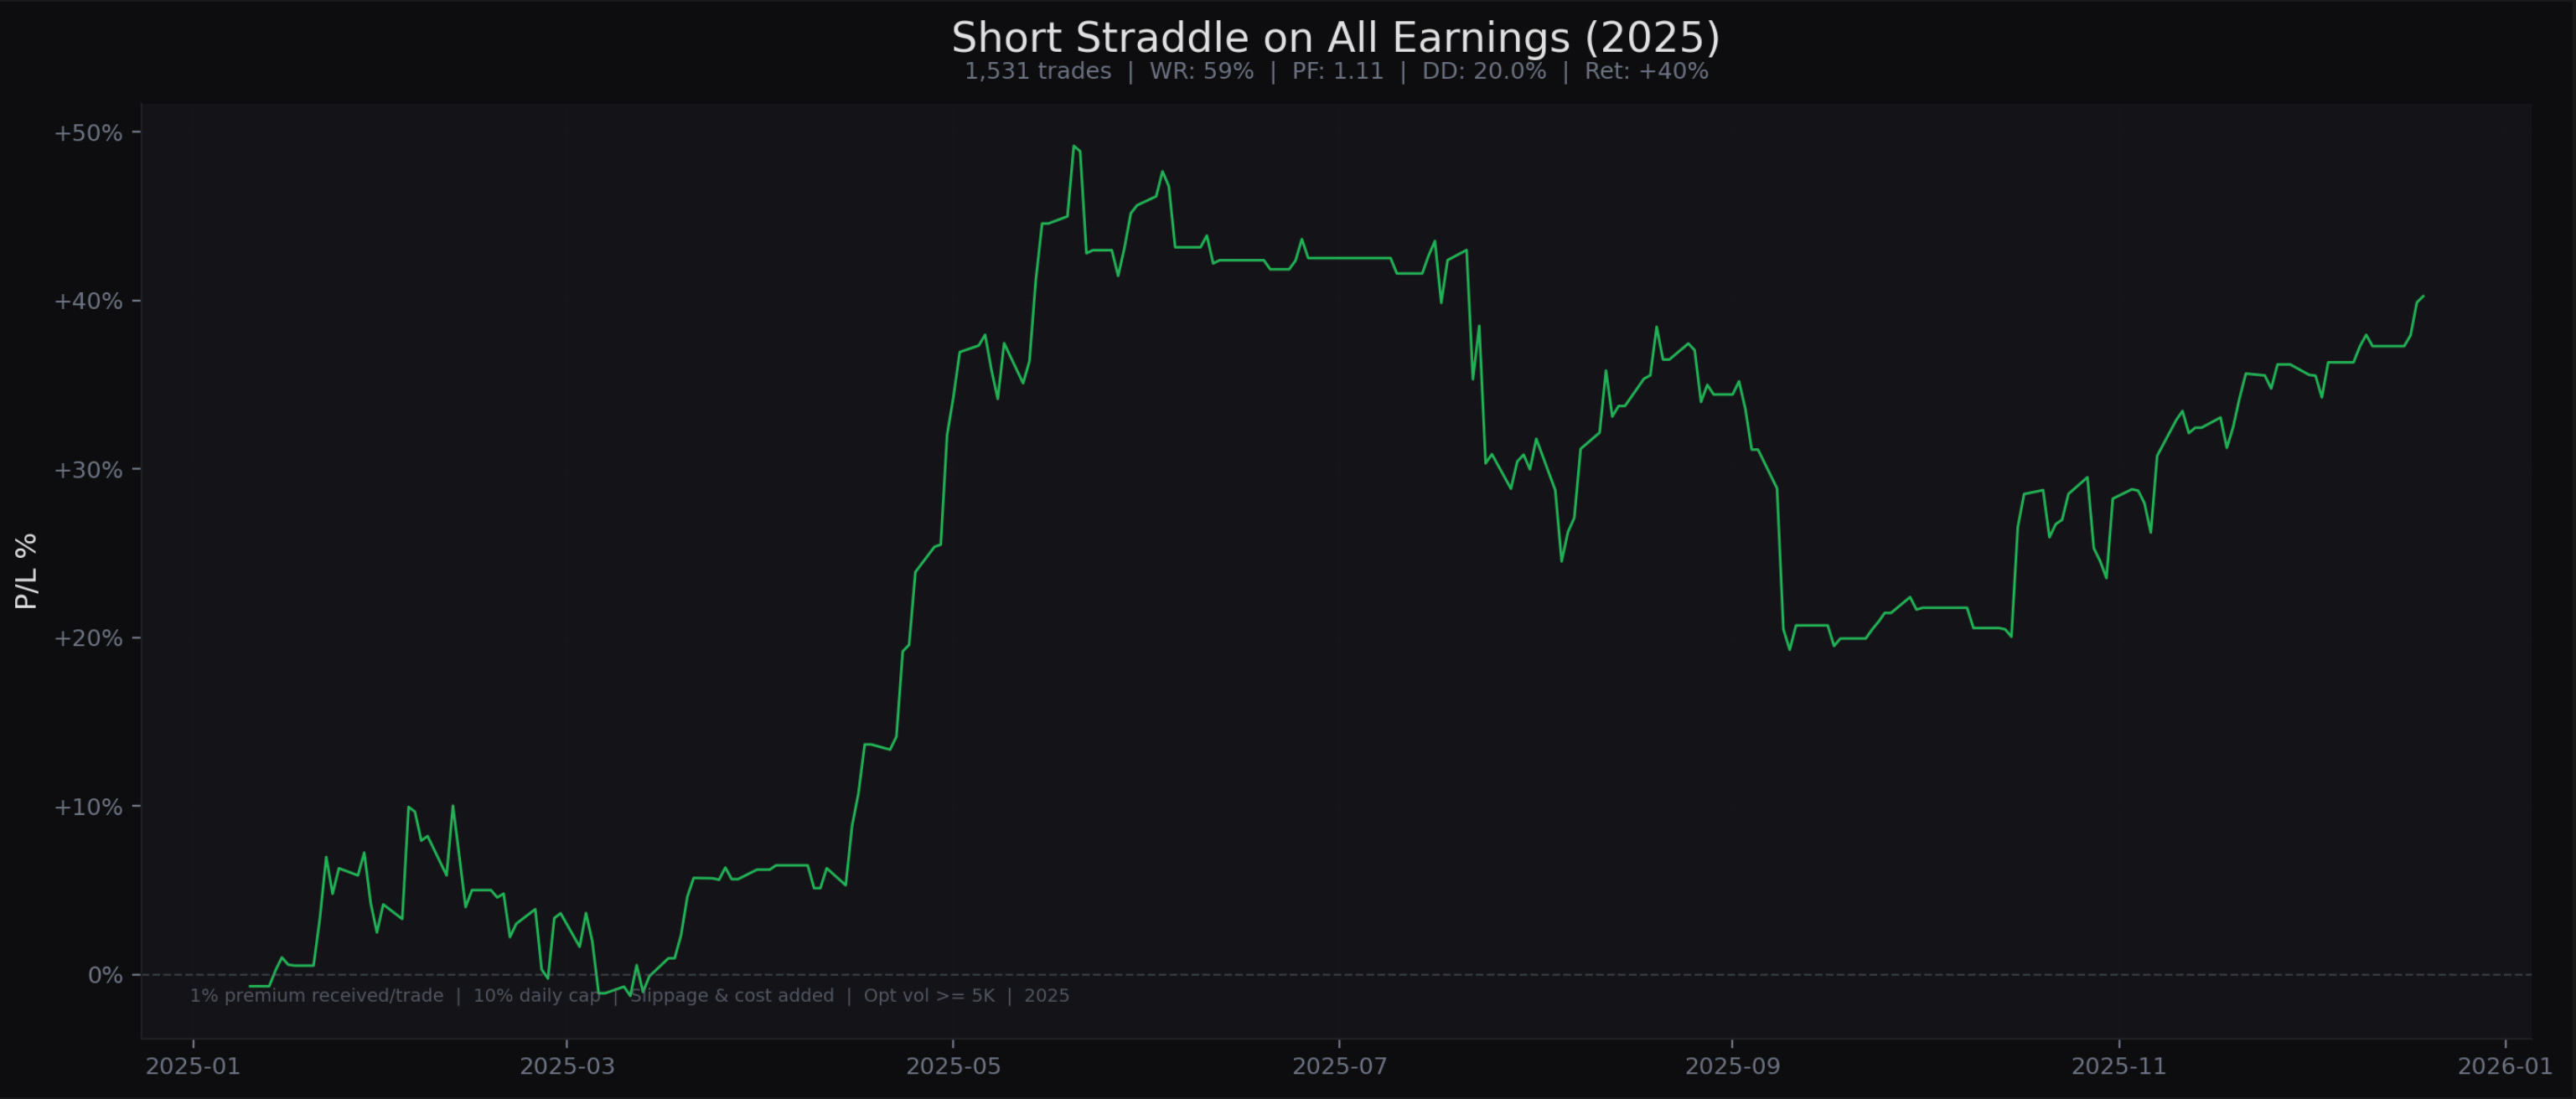
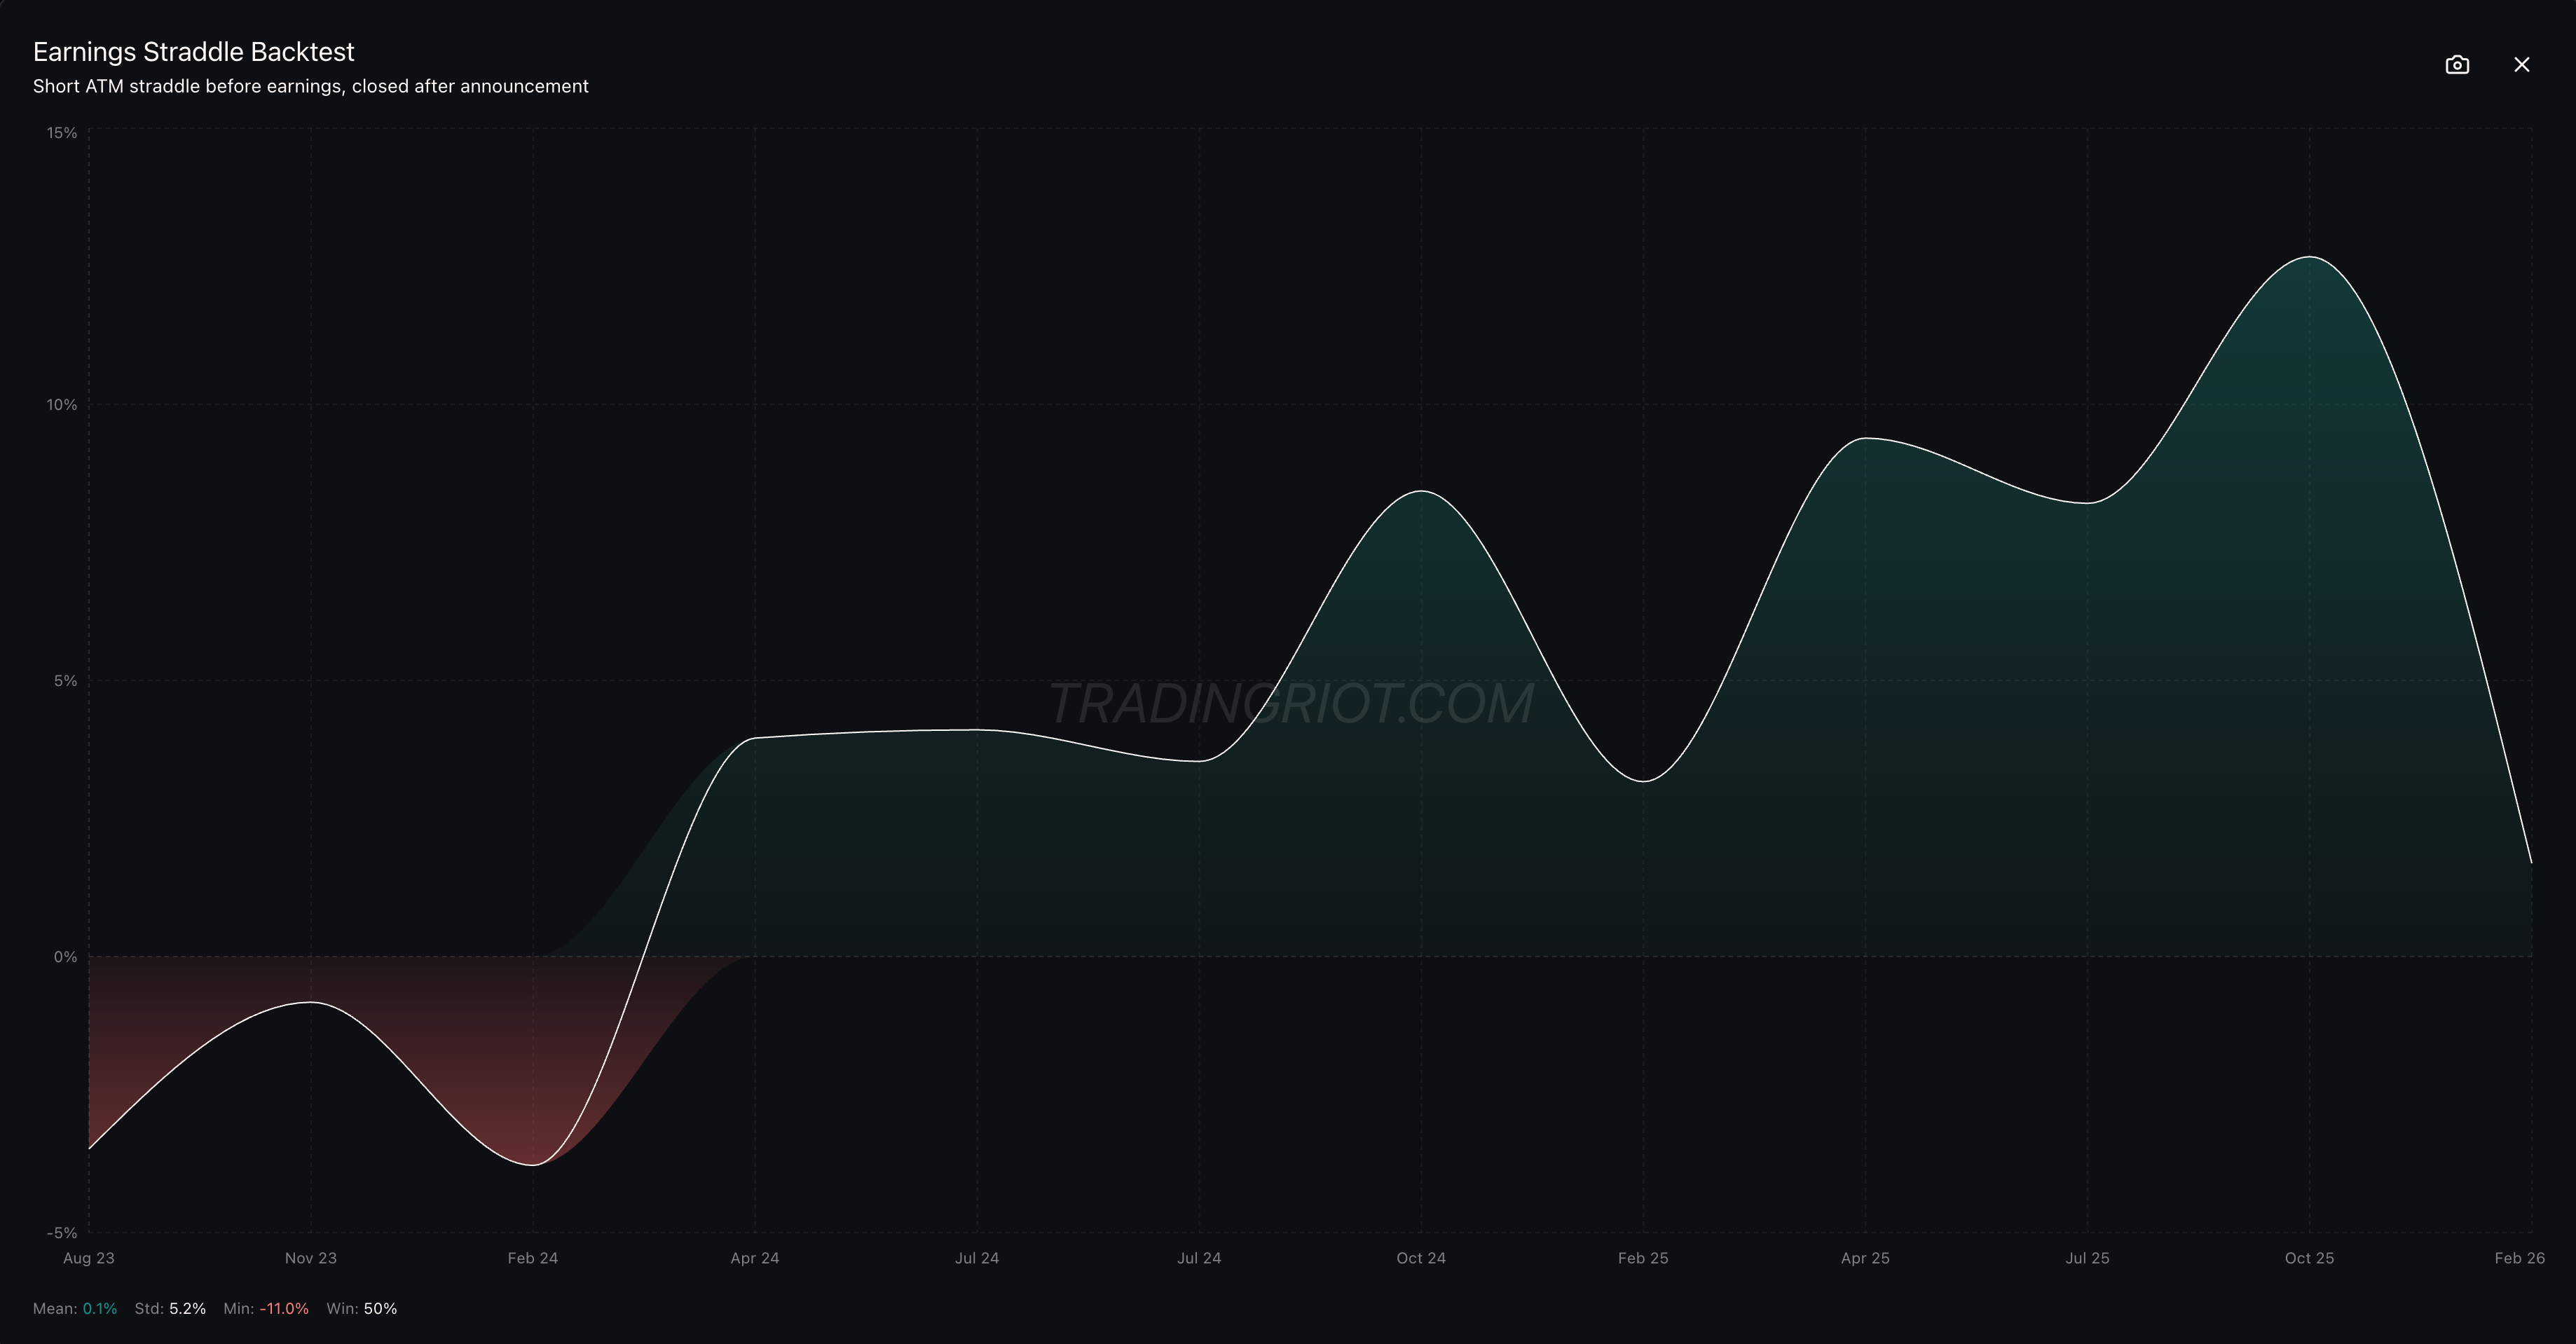
As you can see in the backtest below, trading only stocks where the implied move is larger than the historical average realized move produced better returns with fewer trades.
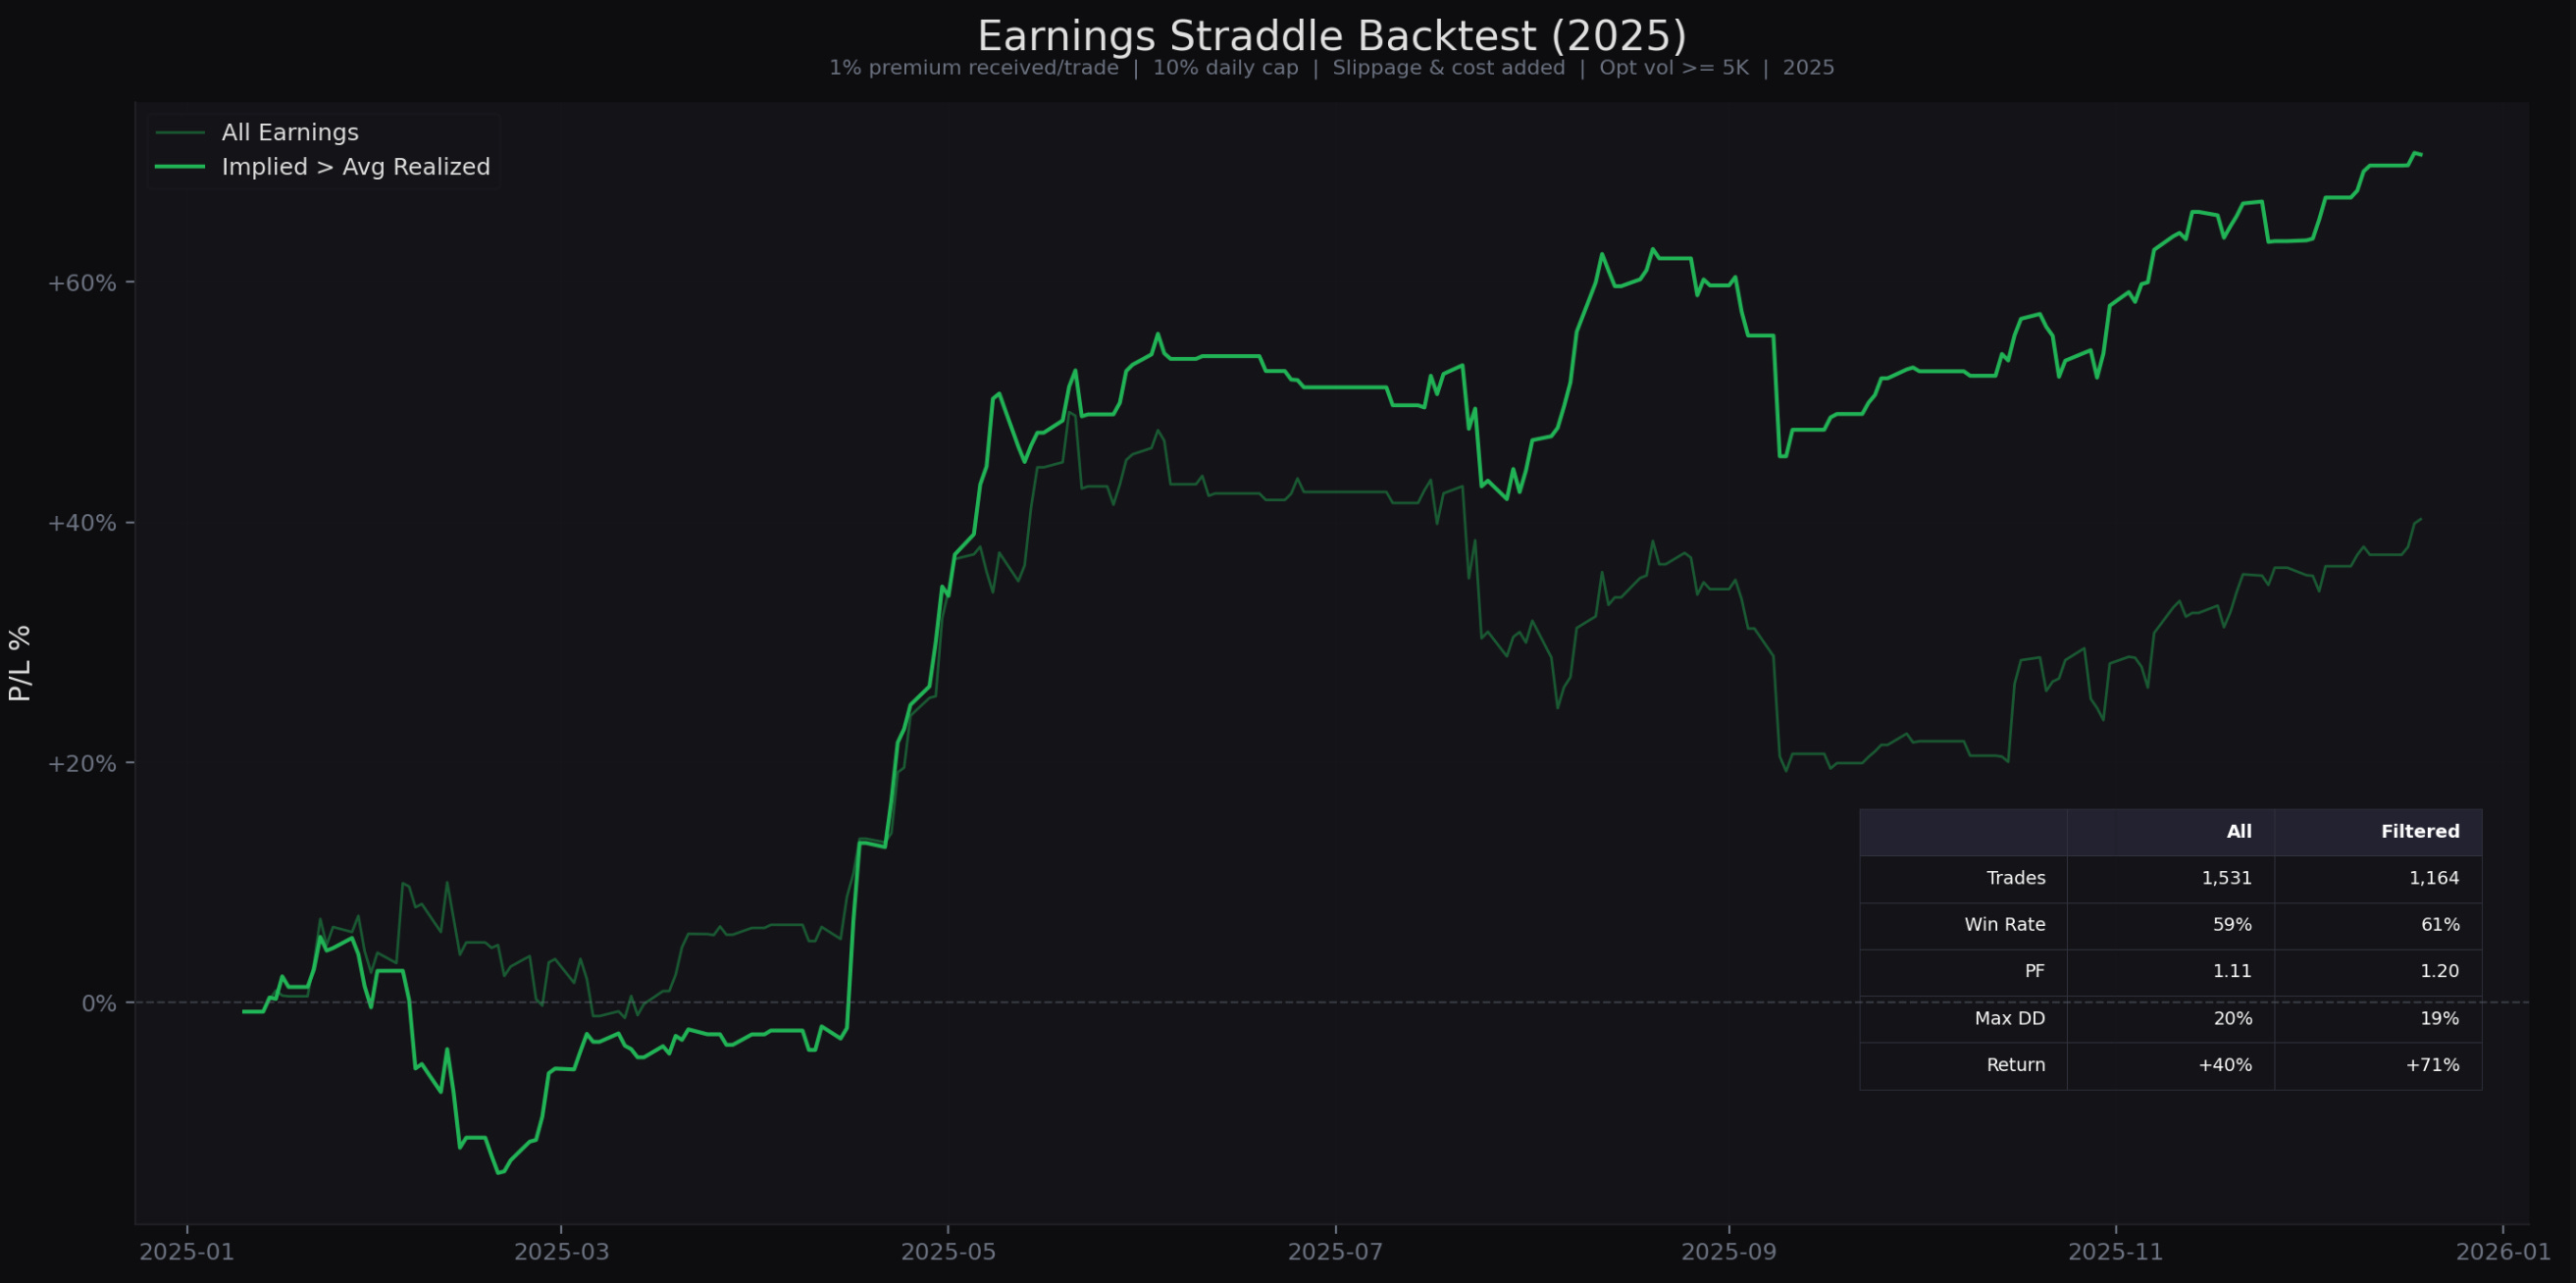
One thing worth pointing out is that this is still not a free lunch. Blowouts are inevitable. You can notice on the equity curve (the thicker one) that it went straight into a drawdown at the start, while selling volatility on all stocks actually didn’t.
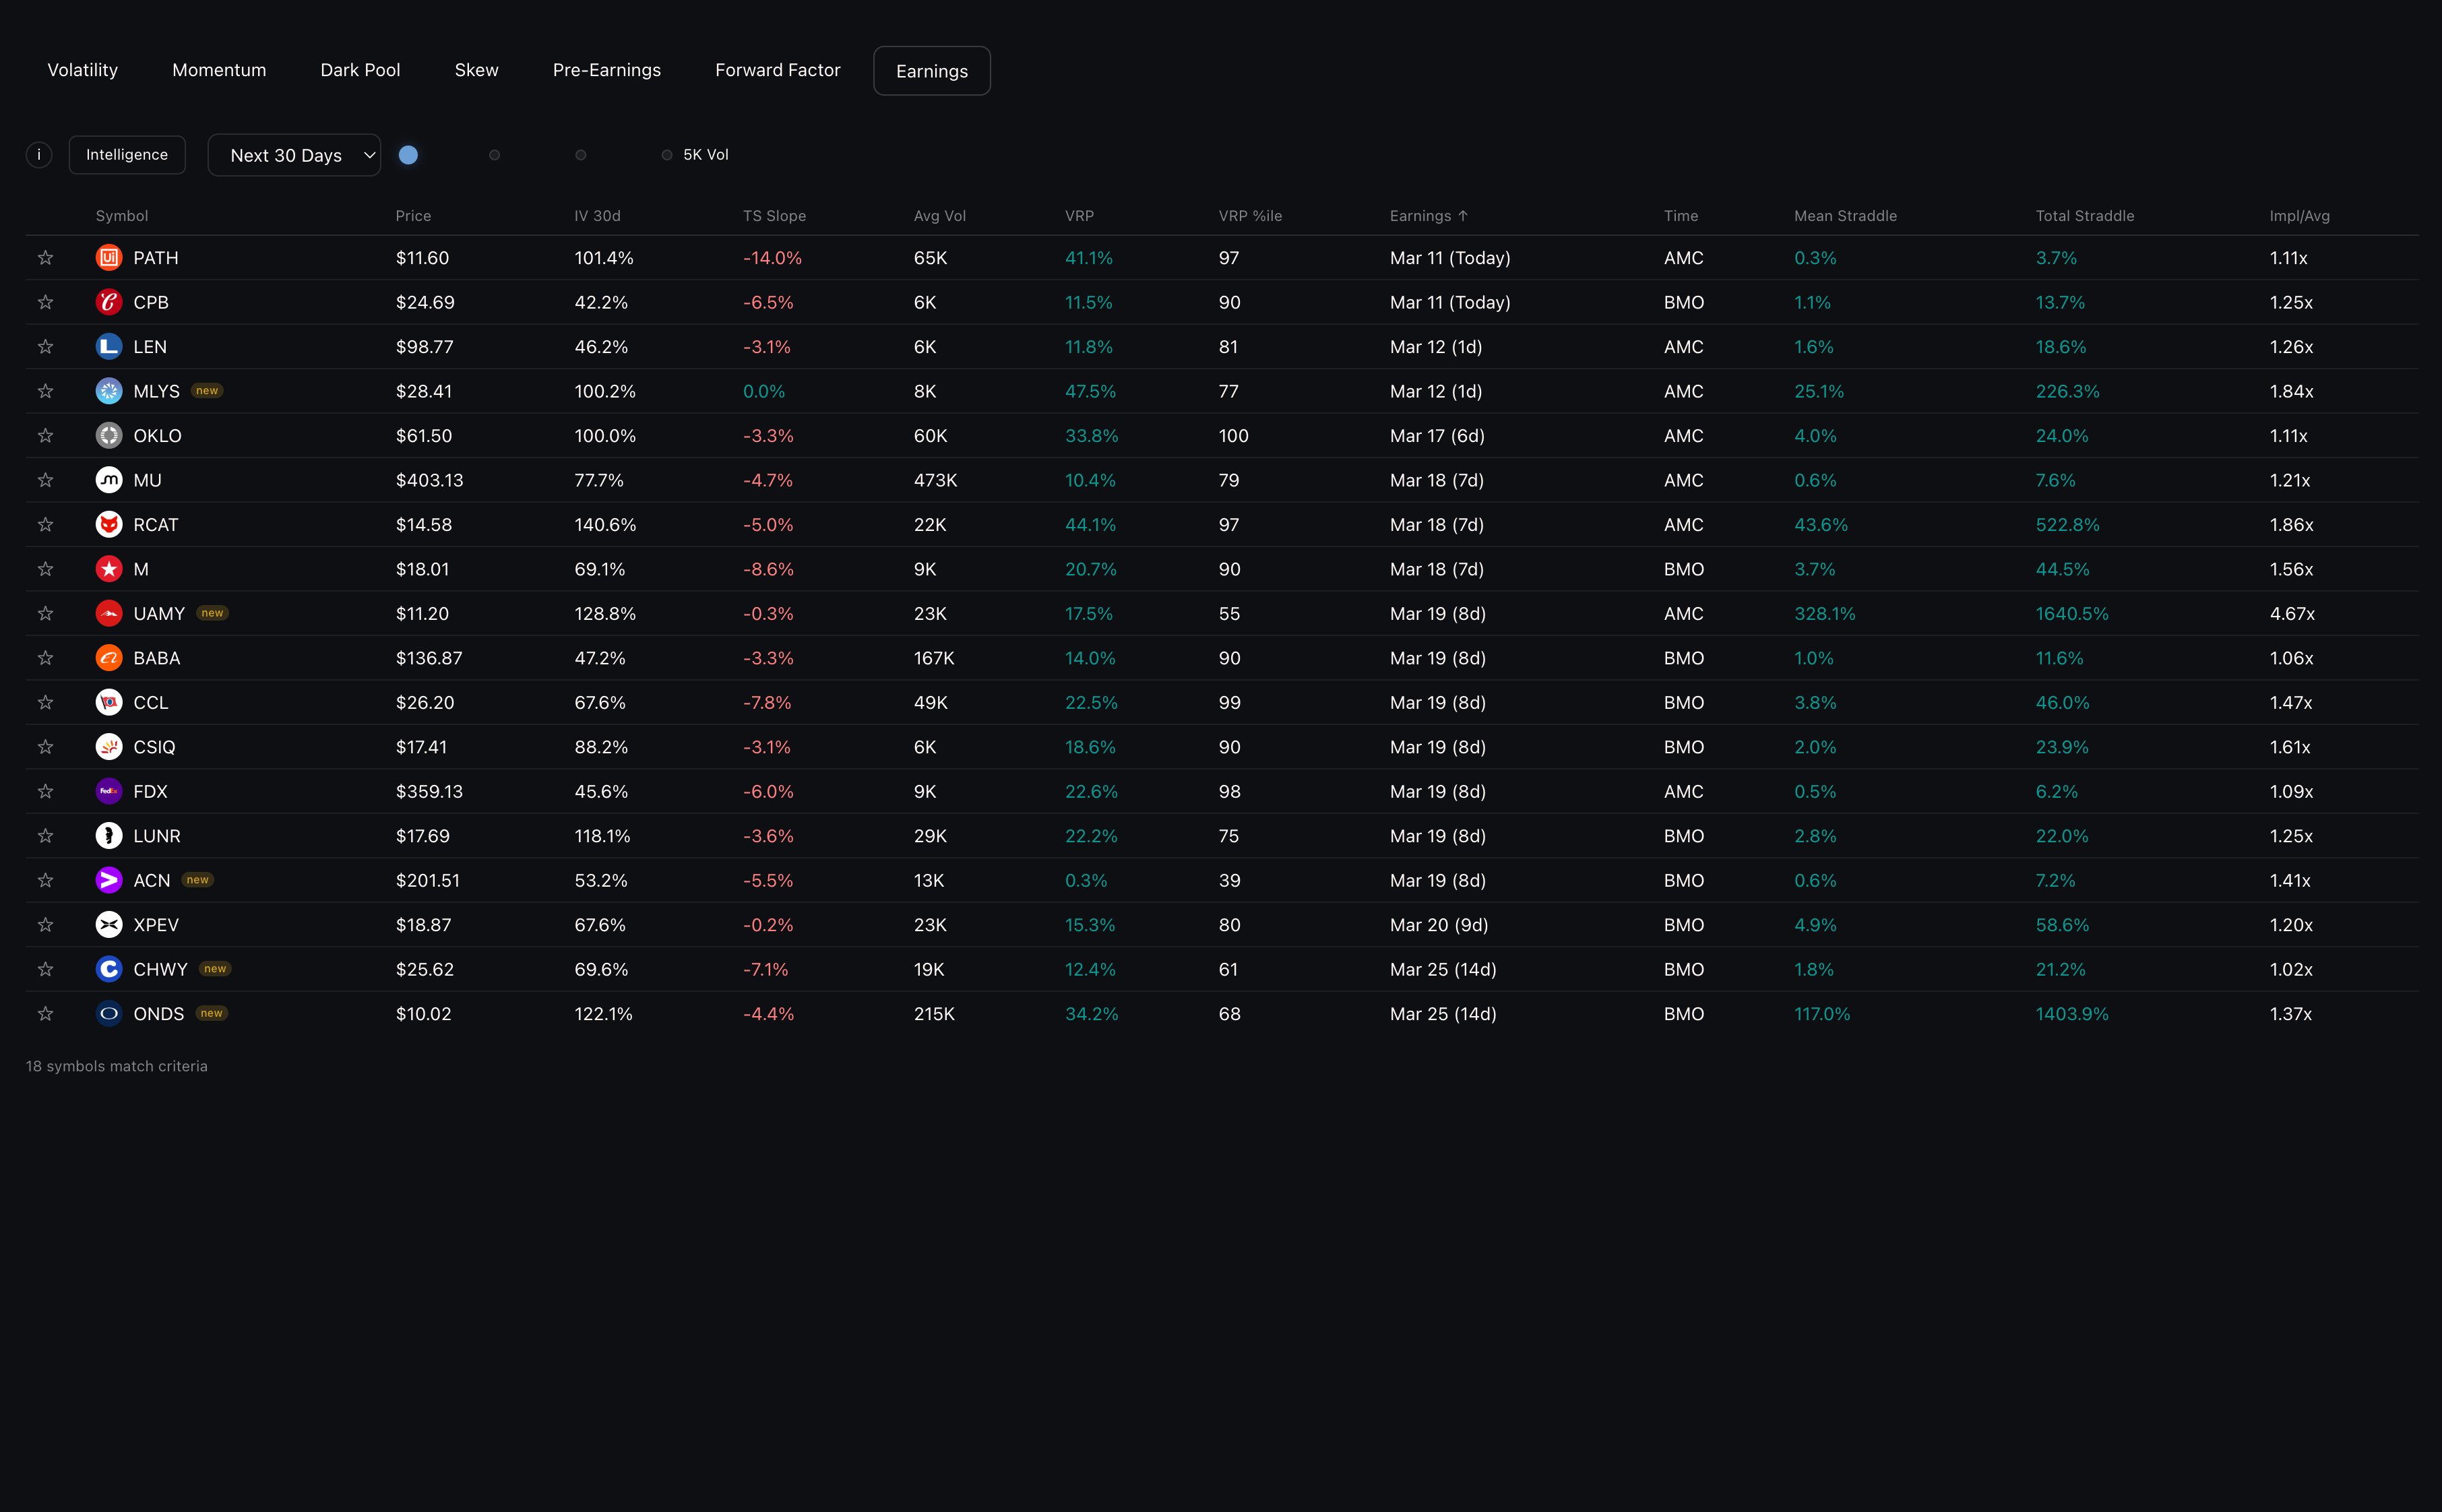
On the TradingRiot website, you can find a screener showing all stocks that meet the criteria used for the backtest with upcoming earnings, allowing you to focus on liquid markets with a more favorable outcome.
Trade Mechanics
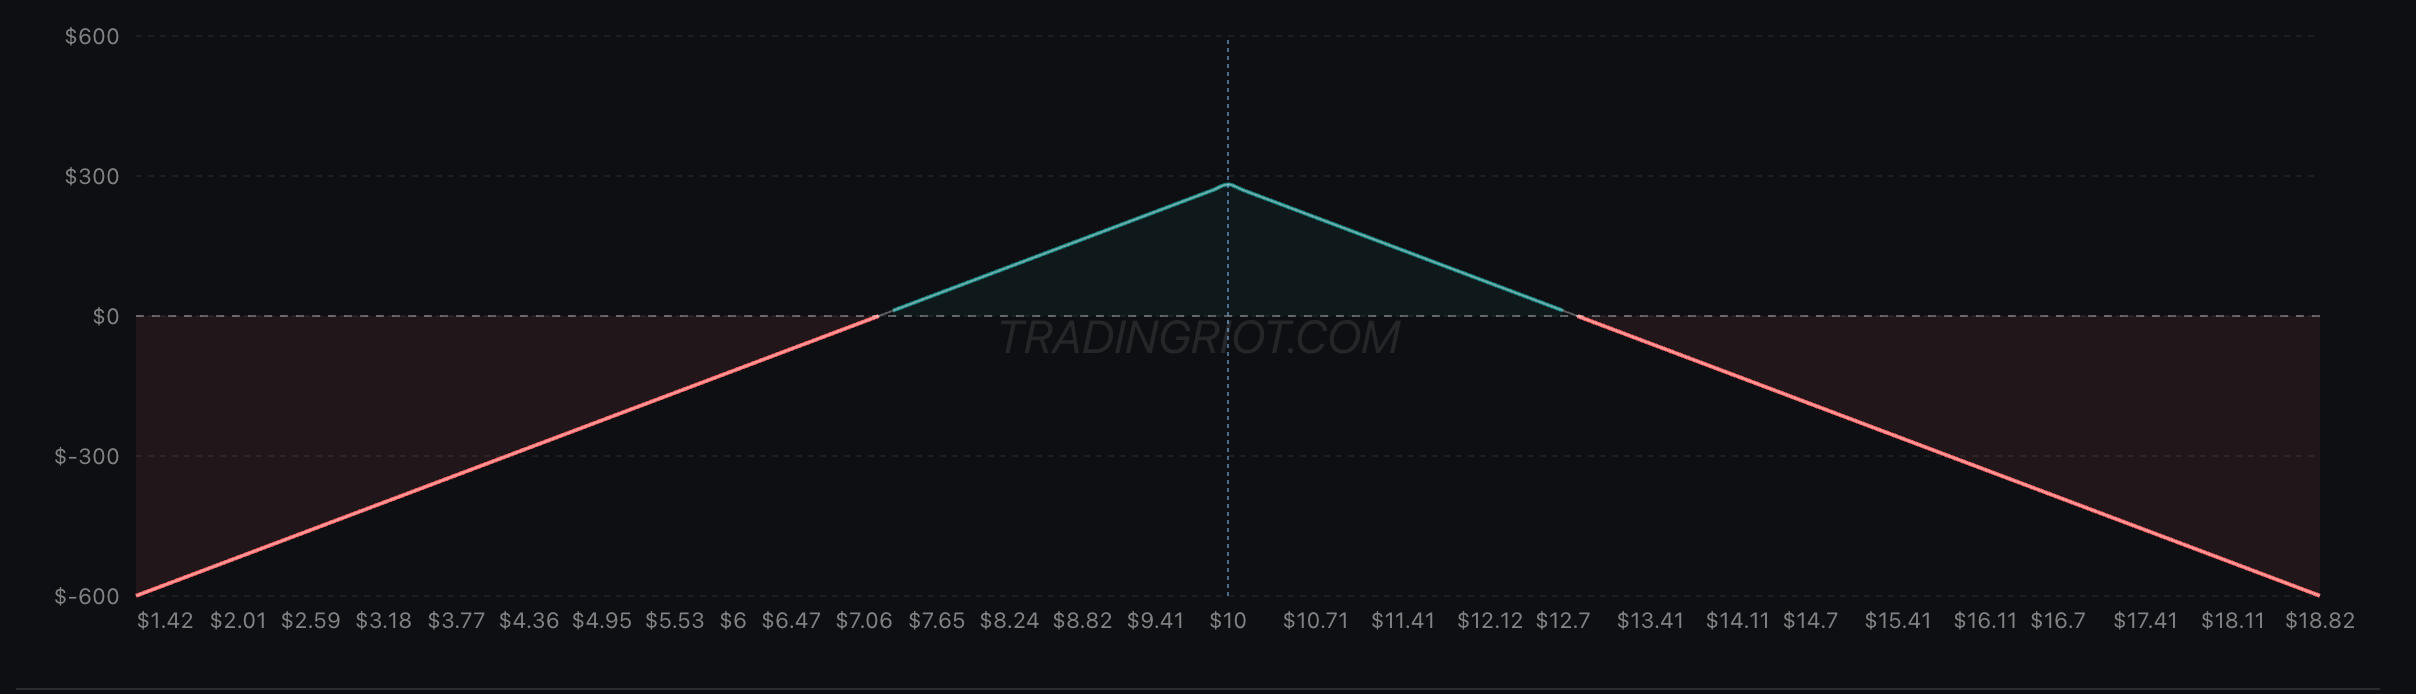
The core trade is selling ATM straddles or strangles at the implied move levels on stocks reporting earnings between today’s close and tomorrow’s open. Enter in the last 30-60 minutes before close when IV peaks. Exit 15-30 minutes after the open the next morning, once spreads tighten.
The important detail when choosing between a straddle and a strangle is positioning your breakevens at the implied move. This is the entire thesis behind the trade: the market will underperform its implied move. A straddle collects more premium but has tighter breakevens. A strangle placed at the implied move levels gives the stock room to move within the implied range and you still keep the full credit. Both express the same bet.
Target the closest weekly expiration to maximize event exposure and minimize exposure to non-event days. Size at roughly 0.5-2% of account per trade as credit received. Check the maximum historical move for each stock and make sure to prepare for worst case scenario happening again, this is inevitable pain, but it should wipe out half of your account so don’t be stupid.
Buying protection using condors might seem like a smart idea, but adding wings to create a favorable risk-to-reward profile takes away a lot of edge. You are getting paid to hold tail risk. Hedging it away removes the reason you’re getting paid, in other words, your mom raised no pussy.
Traders can buy 1-5 delta wings to prevent truly catastrophic events, but these should not take away more than 5-10% of credit you are getting and they will also make it harder to exit the position as a spread on the next day.
Being smart with sizing and using historical data to see what the maximum moves were, then accepting that those moves can happen again, is the better approach.
The critical management rule: never hold a losing position hoping it recovers. Post-Earnings Announcement Drift (PEAD) is one of the most robust findings in finance. Stocks that gap on earnings tend to continue drifting in the same direction, not reverse. Hoping for mean reversion after a big gap is gambling.
Pre-Earnings Volatility: Trading the Ramp
The second way to trade earnings volatility is to position before the event, during the period when implied volatility is building. This approach targets the 1-3 weeks before earnings, buying or selling straddles to capture the repricing of event uncertainty as the announcement approaches.
The Myth and the Reality
The “pre-earnings IV ramp” is misunderstood phenomena in options. The popular story goes: “IV rises into earnings, so buy straddles early and sell when IV peaks.” It sounds like free money. It isn’t.
Option implied volatility before earnings is a blend of ambient volatility (normal daily movement) and event volatility (the anticipated earnings jump). As each trading day passes, you’re “consuming” an ambient variance day. The event’s fixed chunk of variance stays the same, but it now sits over fewer remaining days. In variance space, total variance actually decreases. But because IV is quoted as an annualized number, the annualization math makes IV appear to rise.
The visible “ramp” in IV is largely mechanical. Simply buying a straddle and watching IV tick higher does not automatically produce profits. Your theta decay can easily eat the gains from the apparent IV increase, because total option value might not be changing much at all.
Sinclair addresses this concept in Volatility Trading when discussing the decomposition of implied variance into ambient and event components. Jeff Augen covers the same mechanical ramp in Trading Options at Expiration. The core point from both: you cannot trade the ramp blindly. The edge, if it exists, has to come from somewhere else.
Where the Real Edge Lives
The actual opportunity is not in the mechanical ramp. It’s in the repricing of event volatility itself.
Sometimes the market underprices a specific earnings event relative to the stock’s historical norms. When the current implied move is cheap compared to past events, there’s room for the market to reprice that event higher as the announcement approaches. That repricing generates genuine vega profits for straddle holders.
The data analysis behind our Pre-Earnings screener examined this systematically. The key predictors of pre-earnings straddle returns all center on one question: how does the current implied move compare to historical benchmarks?
The strongest signals include the current implied move versus the average realized move across all past earnings, the current implied move versus the average historical implied move, and the current implied move versus the last event’s realized move. The direction is consistent: when current implied is low relative to history, long straddles perform better. When it’s high, they perform worse.
Buying options before earnings is a convex trade, so expect a lot of small losses with occasional large payouts. Keep in mind this kind of sucks because you are buying expensive options before earnings, and you want to exit before the event since that is not what you are betting on.
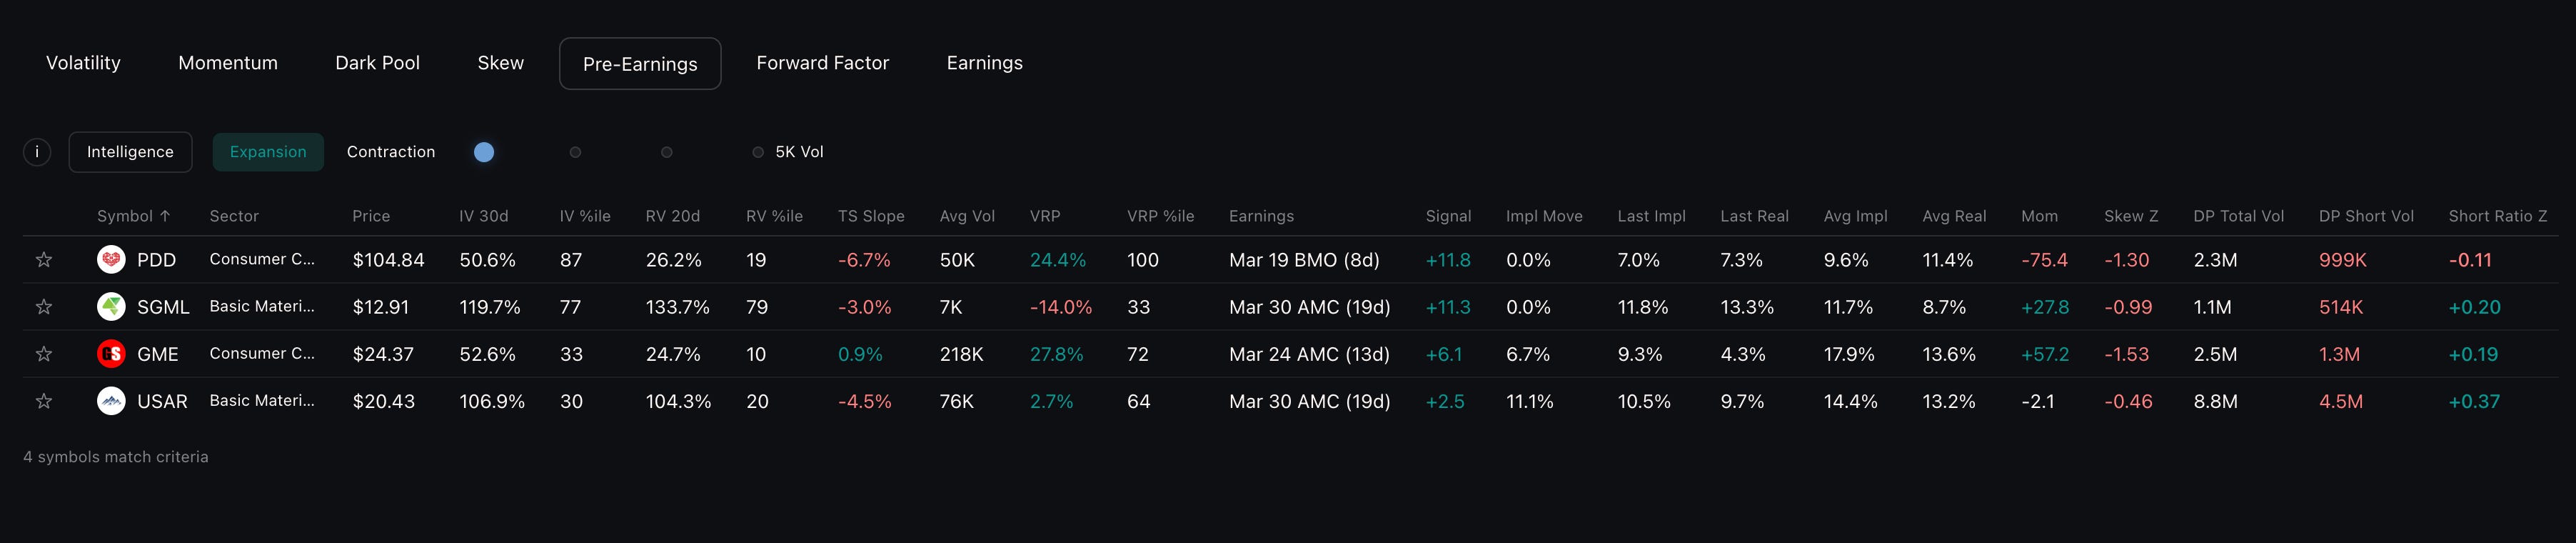
Because of that, you should focus on stocks with strong momentum already in place coming into earnings and very low VRP, ideally negative, but that will be quite a challenge to find.
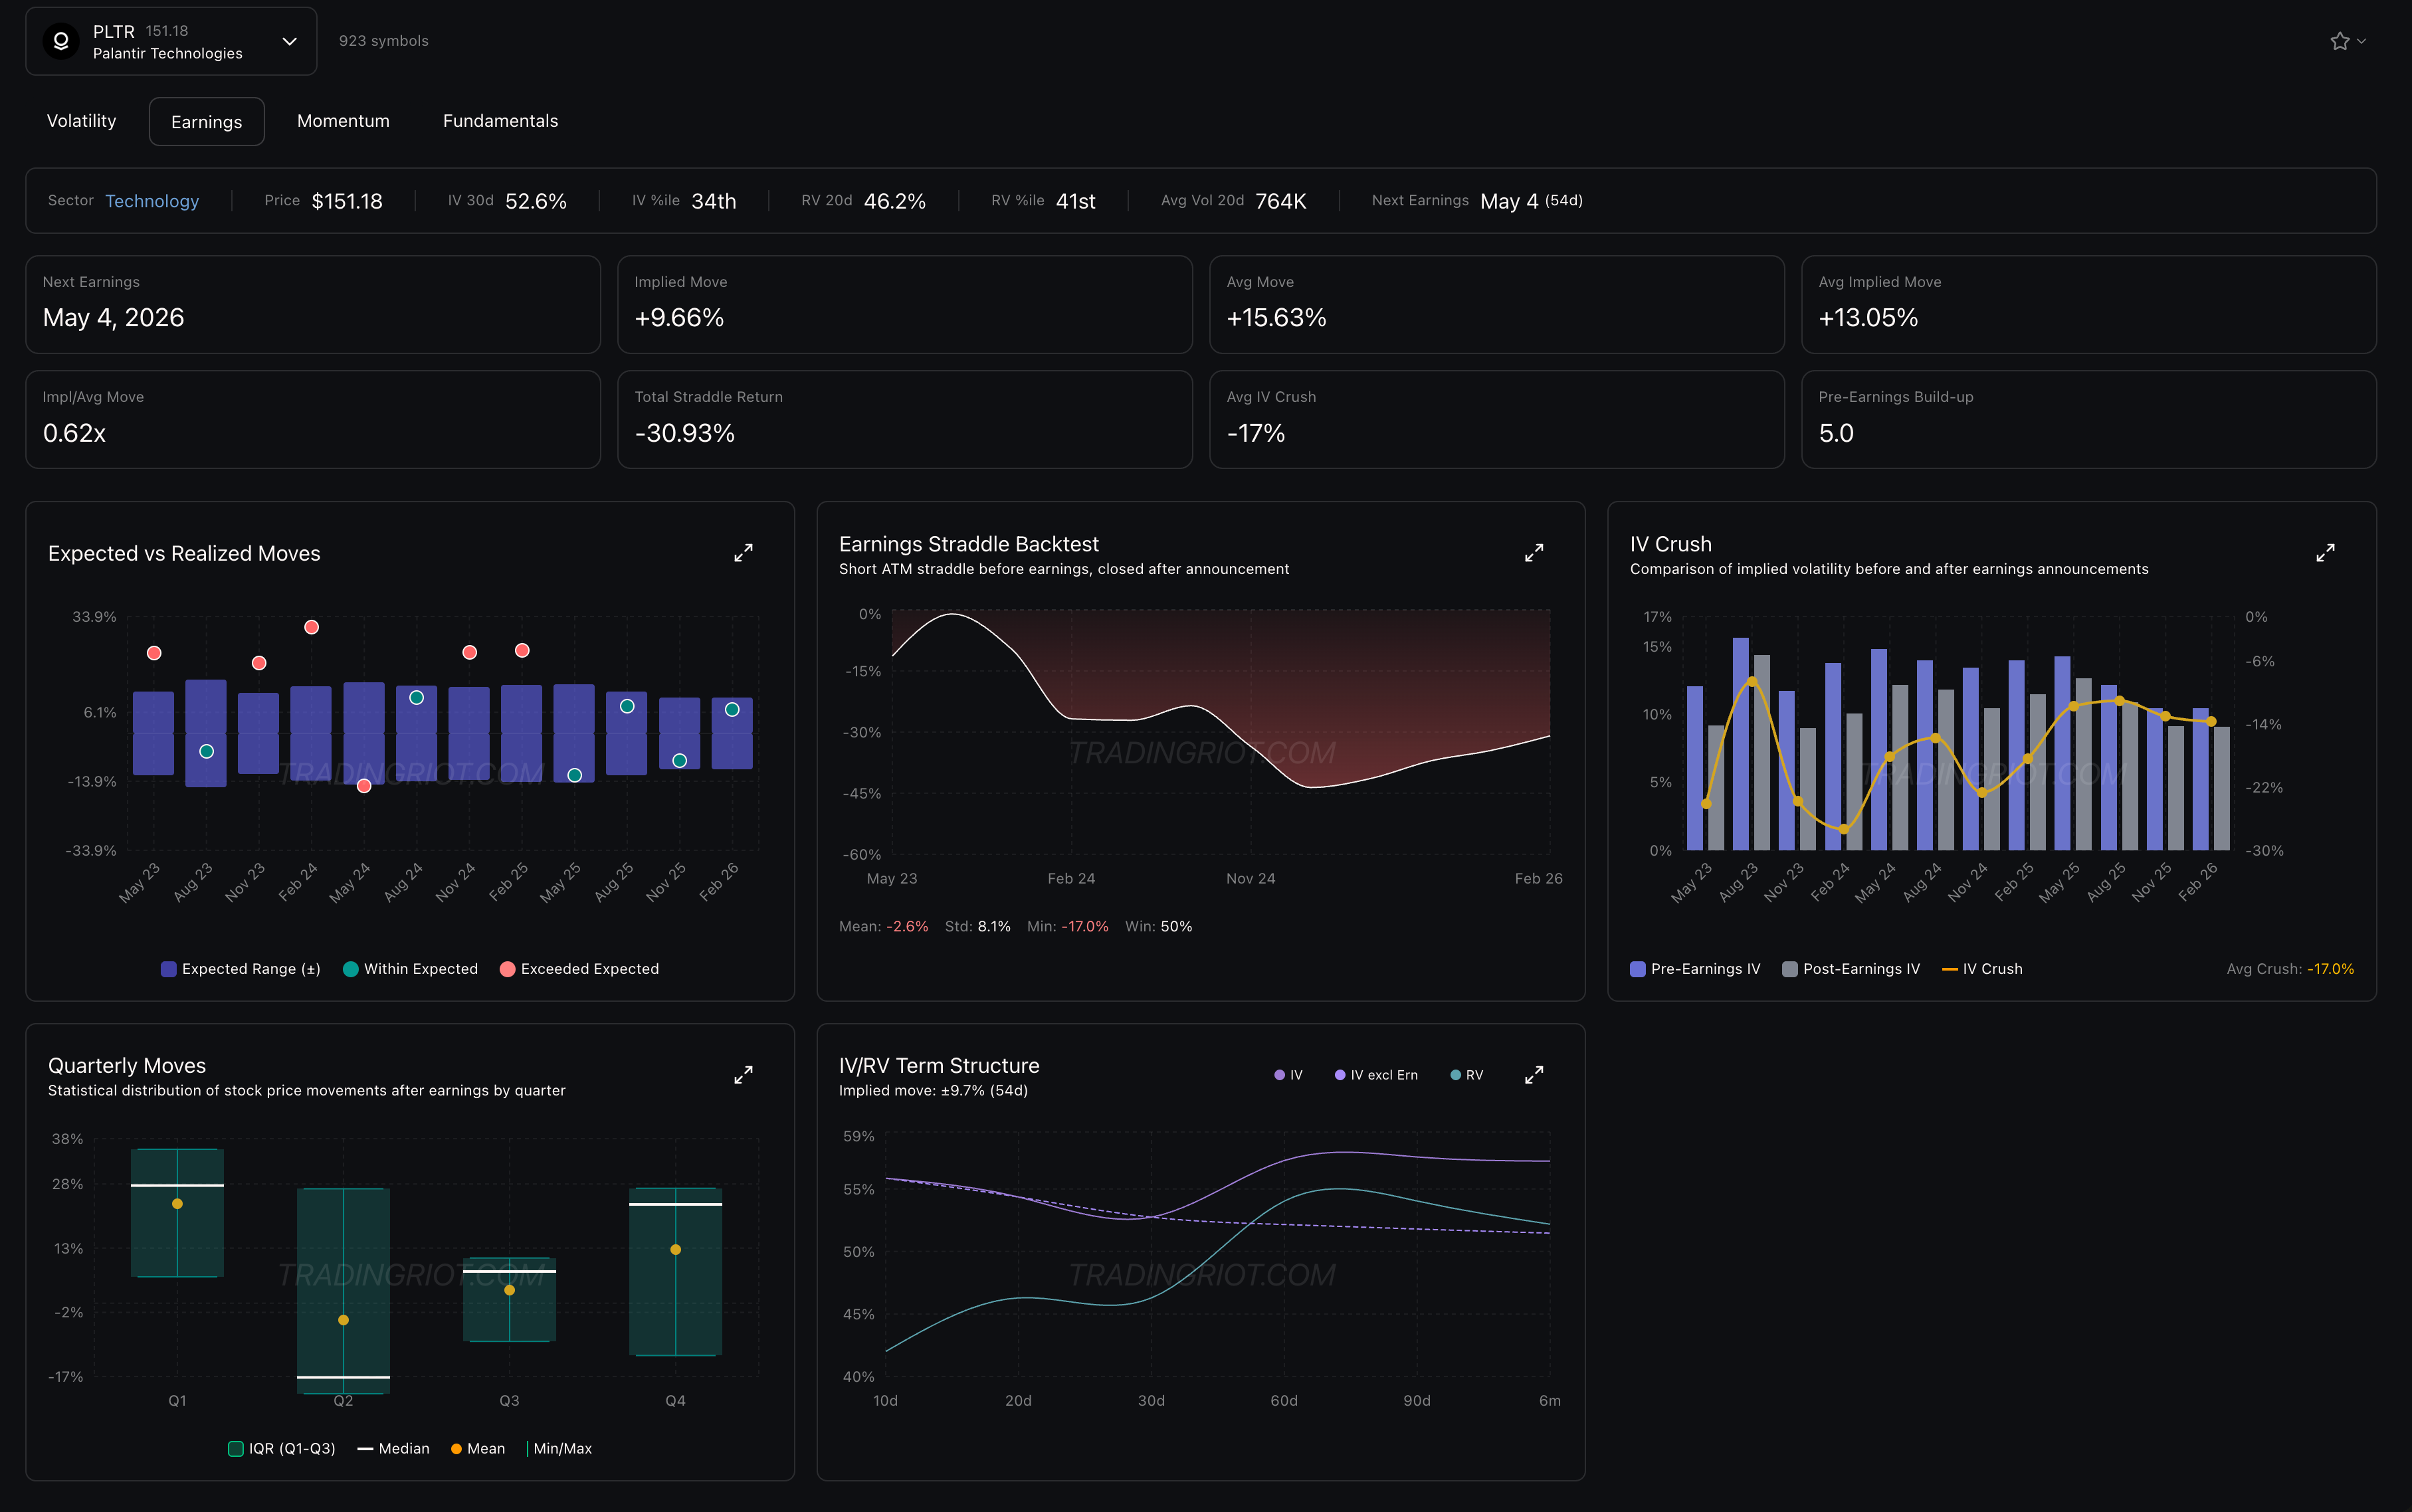
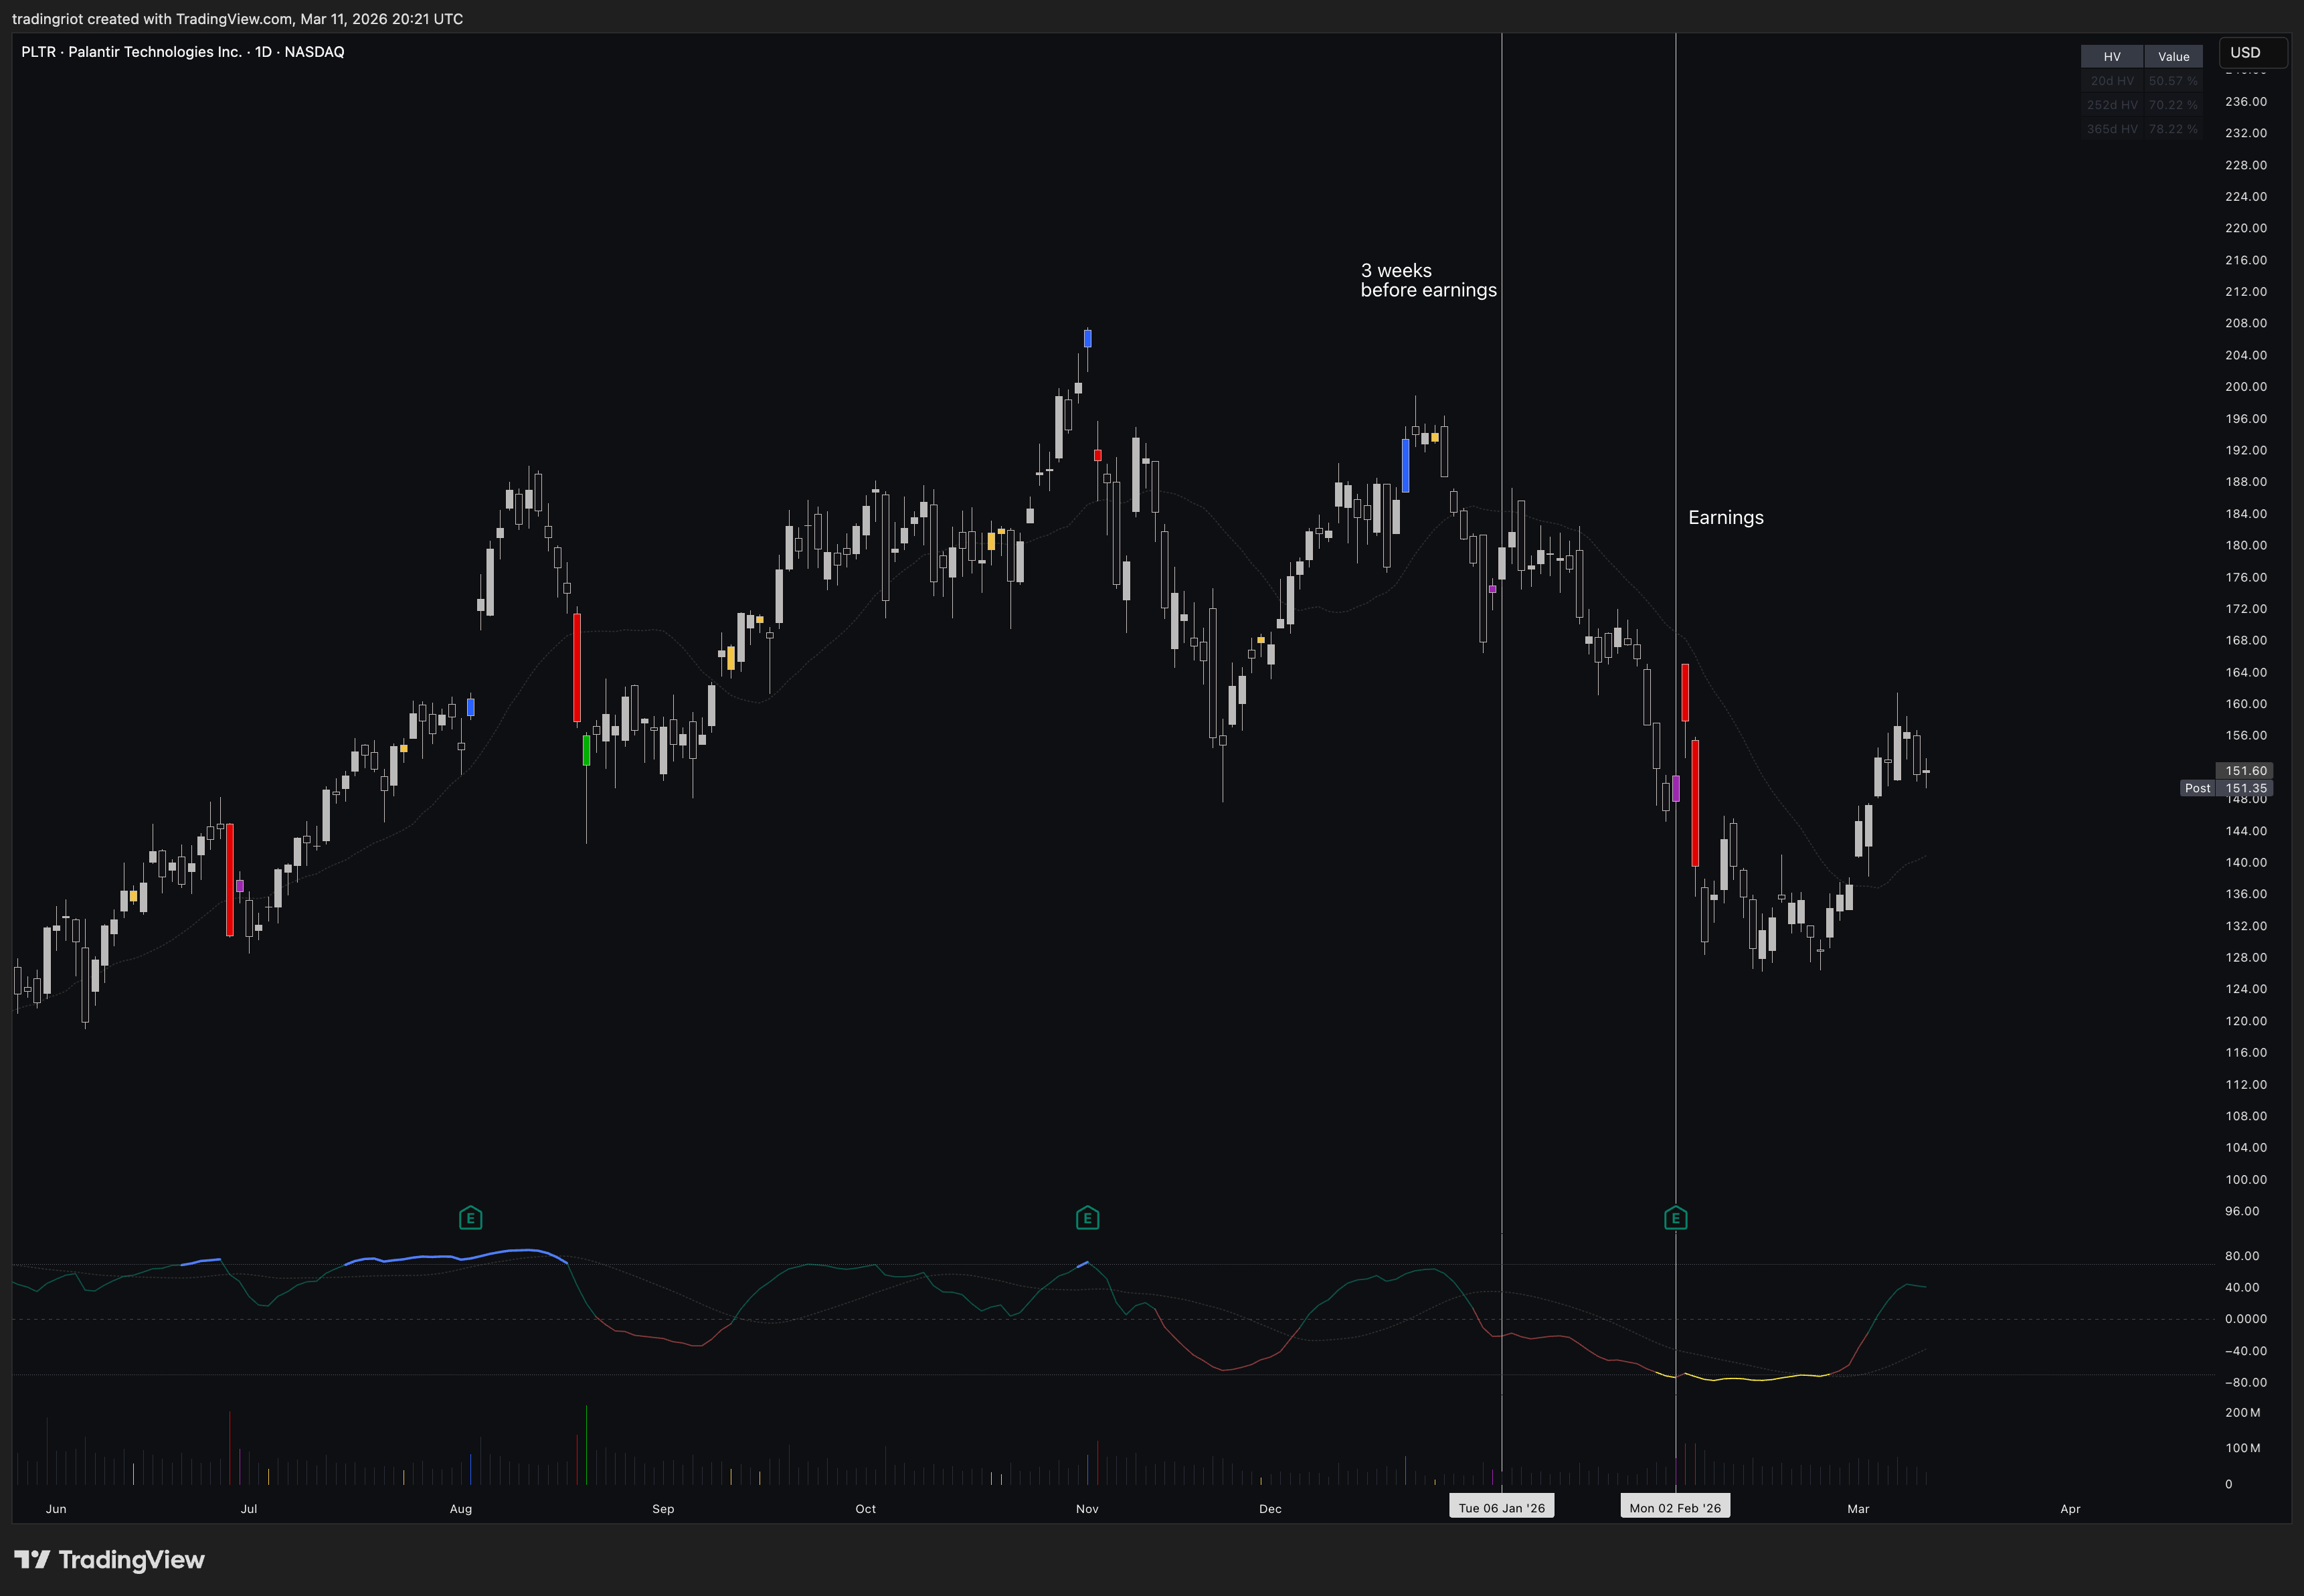
As an example, I took a trade in Palantir recently before earnings. This is the perfect candidate: the implied move is way lower than average, and while the last few earnings ended up within the expected boundaries, the blowouts are significant.
This might be a very unpopular thing to say among all the true vol-trading fans who believe in the efficient market hypothesis and the idea that you can’t predict movements in any way.
When I am buying volatility, I am not the biggest fan of buying both puts and calls. I much prefer using momentum and simple technical analysis to bet on direction. The reasoning is straightforward: a long ATM straddle costs double what a single put or call does. If you already have a directional view, paying for the other leg is dead weight that just bleeds theta. Since these are convex trades where most attempts lose, keeping the cost of each attempt low matters, but obviously you do you.
The Short Vol Variant Before Earnings
The pre-earnings window works both ways. When the current implied move is expensive relative to historical norms, the opposite trade makes sense: selling straddles 1-3 weeks before earnings.
The same model’s “Short Vol” signal identifies stocks where event volatility is significantly overpriced. The thesis: IV will not expand further, or the expansion is already priced in. You collect premium from elevated IV and close before the actual announcement.
This is where VRP (Variance Risk Premium) becomes especially critical. For the short vol variant, you want IV extended well above realized volatility, giving you a cushion. For the long vol variant, you ideally want low or negative VRP, where the stock is actually moving but options haven’t caught up yet.
When historical data shows that a stock has consistently overpriced its implied move across multiple quarters, the short pre-earnings straddle can even be held through the announcement itself. You’re combining the pre-event premium capture with the post-event vol crush on a name where the market systematically overestimates earnings risk. This is higher risk, but also brings the additional benefit of post-earnings IV-crush.
In Conclusion
Earnings events bring distinct trading opportunity. Selling straddles at the event captures the short-term overpricing of jump risk. Buying straddles weeks earlier captures the repricing of undervalued event uncertainty. Selling straddles weeks earlier captures the overpricing of event uncertainty that won’t expand further.
These are different strategies with different risk profiles. The earnings event trade is concave (small wins, occasional big losses). The pre-earnings short vol trade is also concave, but compared to the earnings event trade, the further dated options are less sensitive to gamma. That means a single overnight gap won’t hit as hard. The risk shifts instead to the stock trending against you over multiple days before the event, whether through a sustained rally or a slow bleed lower. The pre-earnings long vol trade is convex (many small losses, occasional big wins).
What they share: the edge comes from volume and diversification, not from any single trade. But every one of them requires discipline, proper sizing, and the emotional resilience to sit through inevitable drawdown periods.
Pick good markets to trade and let the law of large numbers do the work.
Something which was identified in 1970 and persisted in 2 of sinclair books which are read by every options trader and yet we believe this inefficiency exists in our efficient market. Very well written article but author himself put hopes on volume and diversification of trades for this to work !! Reminds me of the famous Hope and Pray index. And one need a lot of historic data from 3rd party vendor to run this on volume of diversified trades before one finds out whether it works or not. I will better be a seller of this historic data to options traders- that's the edge I see.
Great article, Adam, thank you very much!