
When Bitcoin Bottoms
Quick dive into correlations, pairs trading and historical turning points for Bitcoin

Crypto market is not too hot at the moment. While stocks and metals reached all-time highs, crypto has been on the pain train since October of last year.
We’re seeing a lot of “rotation from metals to crypto, coming any day” posts on the timeline. Unfortunately, people who post such things are well-known mouthbreathers whose only profitable PnL comes in the form of monthly X engagement checks.
I want to spend some time analyzing if this "rotation from metals" actually has any substance (spoiler alert: it doesn't), and then share some historical turning points for crypto and how you could spot them.
All analytics in this article are powered by TradingRiot Analytics. Sign up to access data for 1,000+ futures, crypto, stocks, and ETFs, plus education on turning data into strategies.
Bitcoin and Gold relationship
The first obvious issue with finding a relationship between gold tops and Bitcoin performance is that gold didn't really have many tops in the last decade.
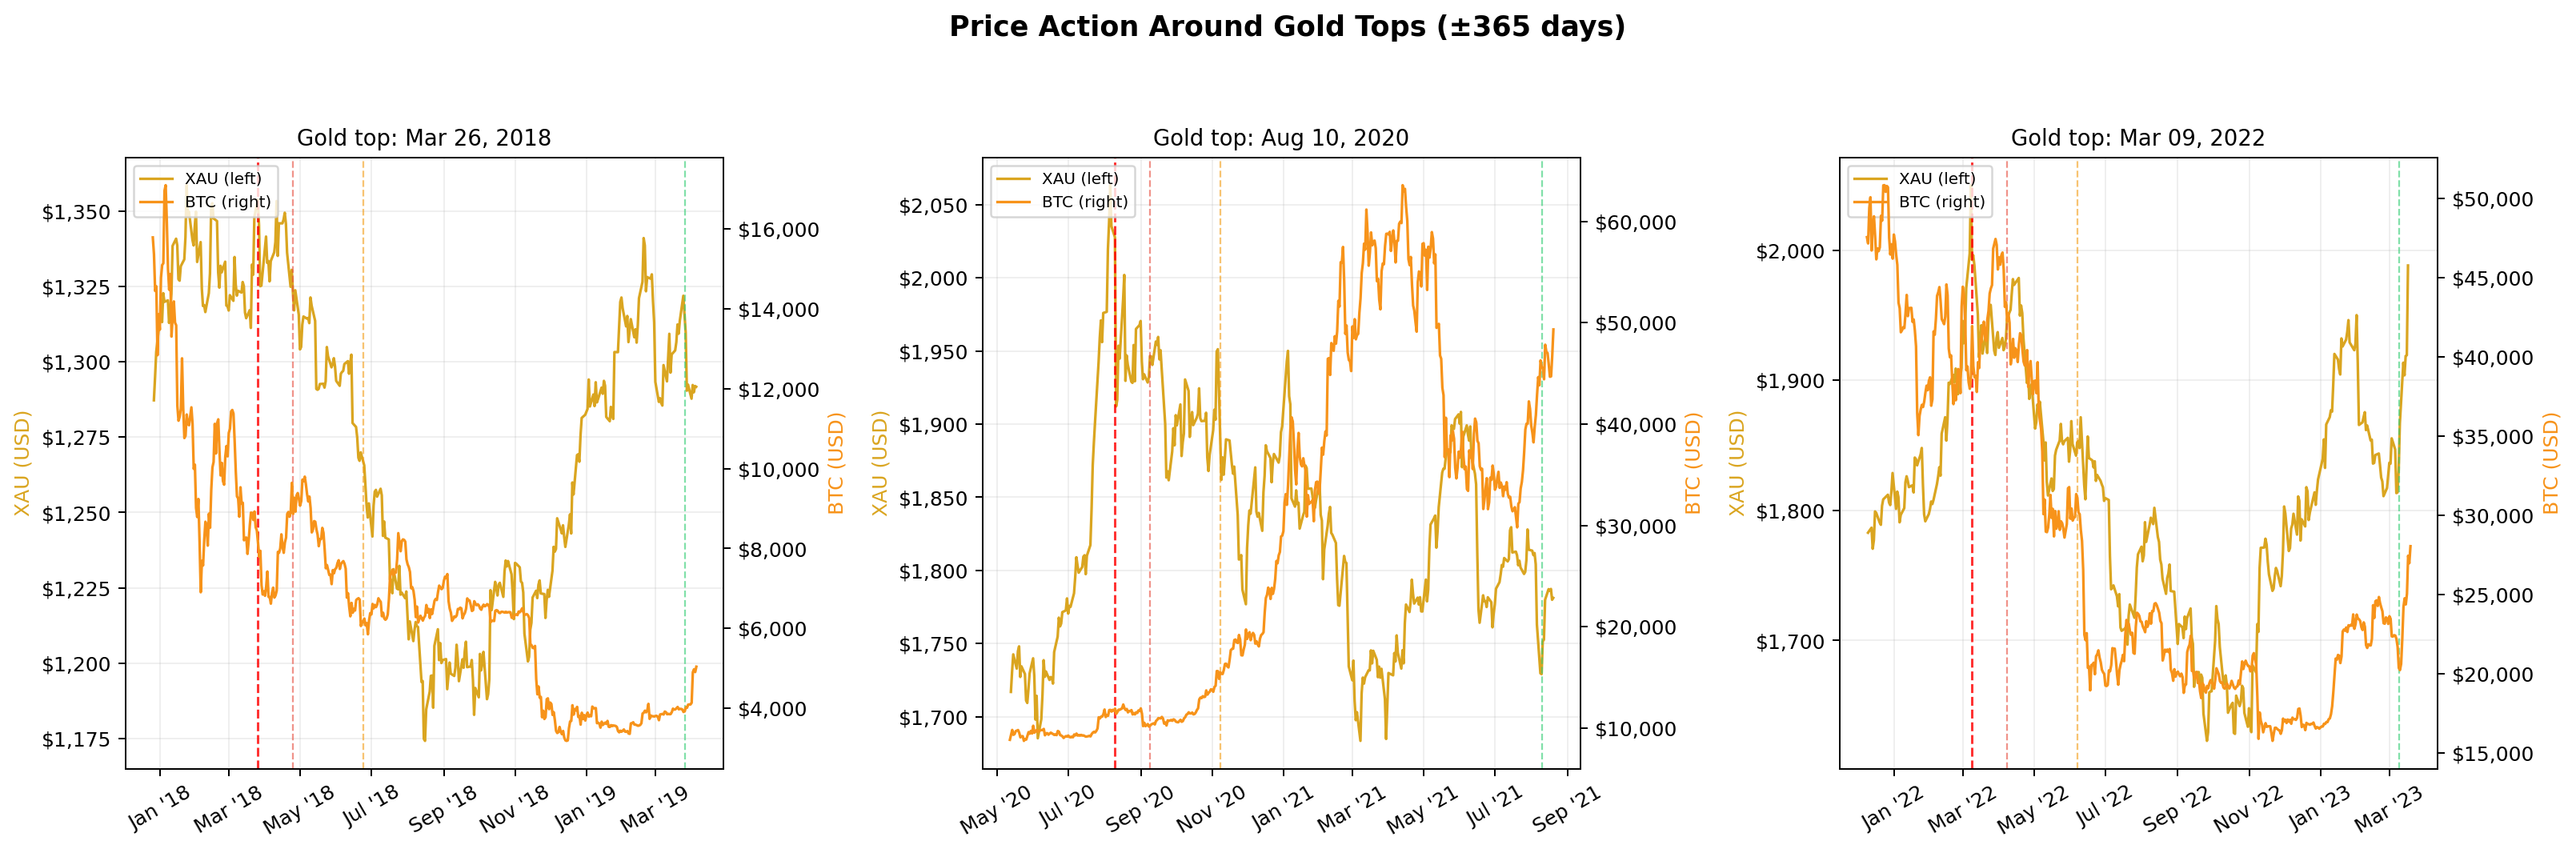
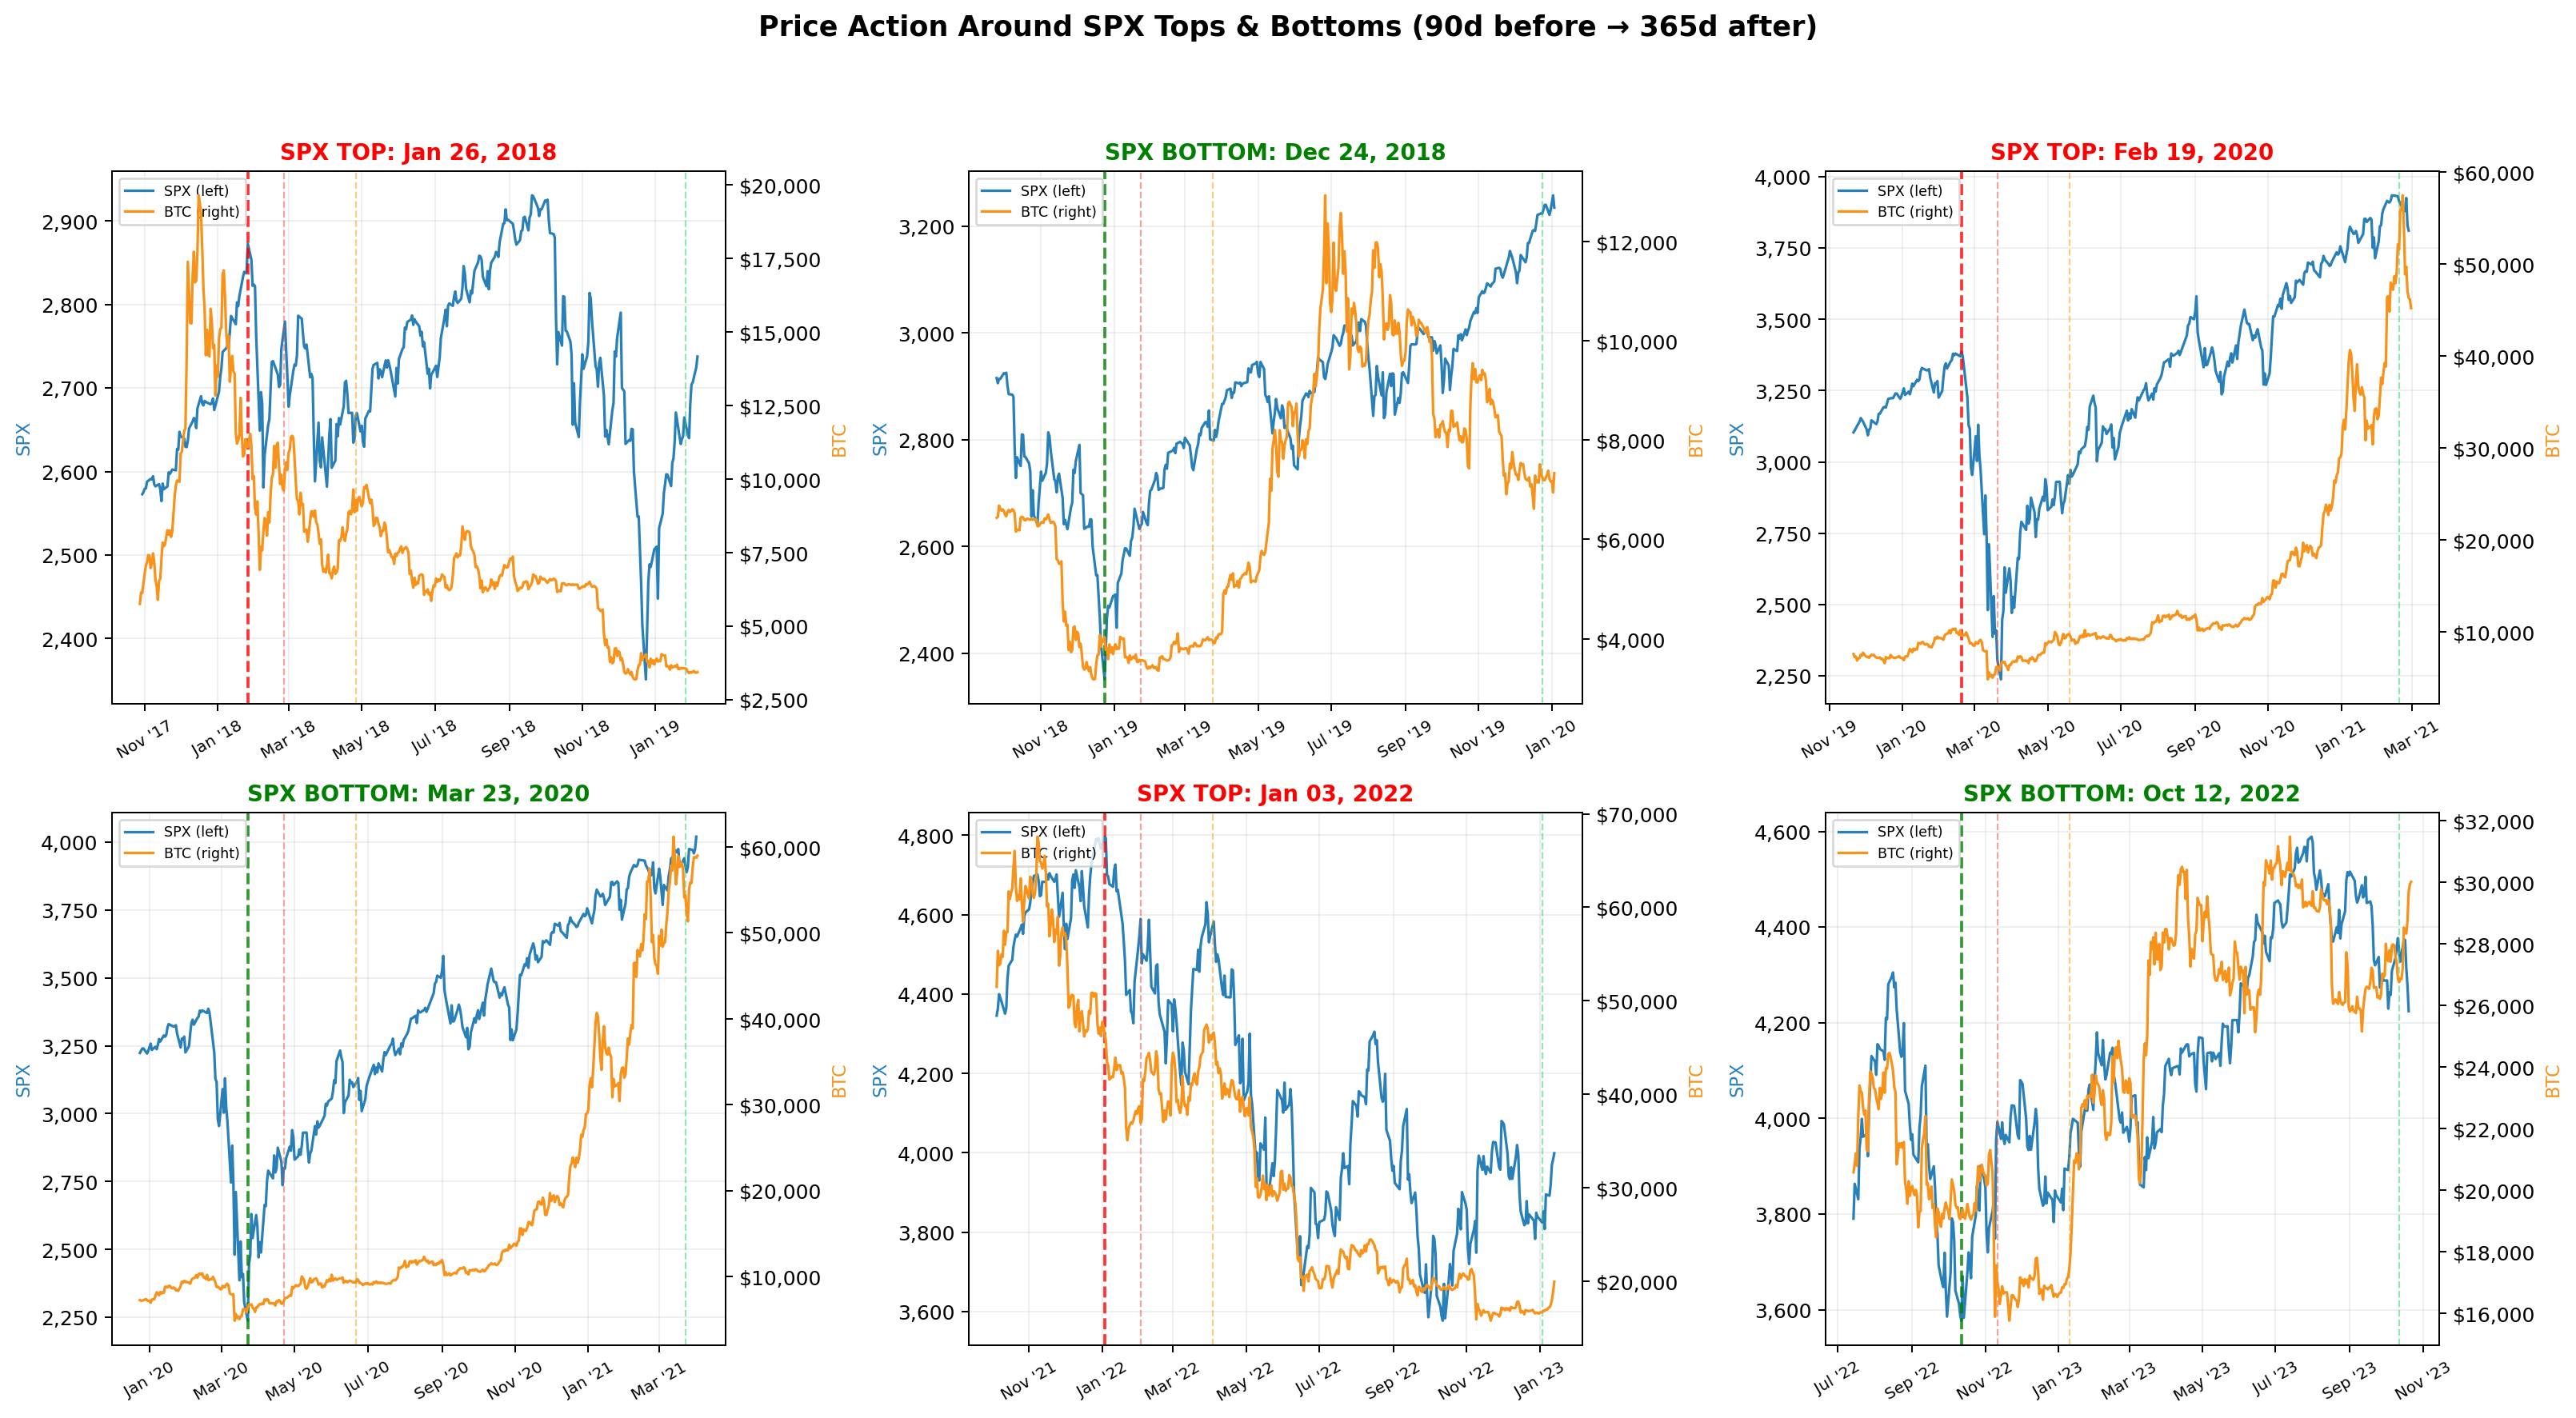
As much as hopium is awesome, when making claims on the internet, it’s good to have data backing them up so we don’t sound like complete morons. In the last 10 years, gold had three decently sized corrections: 2018, 2020, and 2022. Three data points. That alone would be enough for me to not bother further, but for the sake of this article, let’s dig in anyway.
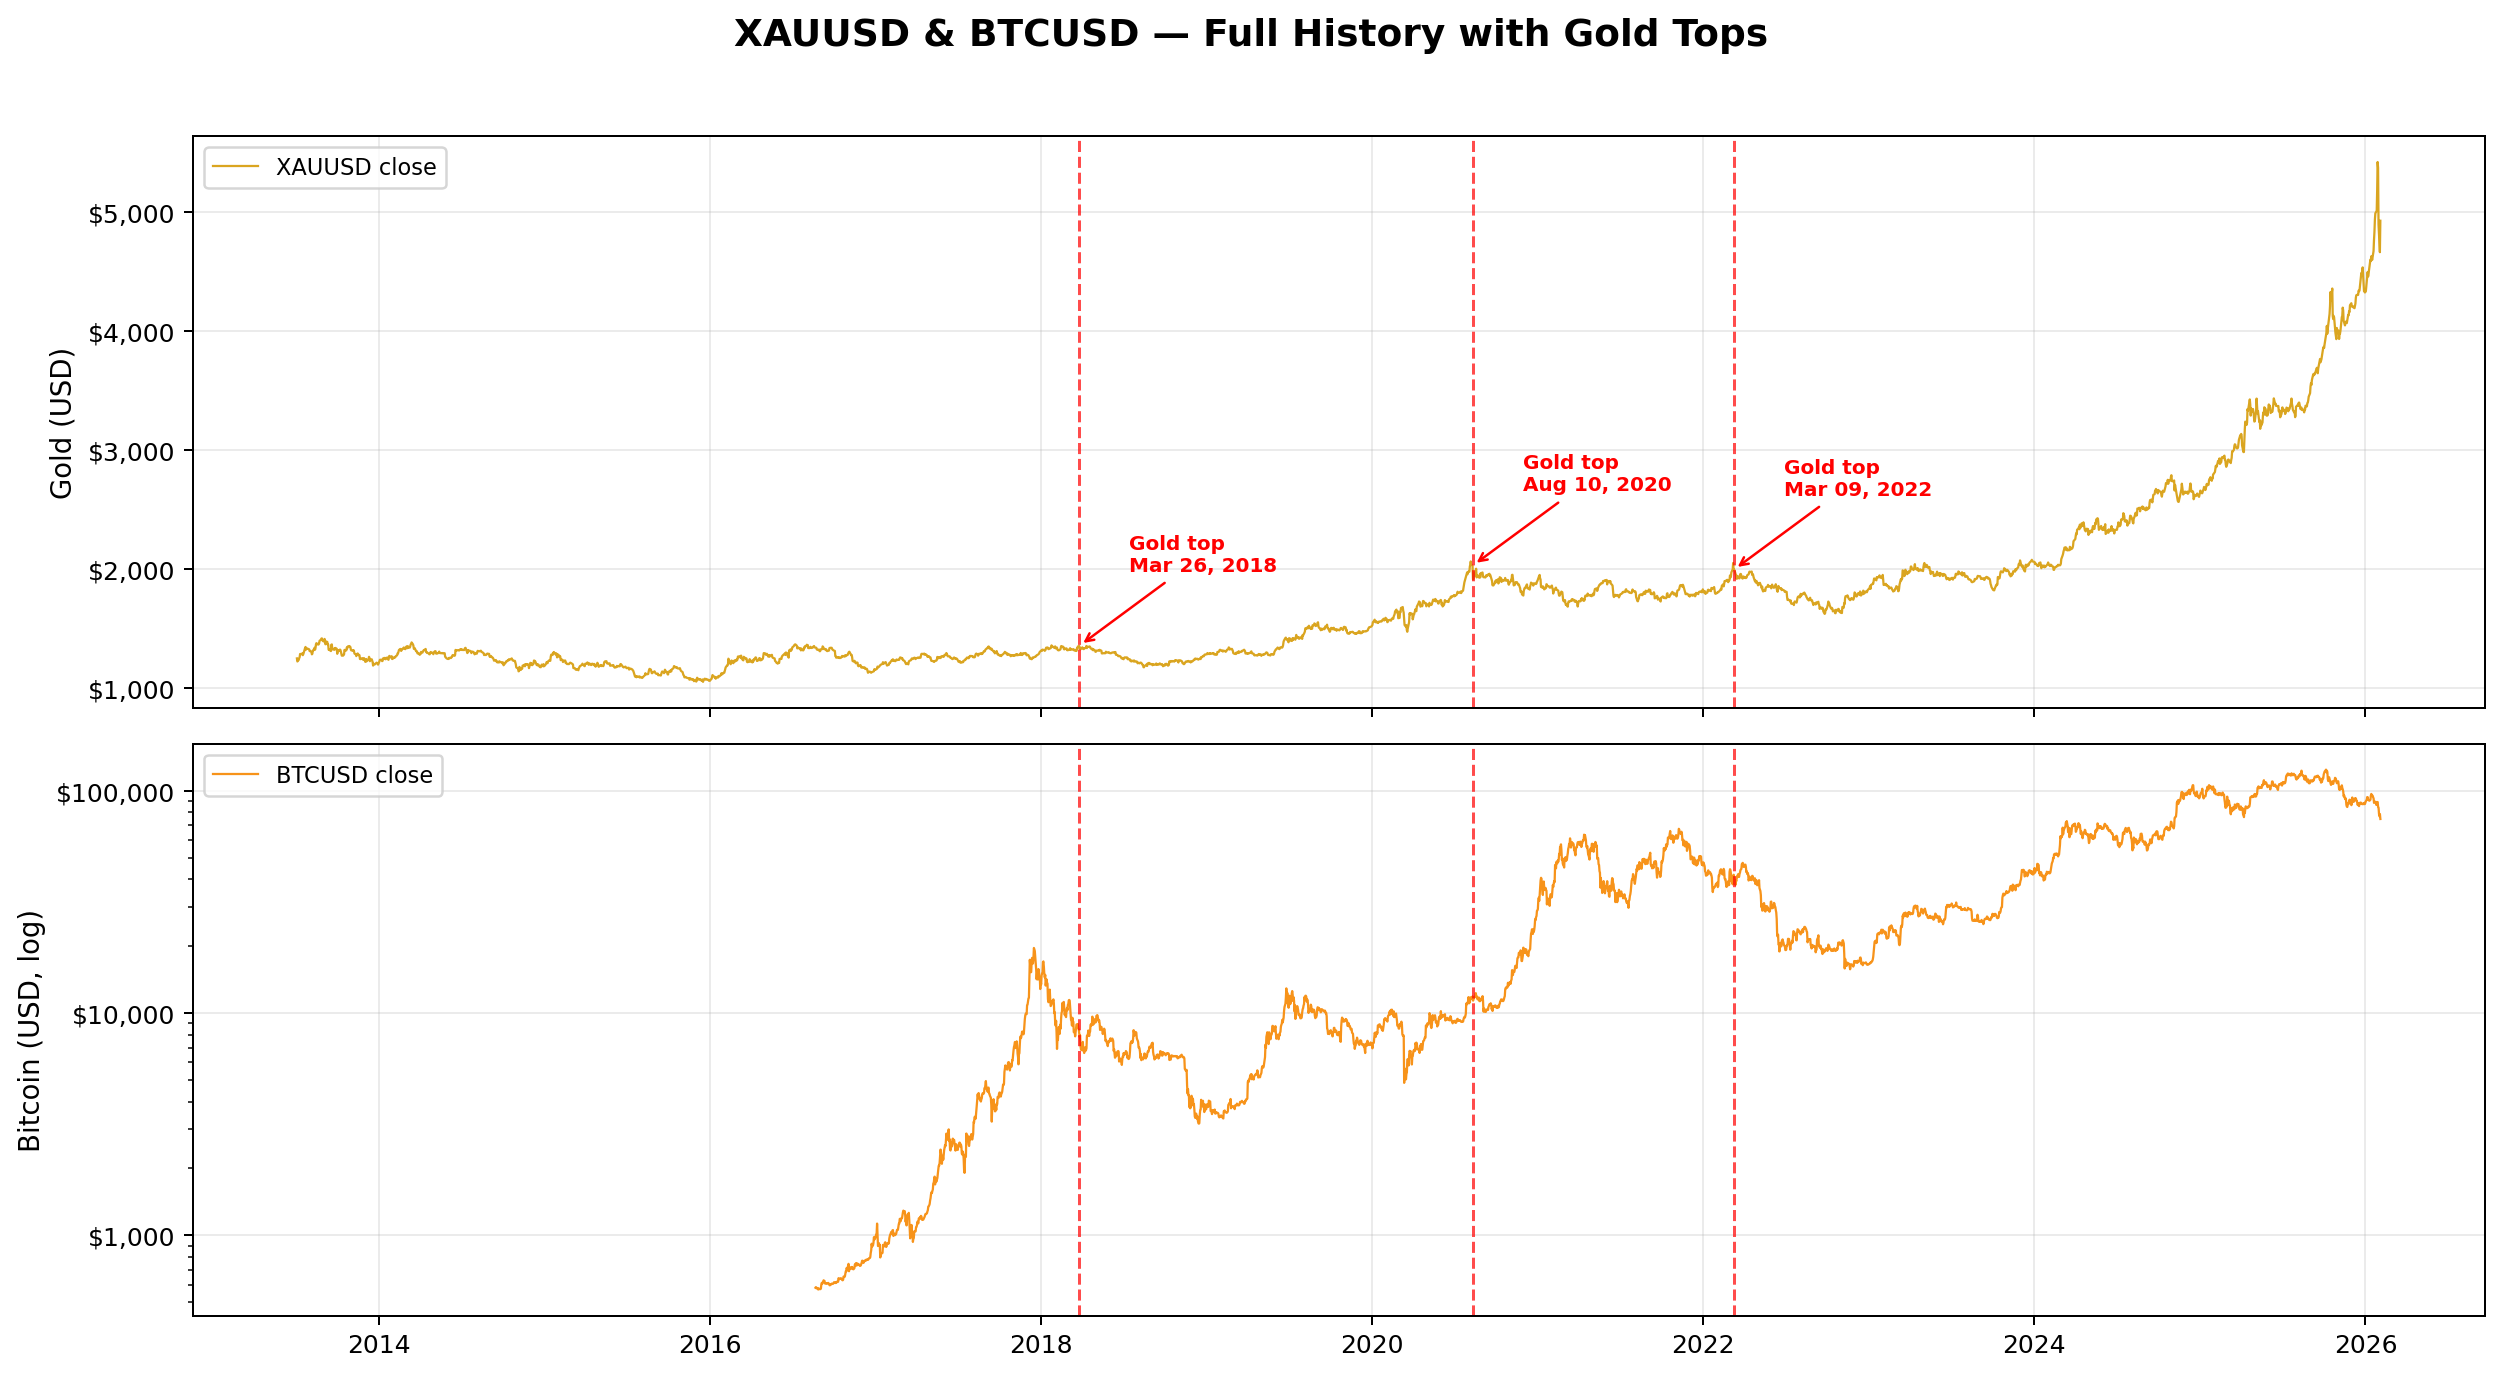
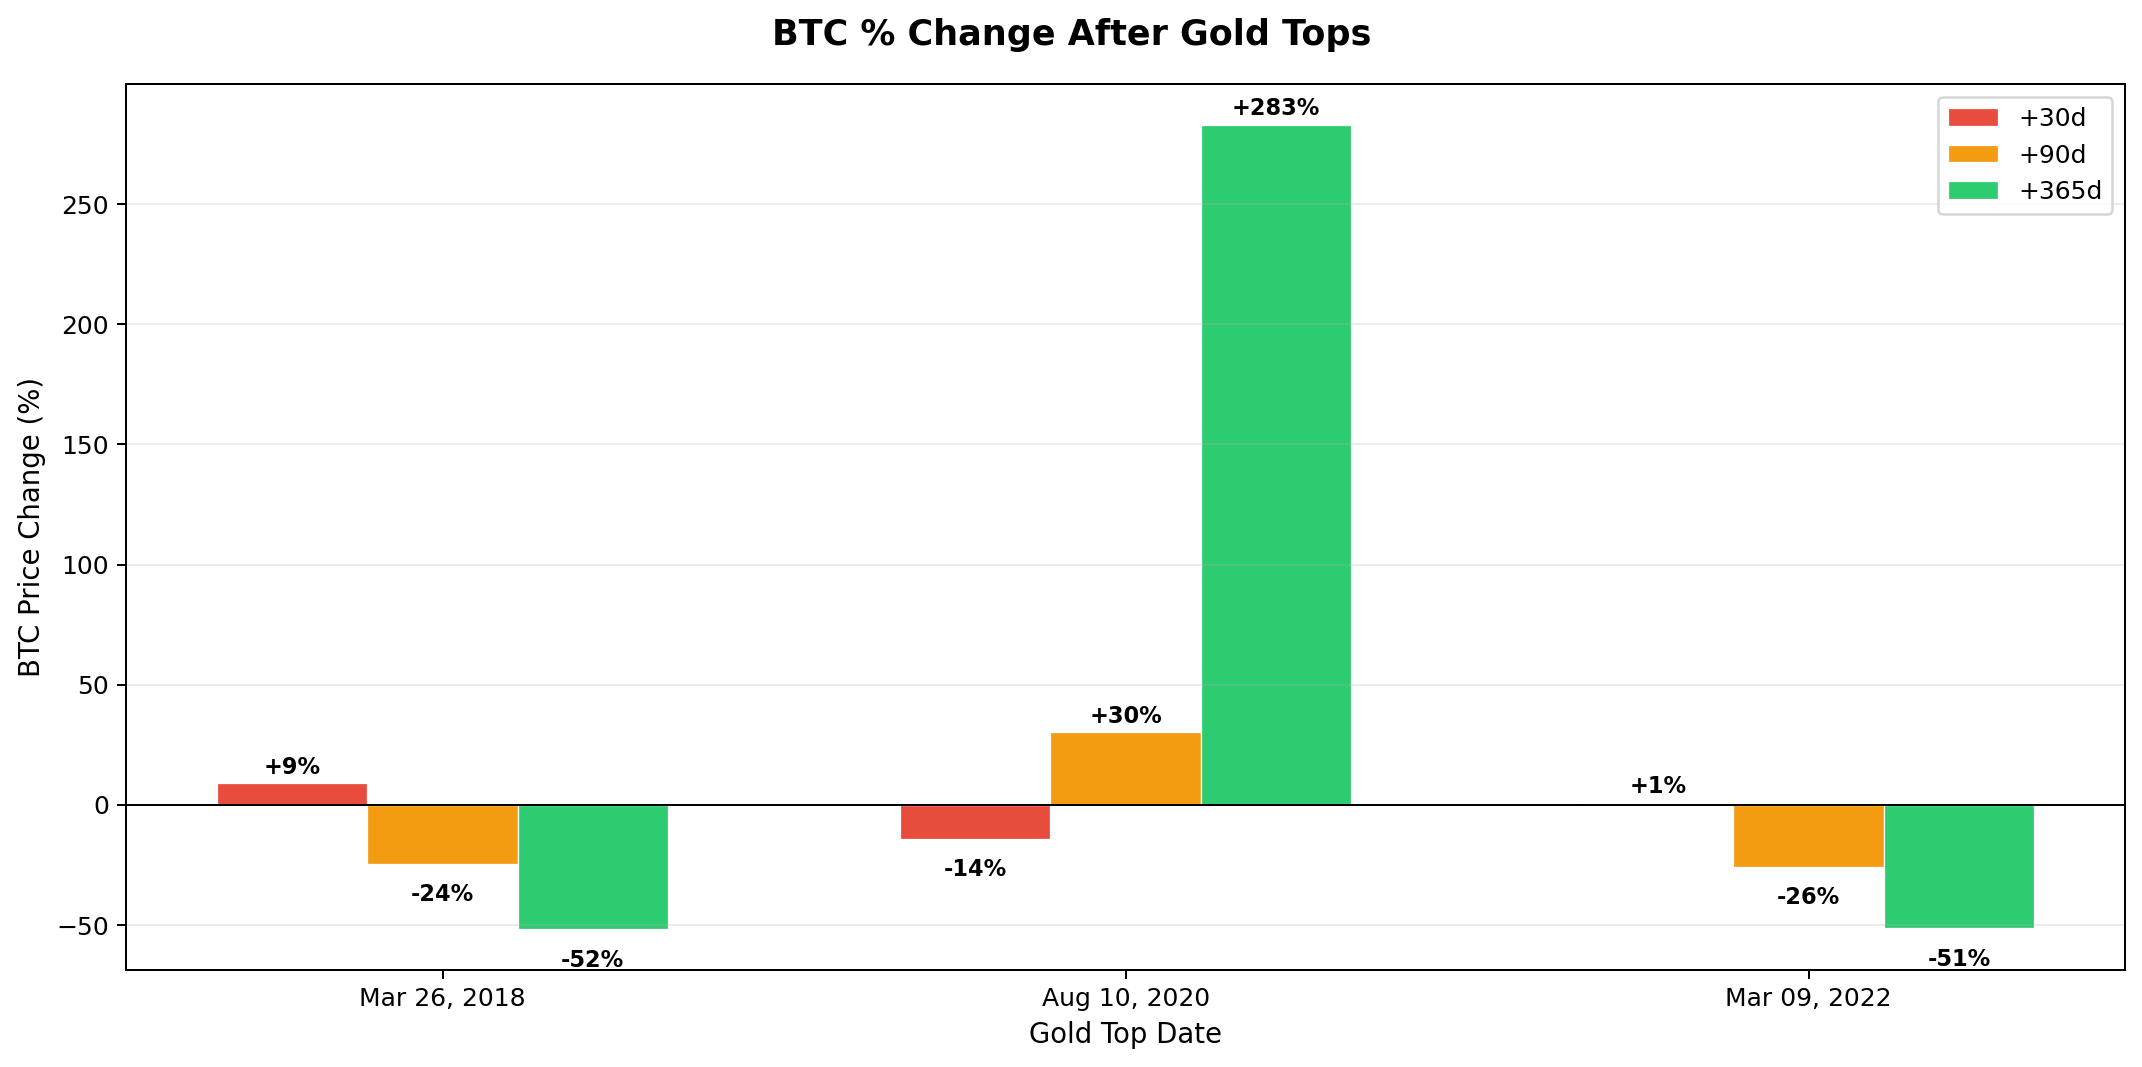
If you look at the chart above, two out of three gold tops actually preceded a BTC downtrend, 2018 and 2022. The only time Bitcoin rallied was during the risk-on craze of 2020.
The all-time correlation over about 10 years of data is 0.8, which makes sense since both markets went up over time. But correlation doesn't tell you what you actually want to know here. When you want to explore if two assets have this desired relationship of reverting when one outperforms the other, you need to look at cointegration.
Cointegration
Correlation measures whether two assets move together day-to-day. Cointegration is different, it asks whether two assets maintain a stable long-term relationship that snaps back when it gets stretched. Think of it like two drunk friends walking home: they might wander all over the place individually (non-stationary), but if they’re tied together with a rope, they can’t drift too far apart. That’s cointegration.
For the “rotation” narrative to have any substance, you’d need BTC and gold to be cointegrated, meaning when gold rips and BTC lags, there’s some actual force pulling them back together.
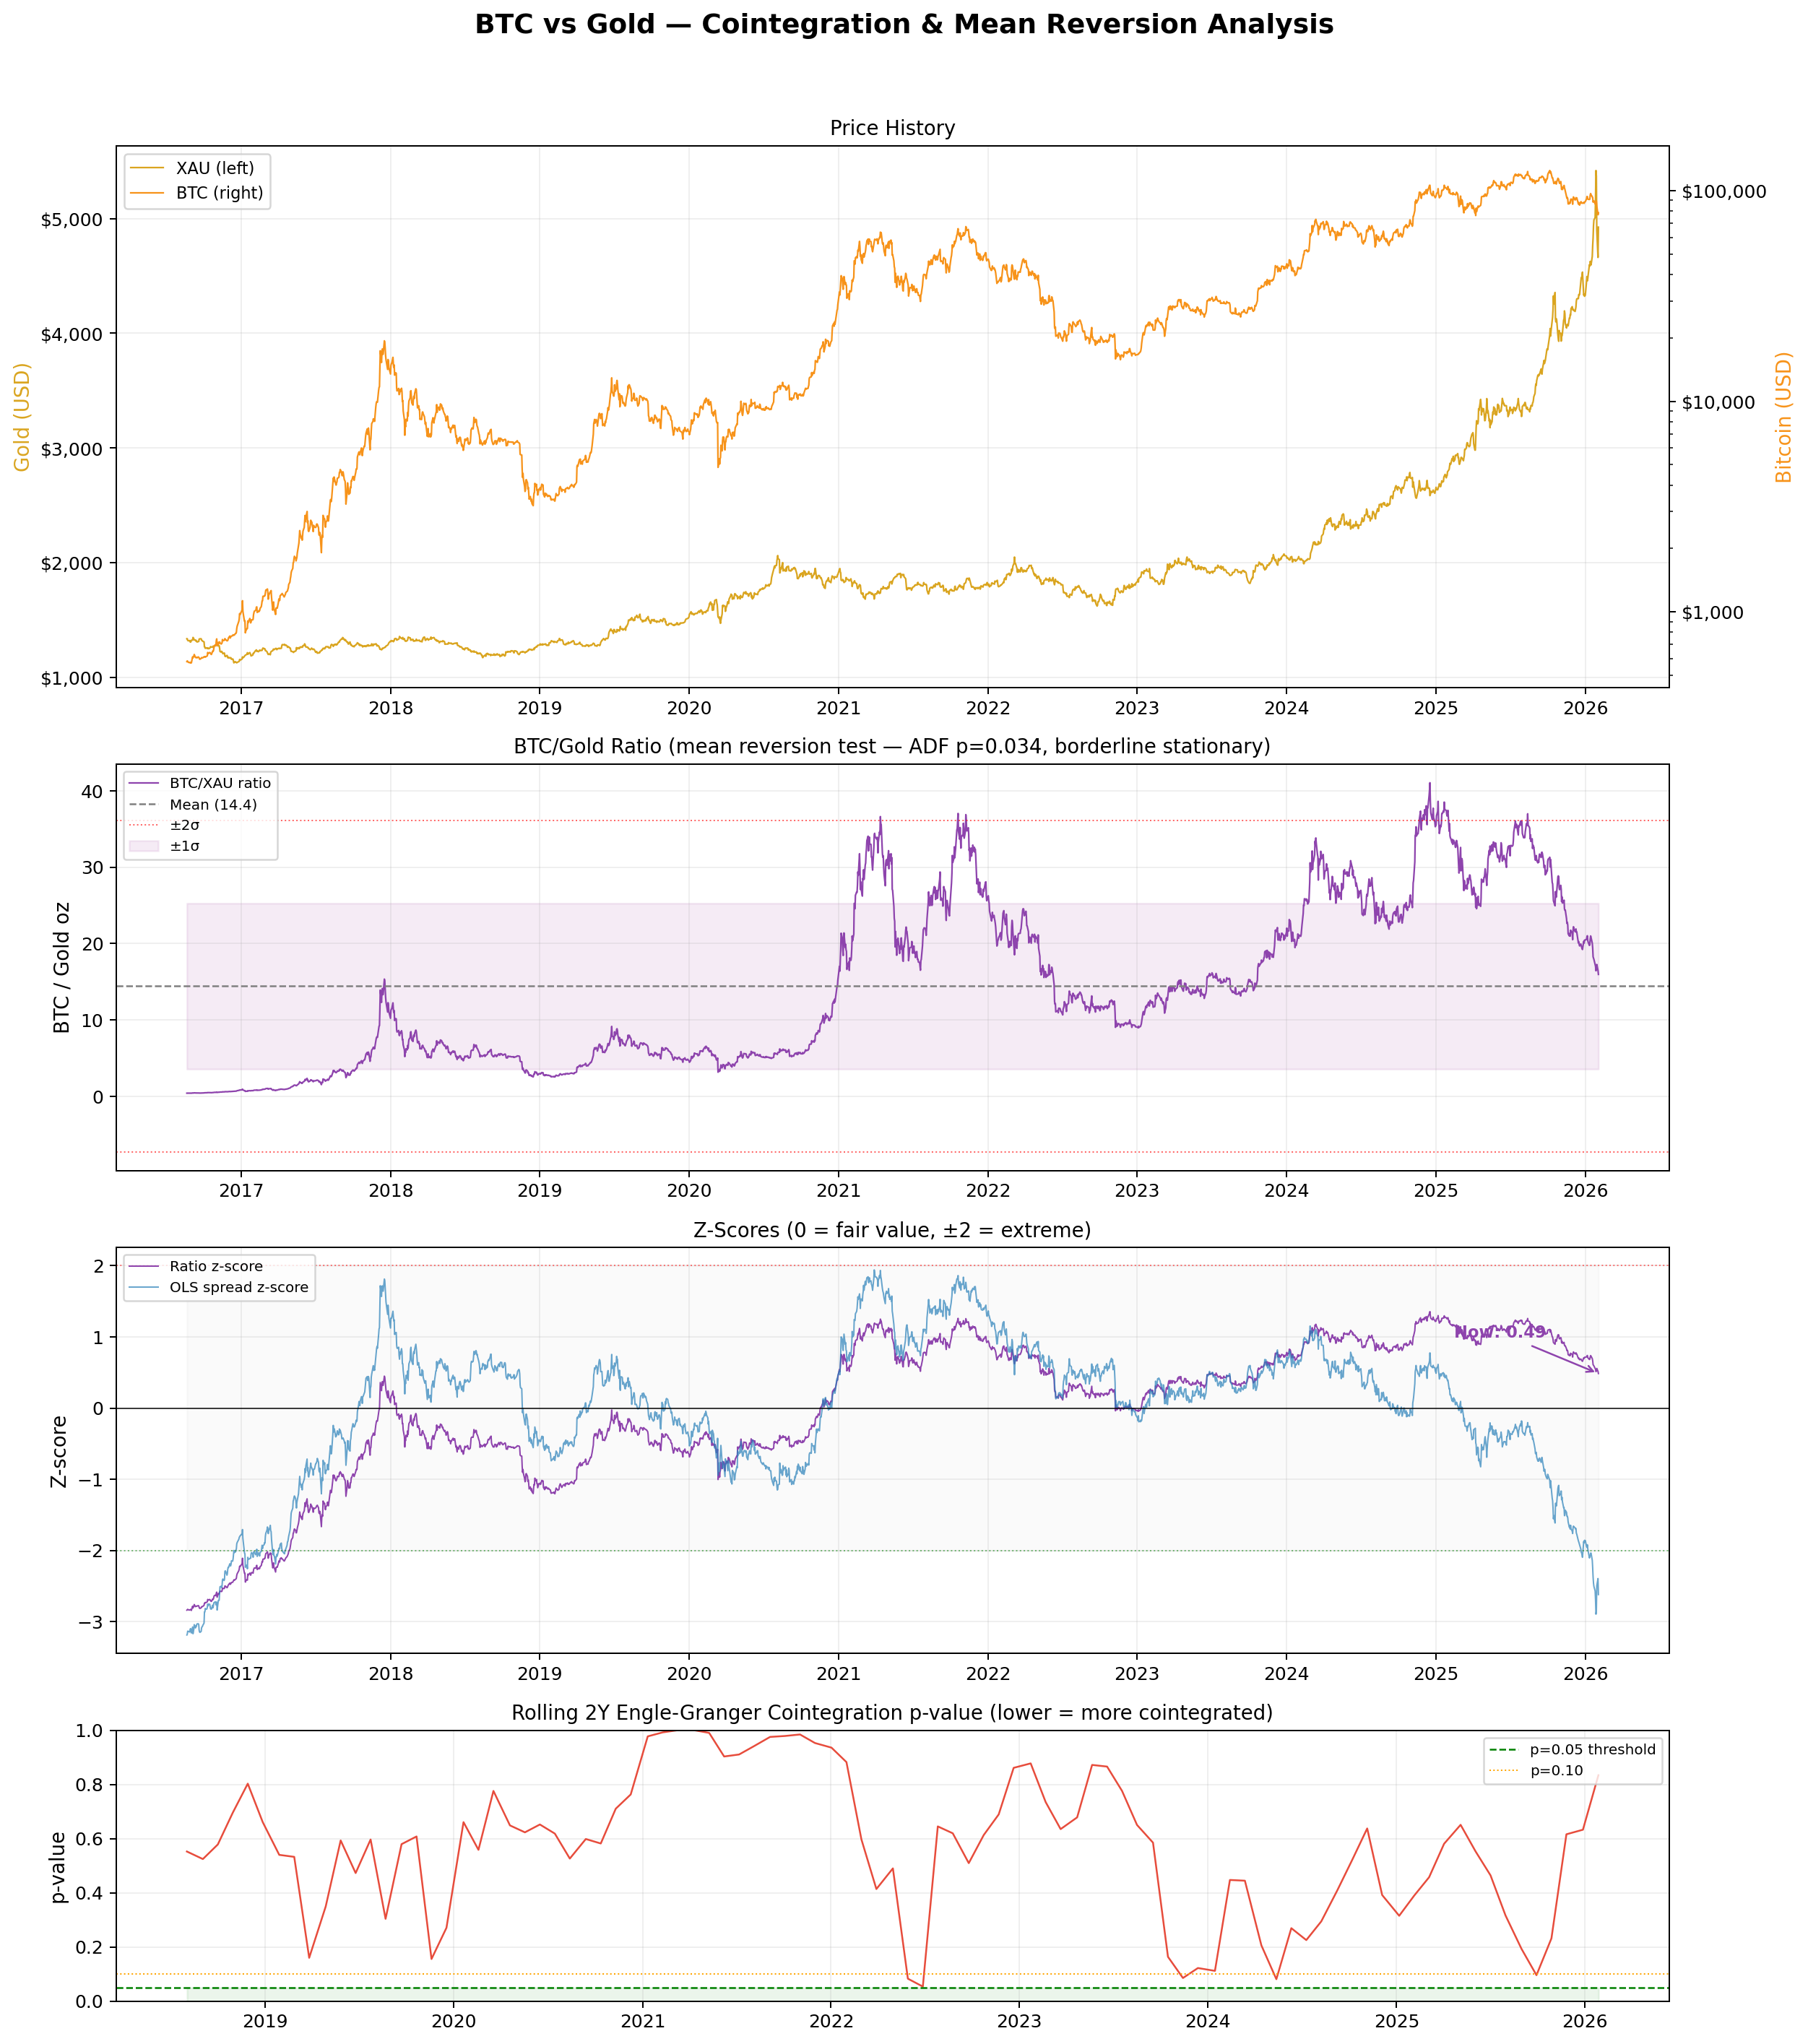
Looking at the chart above, here’s what the data actually says:
The Engle-Granger cointegration test finds no cointegration. Full sample p-value is 0.44, nowhere near the 0.05 threshold you’d need. Rolling 2-year windows show 0 out of 31 periods with cointegration at 5% significance. The spread residual is non-stationary.
The simple BTC/Gold ratio tells a slightly more optimistic story, but not by much. The ADF test on the ratio is borderline stationary (p = 0.034), suggesting the ratio may weakly mean-revert. But the half-life is around 216 days, roughly 7 months. That’s glacially slow and buried in noise.
Currently, BTC is priced at about 16 ounces of gold, which is 11% above the historical mean of 14.4. The z-score sits at -2.62, meaning BTC looks “cheap” relative to gold by historical standards.
But here’s the thing: that reading is largely driven by gold’s recent parabolic move, not some reliable mean-reverting relationship pulling them together. There’s no robust cointegration. They’re fundamentally different assets, gold is a mature safe haven, BTC is a volatile risk asset that happened to trend upward over the same period.
For those of you that have zero clue what any of that means, here is a quick stats primer.
The Engle-Granger test is the standard way to check for cointegration. It works by fitting a regression between two assets, then testing whether the residuals (the “spread” between them) are stationary, meaning they fluctuate around a stable mean rather than wandering off forever. If the residuals are stationary, the assets are cointegrated.
The ADF test (Augmented Dickey-Fuller) is what actually checks for stationarity. It tests whether a time series has a unit root, fancy way of saying “does this thing trend or mean-revert?” A low p-value (below 0.05) means you can reject the unit root hypothesis and conclude the series is stationary, i.e., it mean-reverts.
Half-life tells you how fast that mean reversion happens. If a spread has a half-life of 30 days, it means when the spread gets stretched, half of that deviation will correct in about a month. Short half-life = tradeable. Long half-life = basically useless for anything except buy-and-hold prayers.
Anyway, I’ve always thought that trying to tie Bitcoin to any tradfi asset is silly. People use this mostly to fit whatever narrative currently matches their bias—one day Bitcoin is digital gold, next day it’s Nasdaq on crack.
The stock market correlation is honestly much more accurate. Bitcoin has seen both tops and bottoms in line with SPX over the last 5 years—up until now, where SPX is sitting at all-time highs while BTC is down 40% from its peak.
Because of that, you should view Bitcoin as its own thing. It’s not a metal, nobody is going to treat an asset with 50%+ annualized volatility as a safe haven (for context, gold sits around 15%, and even that’s considered volatile for a “store of value”). It’s also not a stock index, there are no components in Bitcoin, it’s just code. It’s had a rotating cast of narratives over the years: payments, store of value, digital gold, global reserve asset, and so on.
While all of them sound nice, this is still a fairly young market and it’s very hard to say if it has any actual use case besides being a speculative asset. Which is completely fine, but it’s good to be realistic about these things.
The Bottom
Reliably timing the bottom in Bitcoin is extremely hard, not that it’s easy in any other market, but Bitcoin has changed so much over the years that historical patterns become even less useful.
While gold and SPX were more or less the same a decade ago, the main reason to own Bitcoin in 2015 was to buy heroin online.
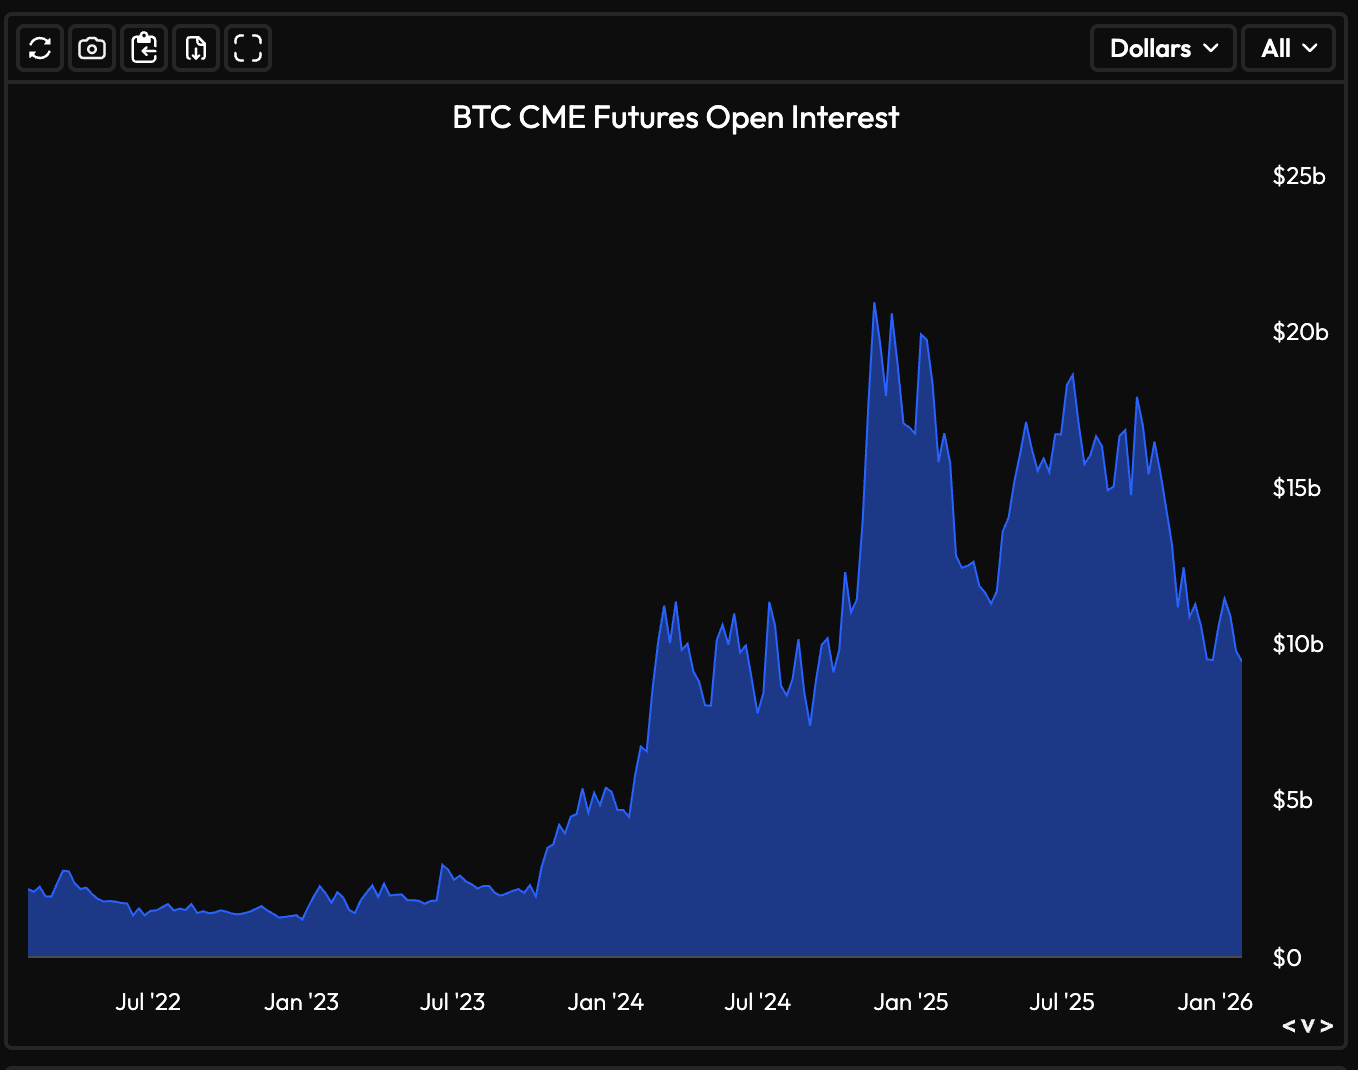
This has obviously changed dramatically. We have much more serious participants now, especially after the massive open interest influx into CME futures and options in 2023, and the introduction of ETFs in 2024.
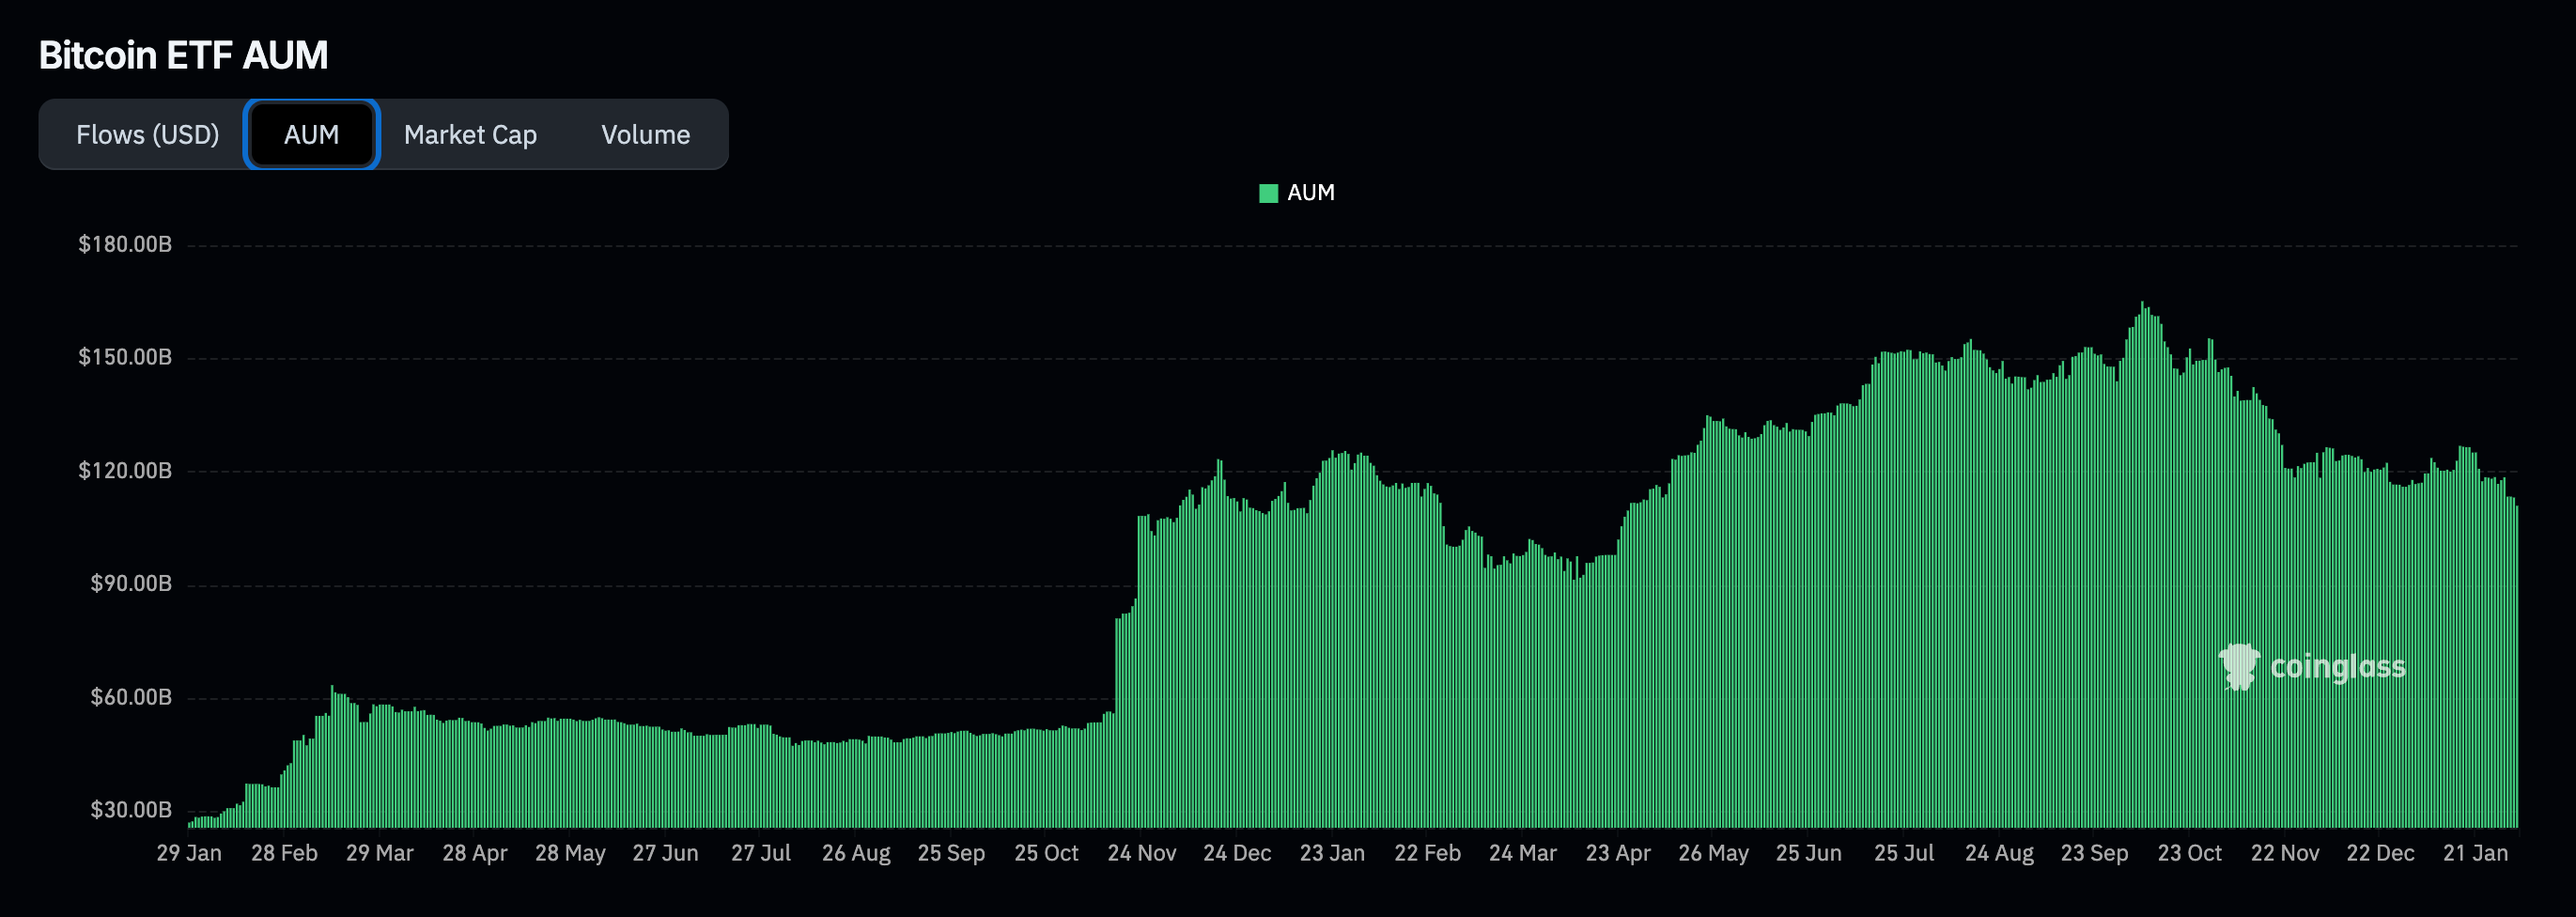
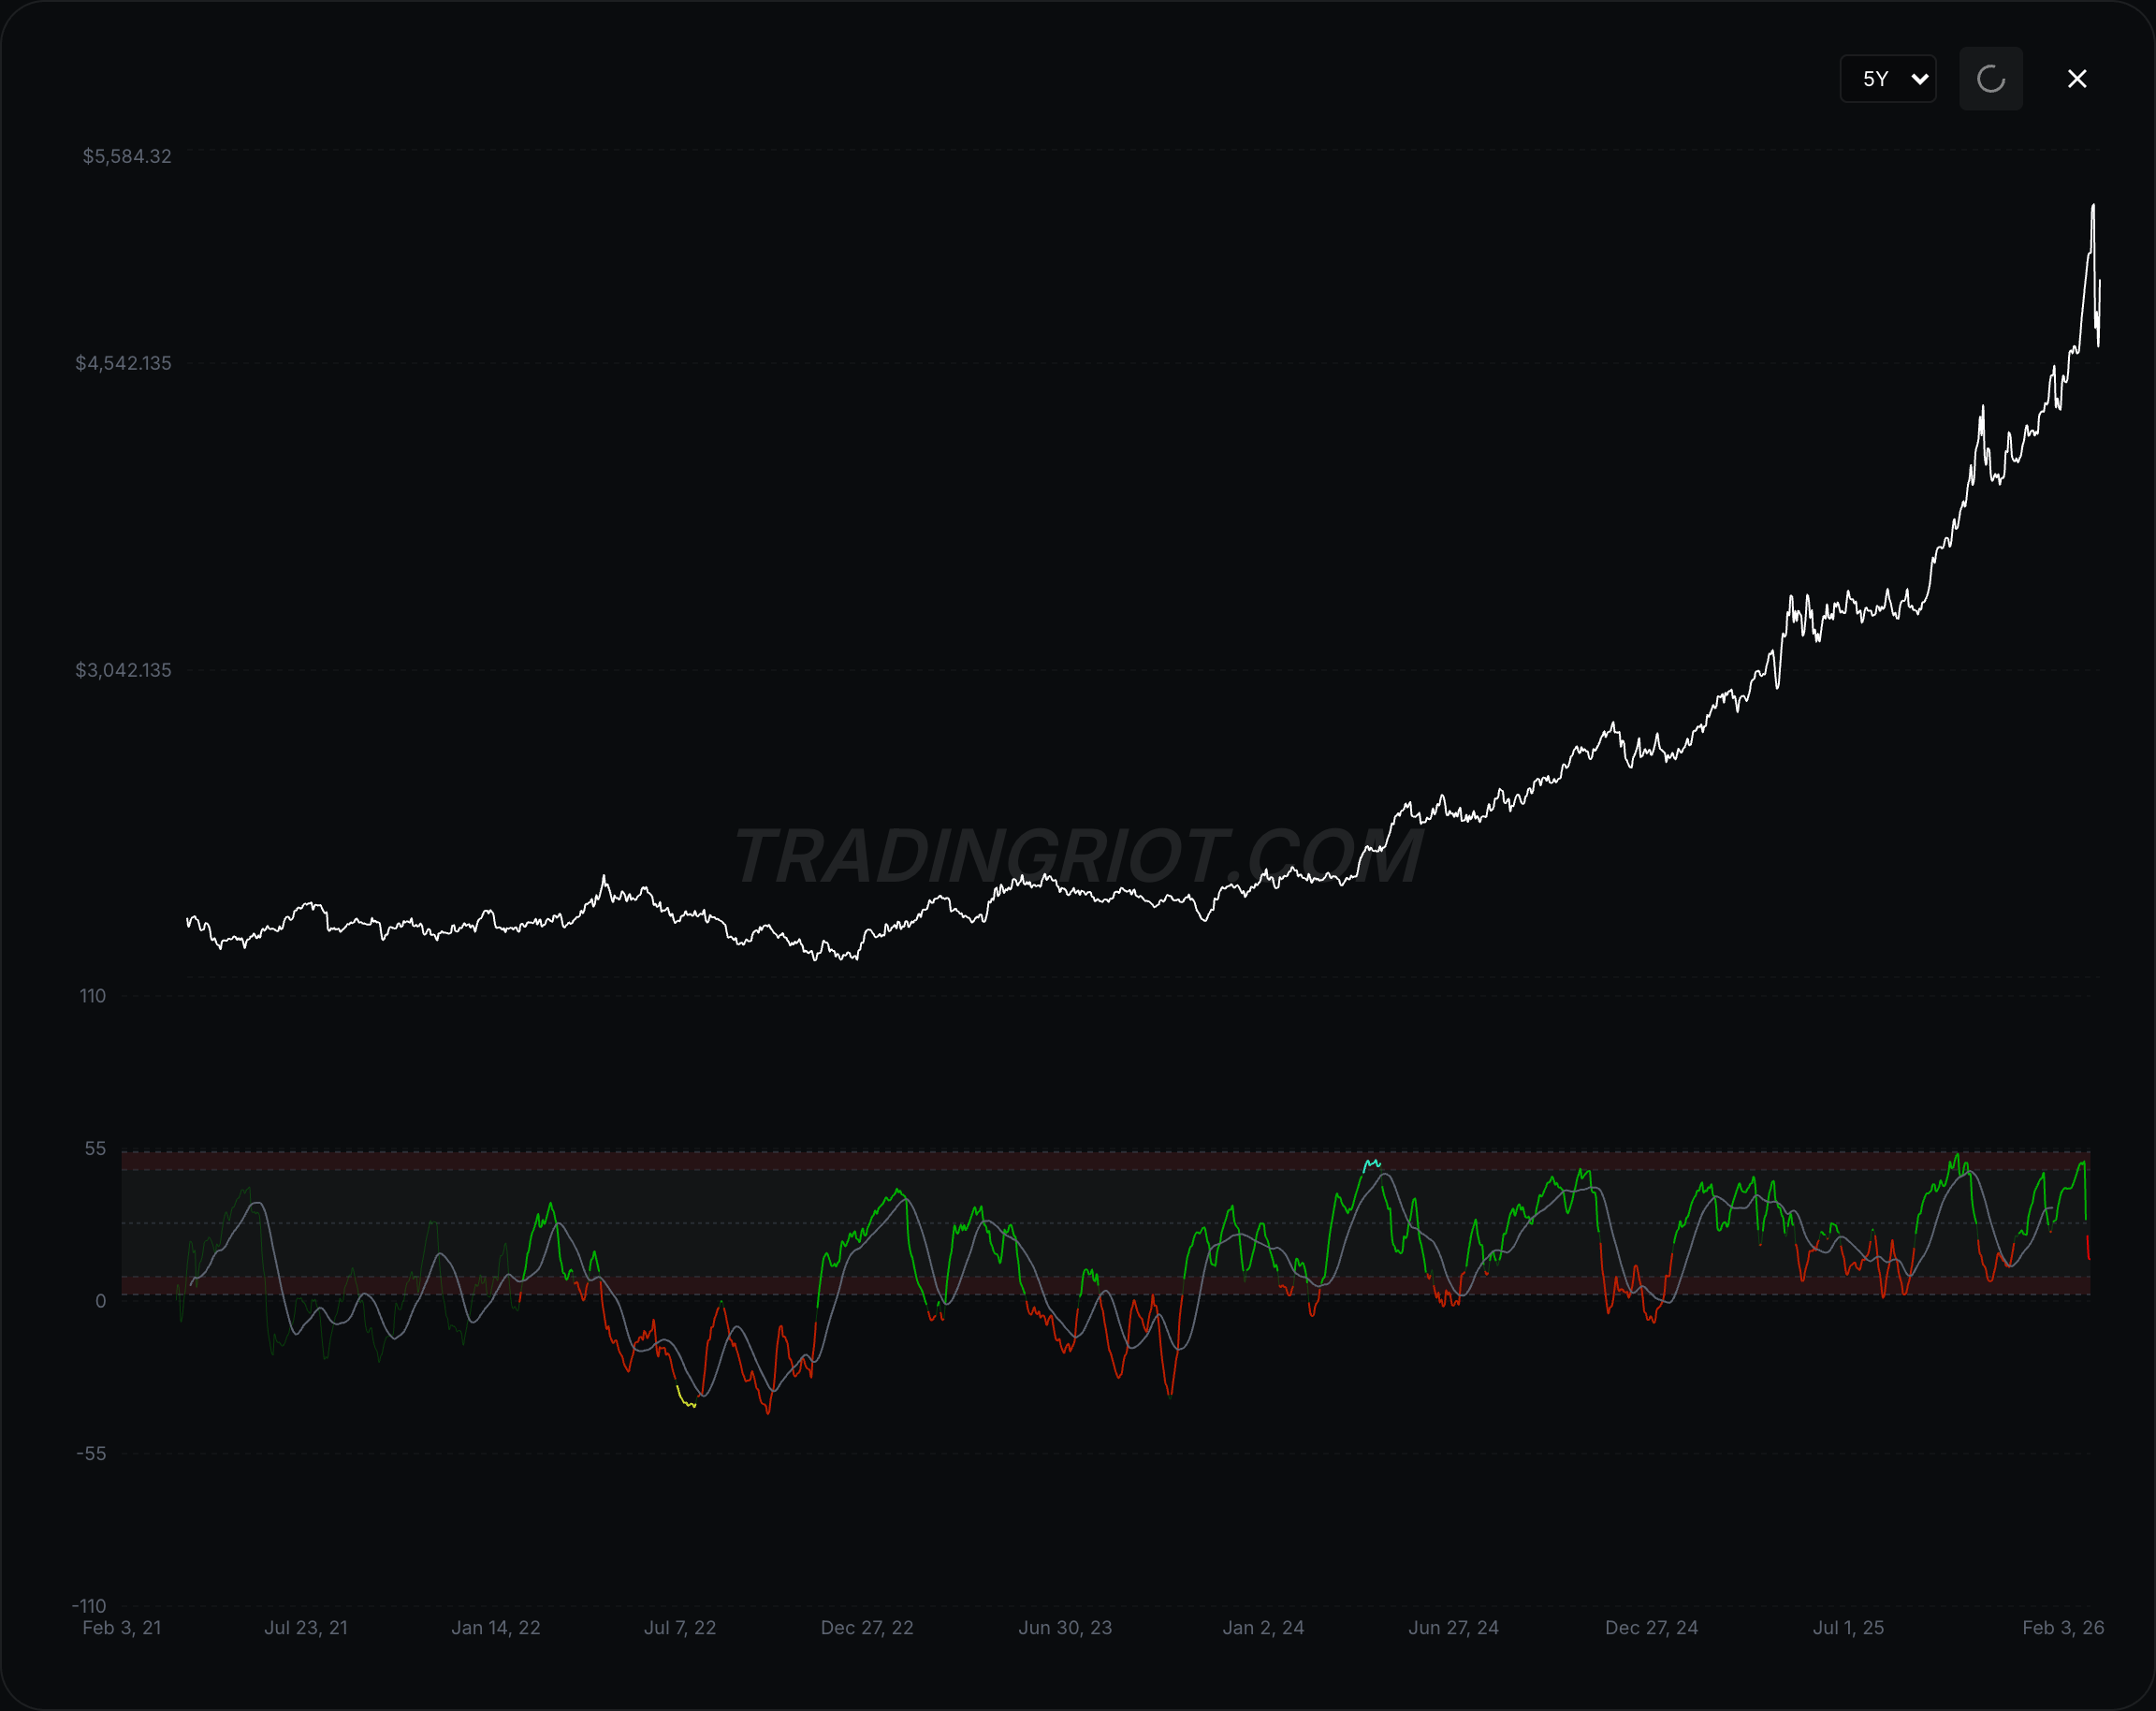
Bitcoin is a very volatile market, and if we can say one thing with decent confidence, it's that bottoms are often marked by large overreactions and blow-offs across different derivatives. This includes crypto-native metrics like open interest or funding rates, as well as more institutional signals like options skew and ETF flows.
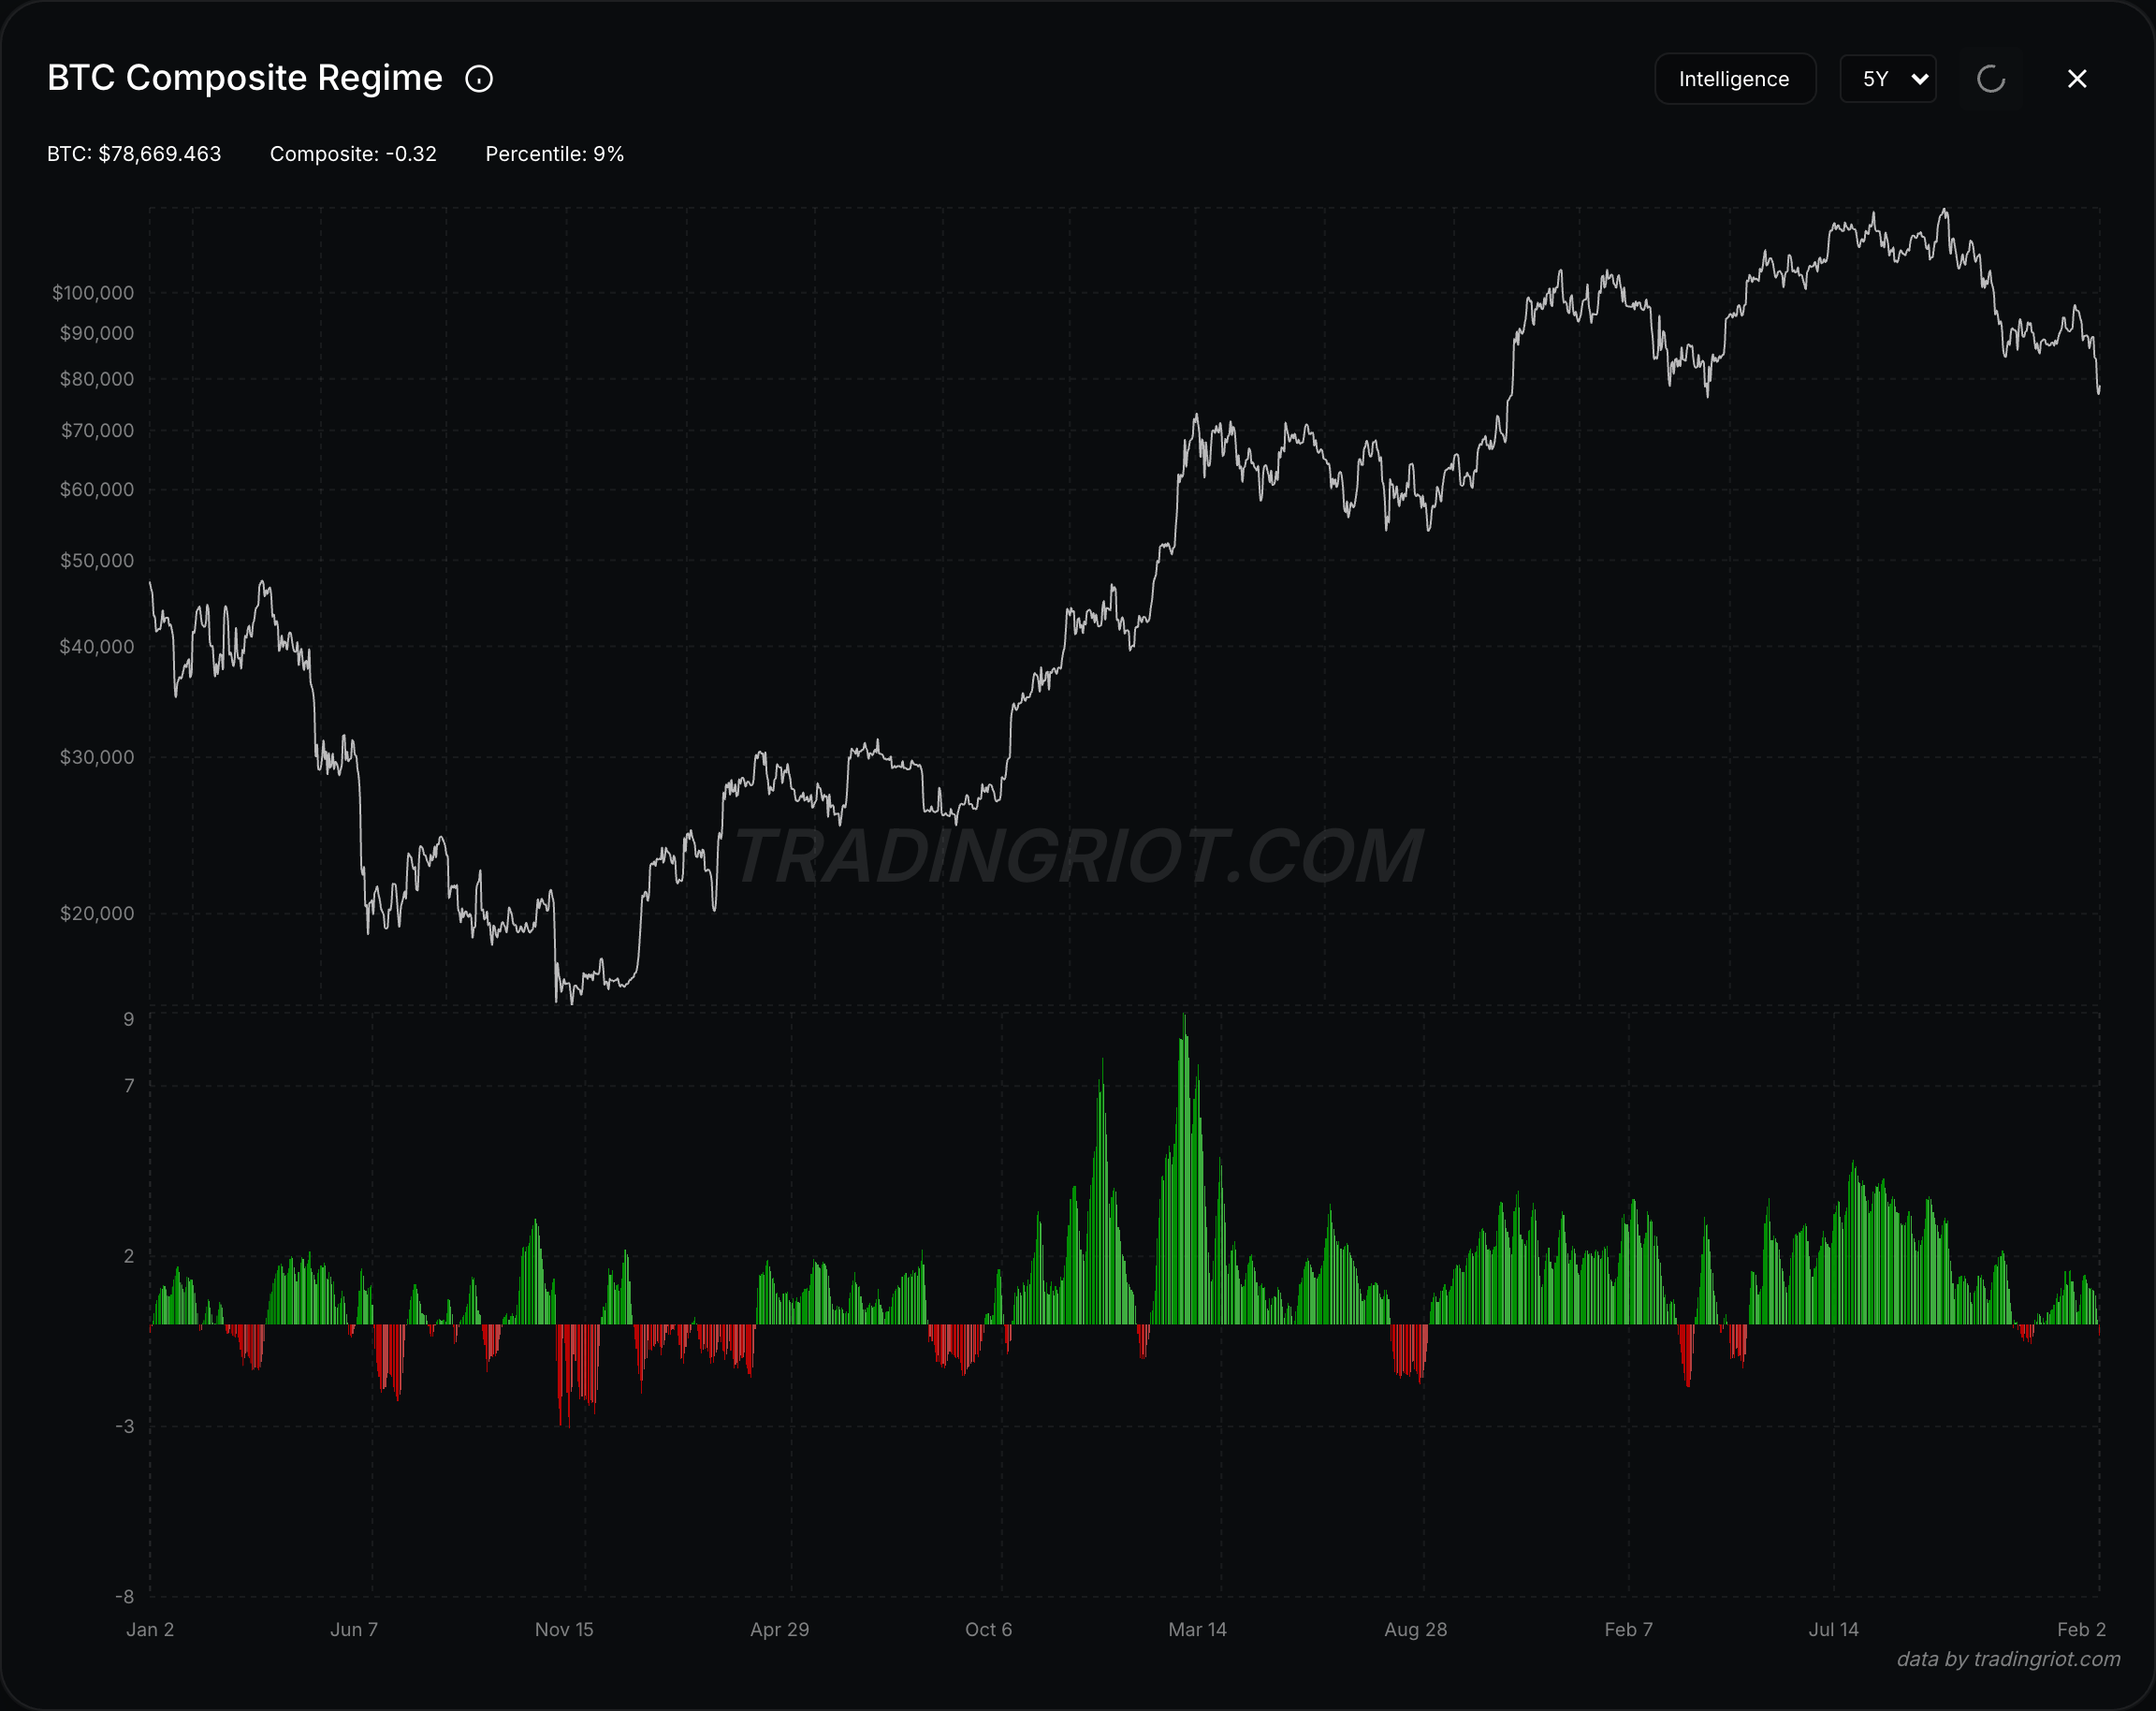
I've personally built an indicator that tracks these things in a composite regime, but you can see the red areas marking a more depressed state of the market: decreasing open interest, negative funding rates, traders overpaying for puts, and realized volatility outpacing implied.
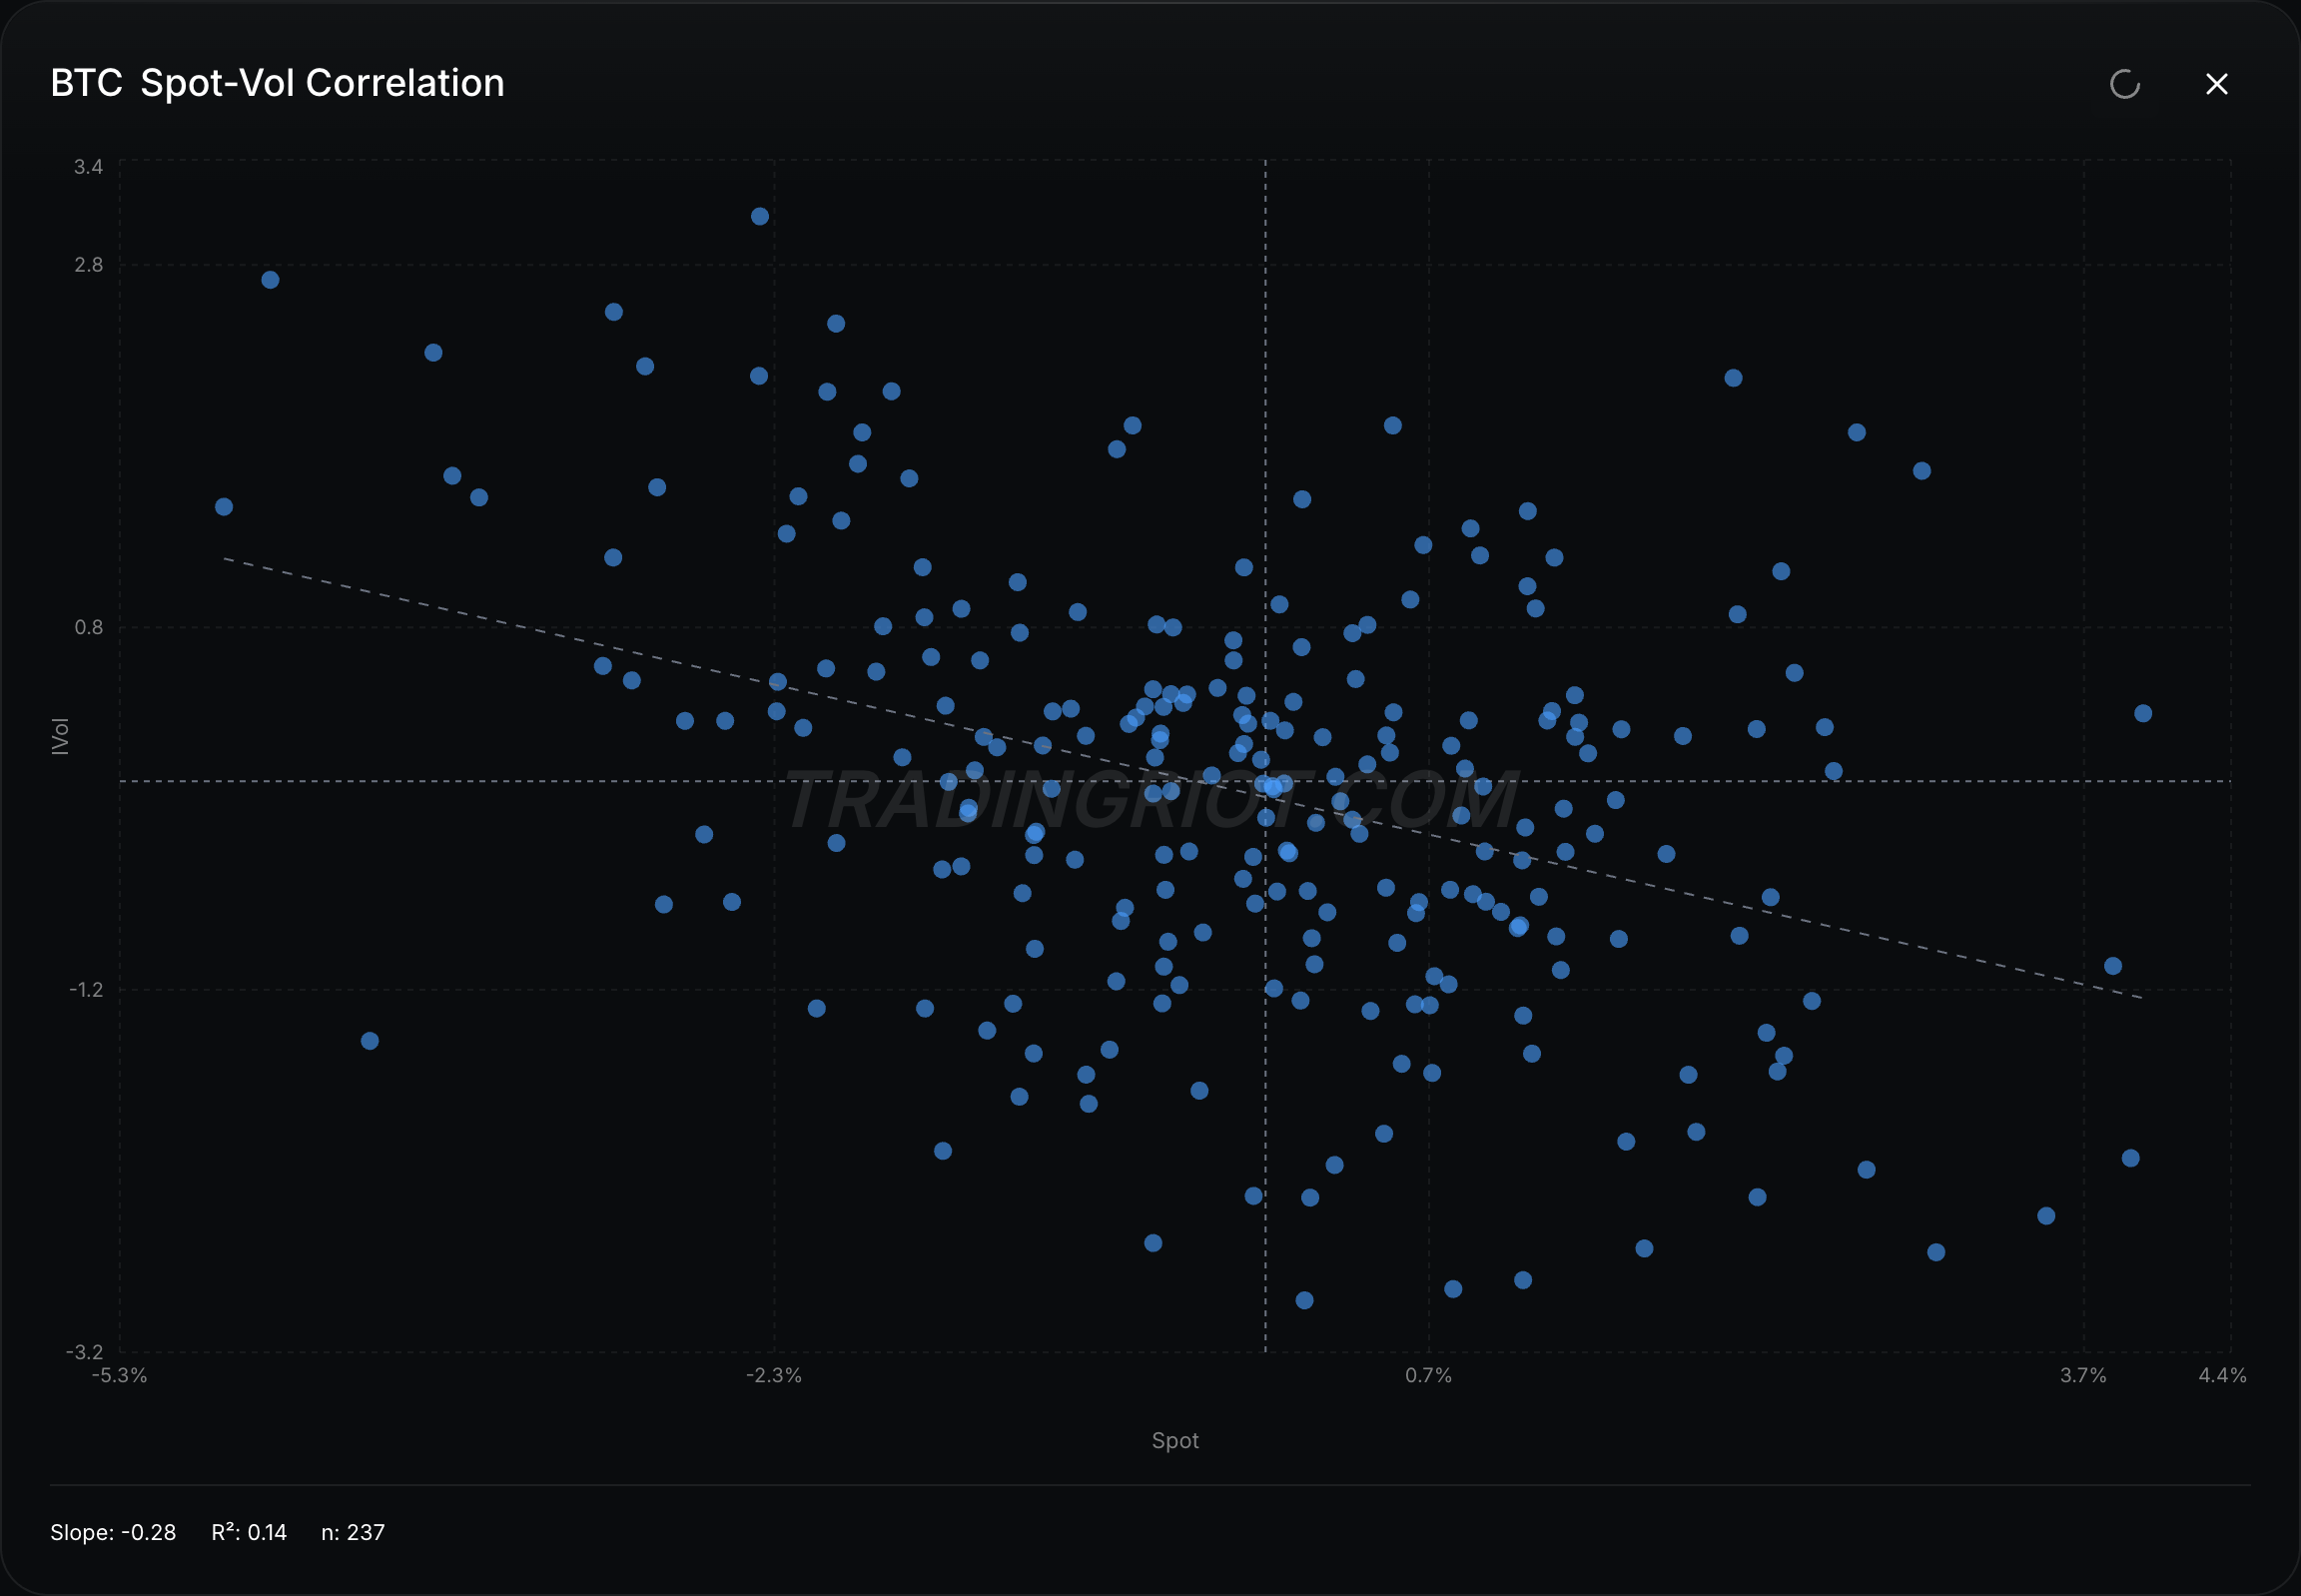
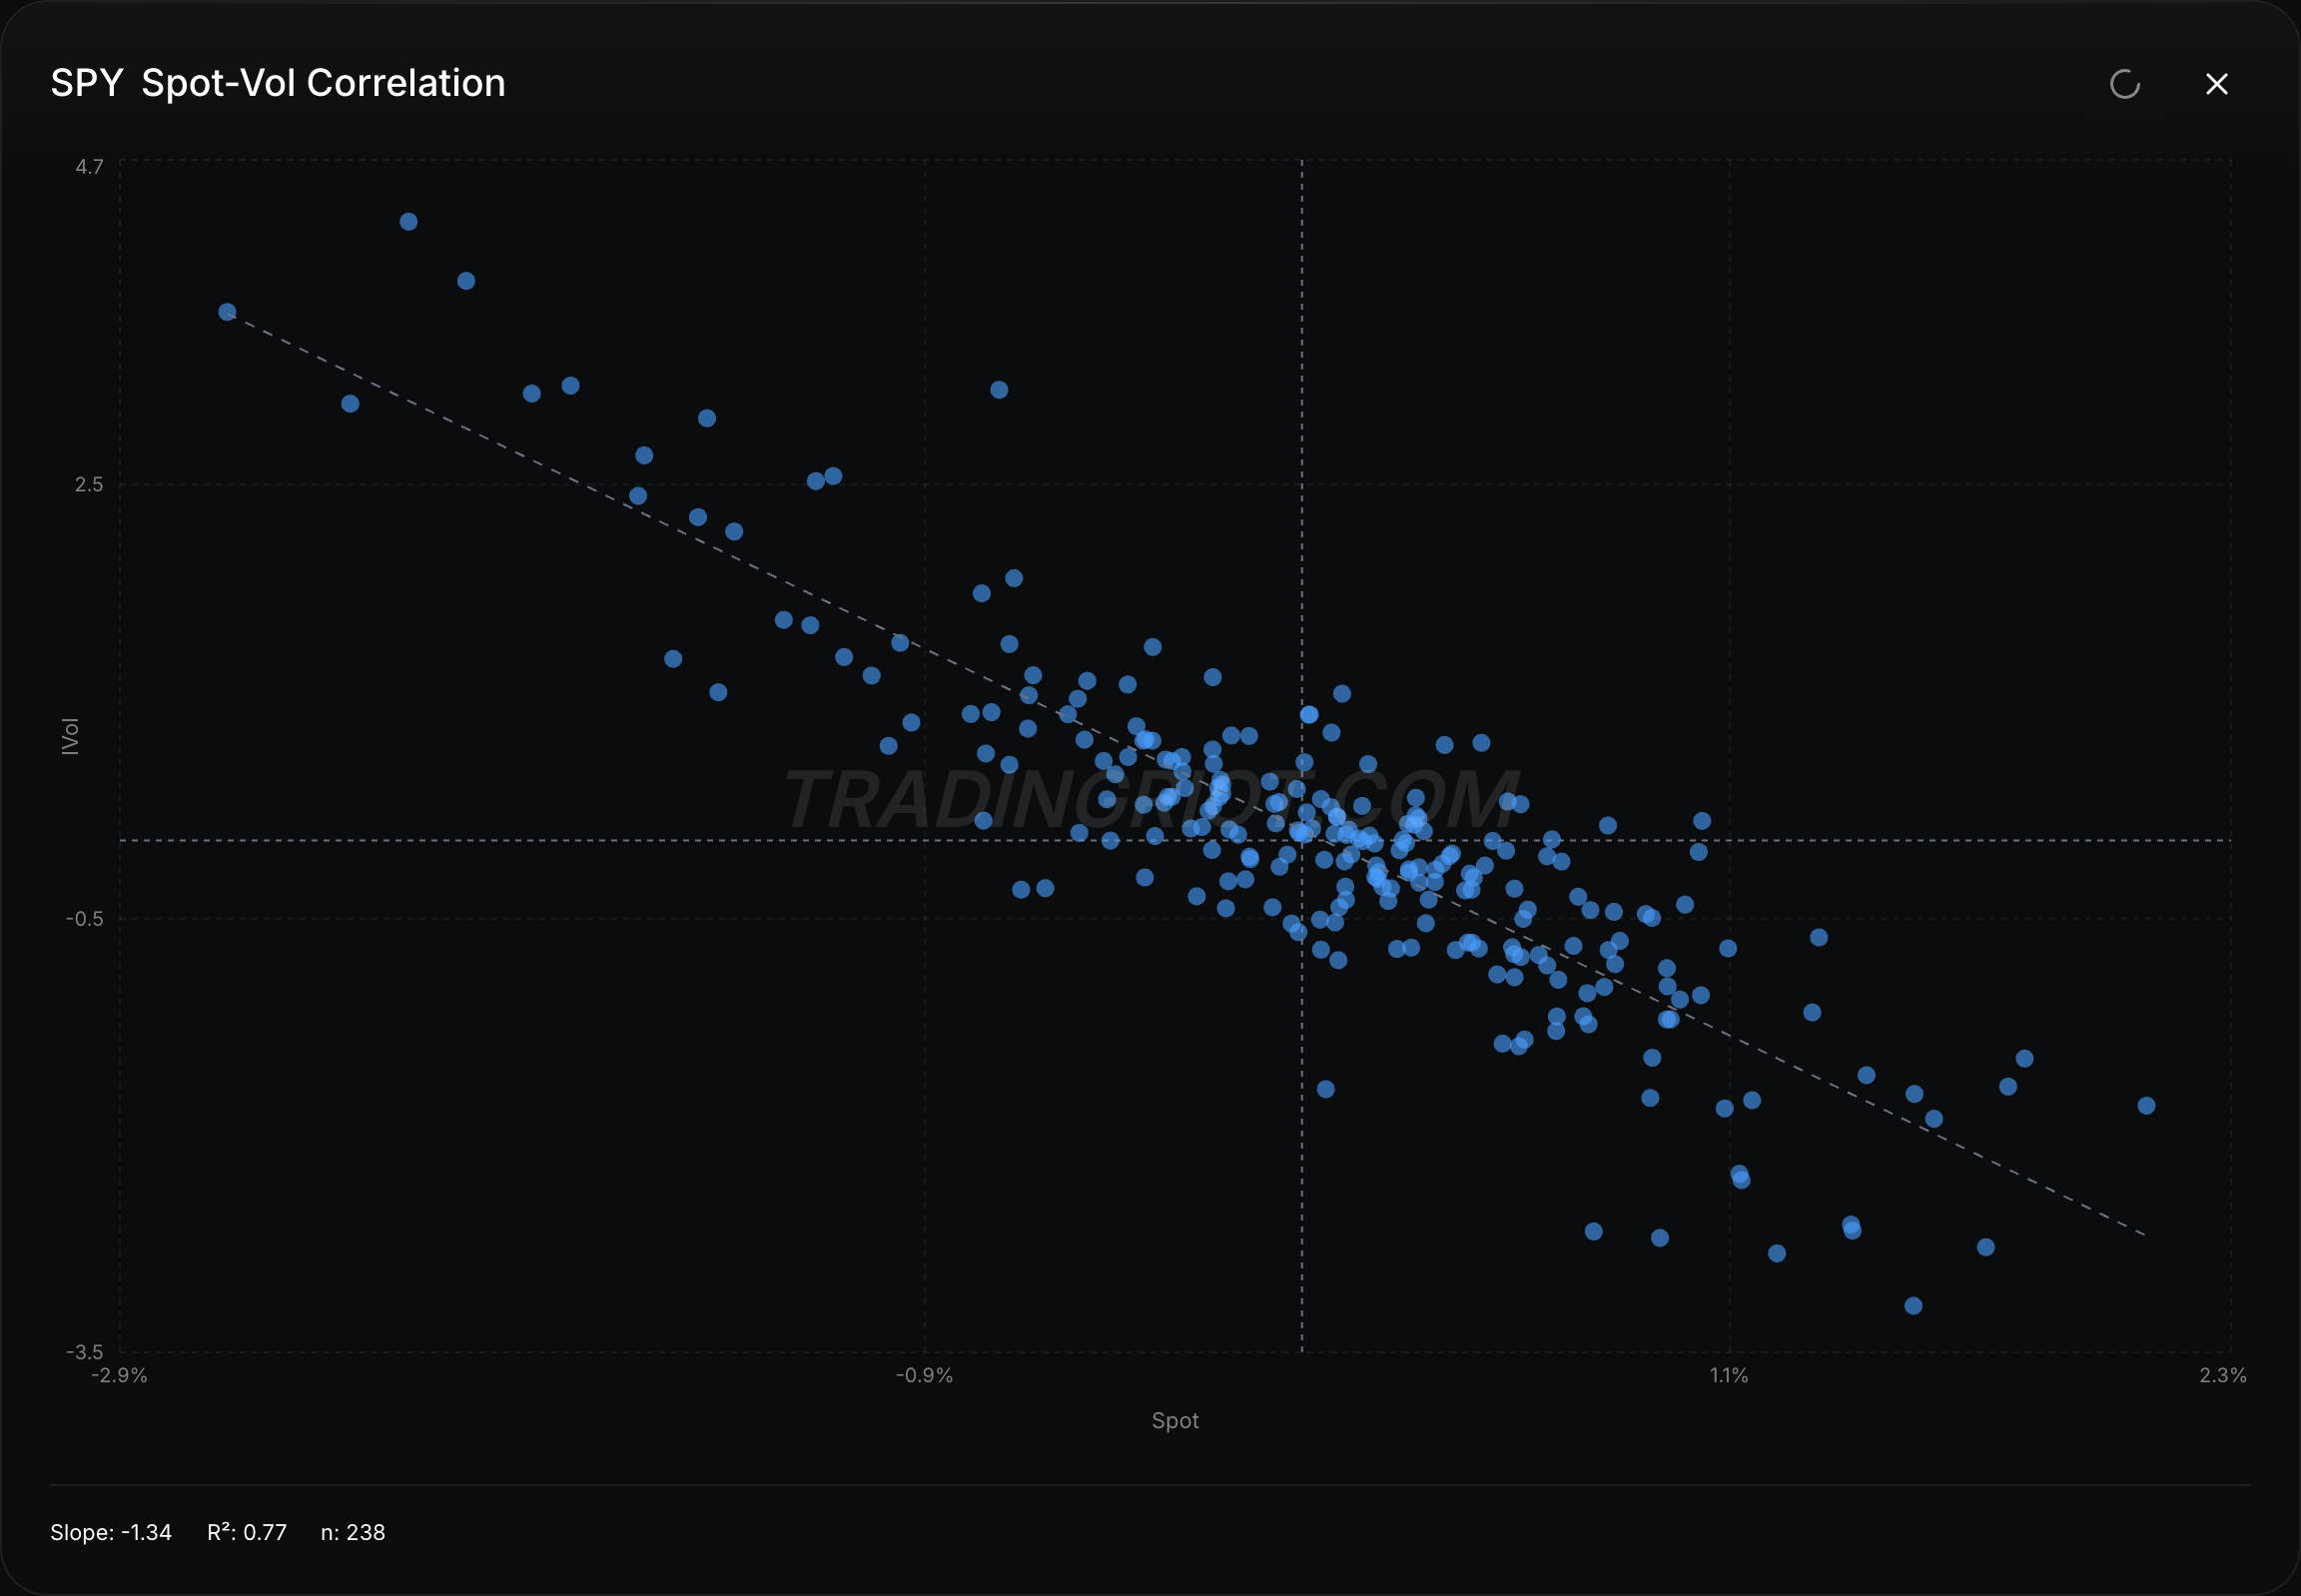
The spot-vol correlation in Bitcoin, while a little more all over the place, is increasingly resembling equity indices.
In conclusion
If you came here hoping for “Entry, SL, TP,” I’m sorry to disappoint (not really).
The point of this exercise was to almost state the obvious: Bitcoin is its own market. While it sometimes resembles gold or stocks in some ways, there is no fundamental reason for these to move in tandem.
If you’re watching prices go down right now and want a better understanding of when the bottom is going to happen, look at data that’s actually important for the market you’re trying to trade. Look at positioning, as this always tells the best story. And remember that most bottoms are made during the time when everyone has already given up.
“the main reason to own Bitcoin in 2015 was to buy heroin online”
Time to return to tradition
You're really good at this, Adam.