
Auction Market Theory
Understanding the market dynamics

I started trading many years ago and my beginnings were probably the same as the vast majority of people, stumbling upon some video on YouTube of a guy making thousands of dollars on MetaTrader trading forex using some sort of technical analysis.
One thing that I can comfortably say is that the longer I trade, the less of a fan I am of technical analysis.
Social media is always filled with a bunch of different indicators, price action techniques, trend lines and so on, breaking down usually the hindsight situations that already played out.
I am not saying that all technical analysis is bad, I still use some things to this day, but what I see online most of the time truly reminds me of astrology for the unemployed rather than an actual useful trading approach.
One of the things I learned early on and that stuck with me throughout the years is Auction Market Theory. It is not because it is the best way to view the market, or because there are any hidden secrets behind it, but mostly because it makes sense.
And this is exactly what I cover in this article. We will start with the fundamentals of why markets move, break down Auction Market Theory itself, and then look at the tools used to apply it: Market Profile, Volume Profile, and VWAP.
Before we do so I will leave a supplementary reading list here for those who want to dig deeper into the topic:
Options, Futures, and Other Derivatives does not cover Auction Market Theory, but it is useful book to understand how markets function.
Steidlmayer on Markets: Trading with Market Profile, the 2nd Edition
Mind Over Markets: Power Trading with Market Generated Information, Updated Edition
All analytics in this article are powered by TradingRiot Analytics. Sign up to access data for 1,000+ futures, crypto, stocks, and ETFs, plus education on turning data into strategies.
Orderflow and Why Markets Move
A lot of people have no idea why prices actually go up or down.
There are always many theories behind every move, with the word manipulation usually flying around, but fundamentally things are much more simple.
Sometimes you hear that price went up because "there were more buyers than sellers." This is actually also not correct.
Prices move because of the dynamics between market and limit orders, and since for every buyer there has to be a seller and vice versa, prices will move when there is aggression on either side.
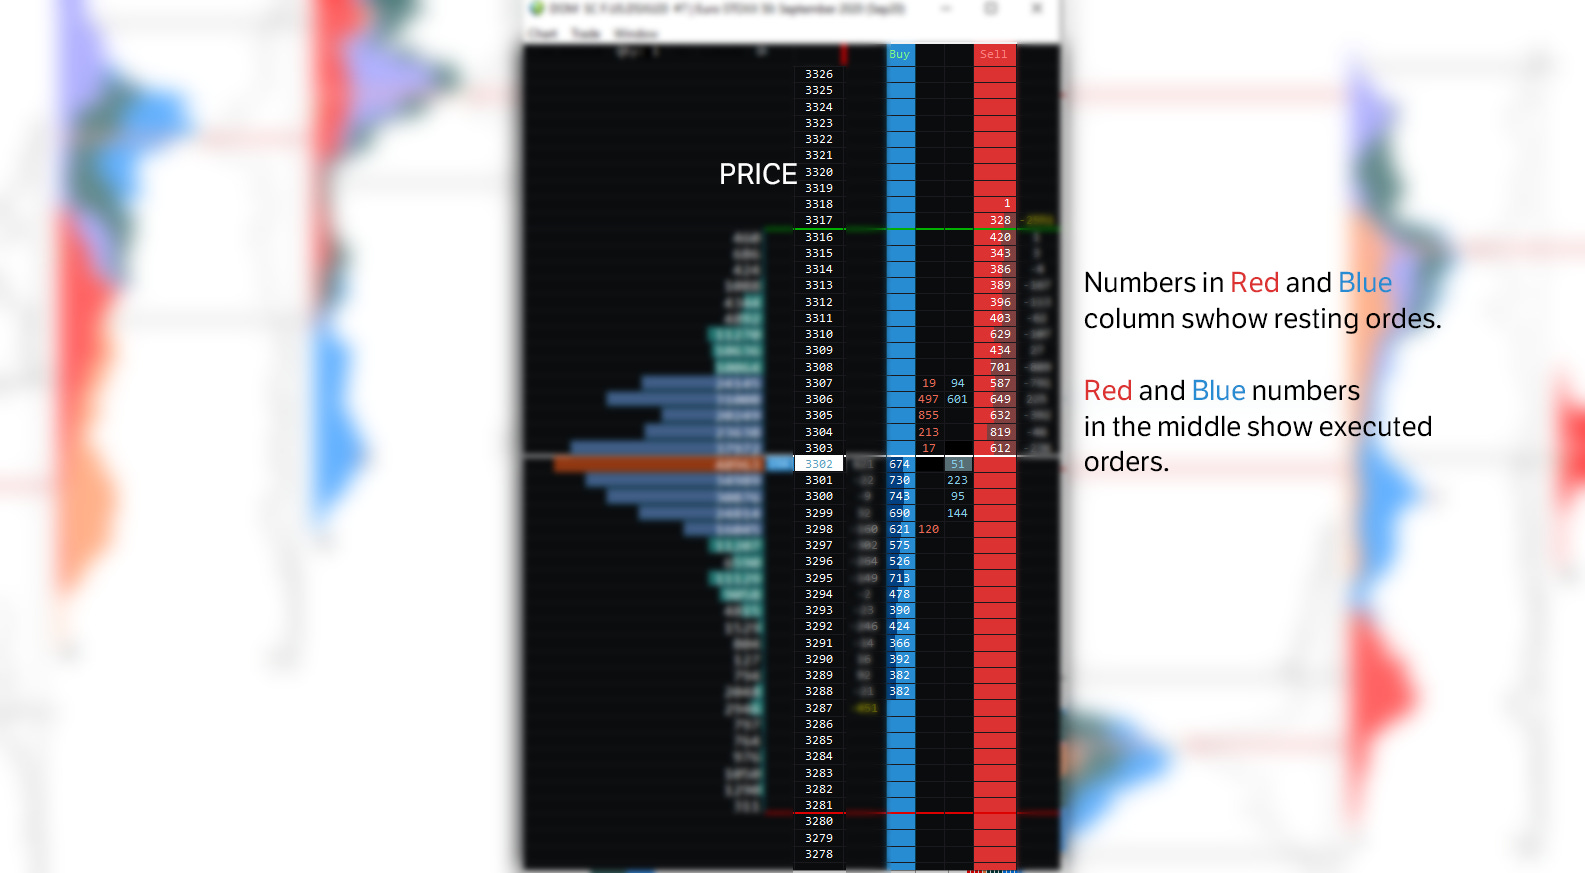
What you see above is an example of a trading DOM (Depth of Market).
This particular DOM shows the depth of market for Euro stoxx futures. In trading, there are only two types of orders that matter for understanding price movement.
Market Orders
Market orders are orders to buy or sell at the best available price right now. They are executed immediately against the resting limit orders in the order book. Market orders are the aggressive side of the equation.
They are the ones that move prices, because every time a market buy order takes out the best available ask, the price ticks up.
Every time a market sell order takes out the best available bid, the price ticks down. This is how and why prices move.
It is not because of an RSI crossing a level or a candle closing above a moving average. Prices move because aggressive participants are willing to pay the spread to get filled immediately.
Limit Orders
Limit orders are resting orders placed on the order book at a specific price.
They advertise the intention to buy or sell and sit there waiting to be executed against incoming market orders.
Limit orders are often called the heavier hand in the market, because large players cannot afford to use market orders.
If they did, they would incur considerable slippage trying to fill large positions.
Instead, they use various advanced order types such as icebergs to hide their intentions and avoid getting front-run.
If you are placing a limit order on the order book, you are making liquidity. Because limit orders are the heavier hand, they are the ones that stop markets in trending environments from advancing or declining further.
Aggressive market participants firing off market orders often hit these limit walls and get absorbed.
This dynamic between aggressive market orders and passive limit orders is the foundation of everything that follows.
What is Auction Market Theory?
J. Peter Steidlmayer developed the concept of Auction Market Theory. Jim Dalton was one of the first to recognize the value of Steidlmayer’s ideas and contributed to them significantly in his book Mind Over Markets. If you want to go deeper on this topic, those are the two names to look up.
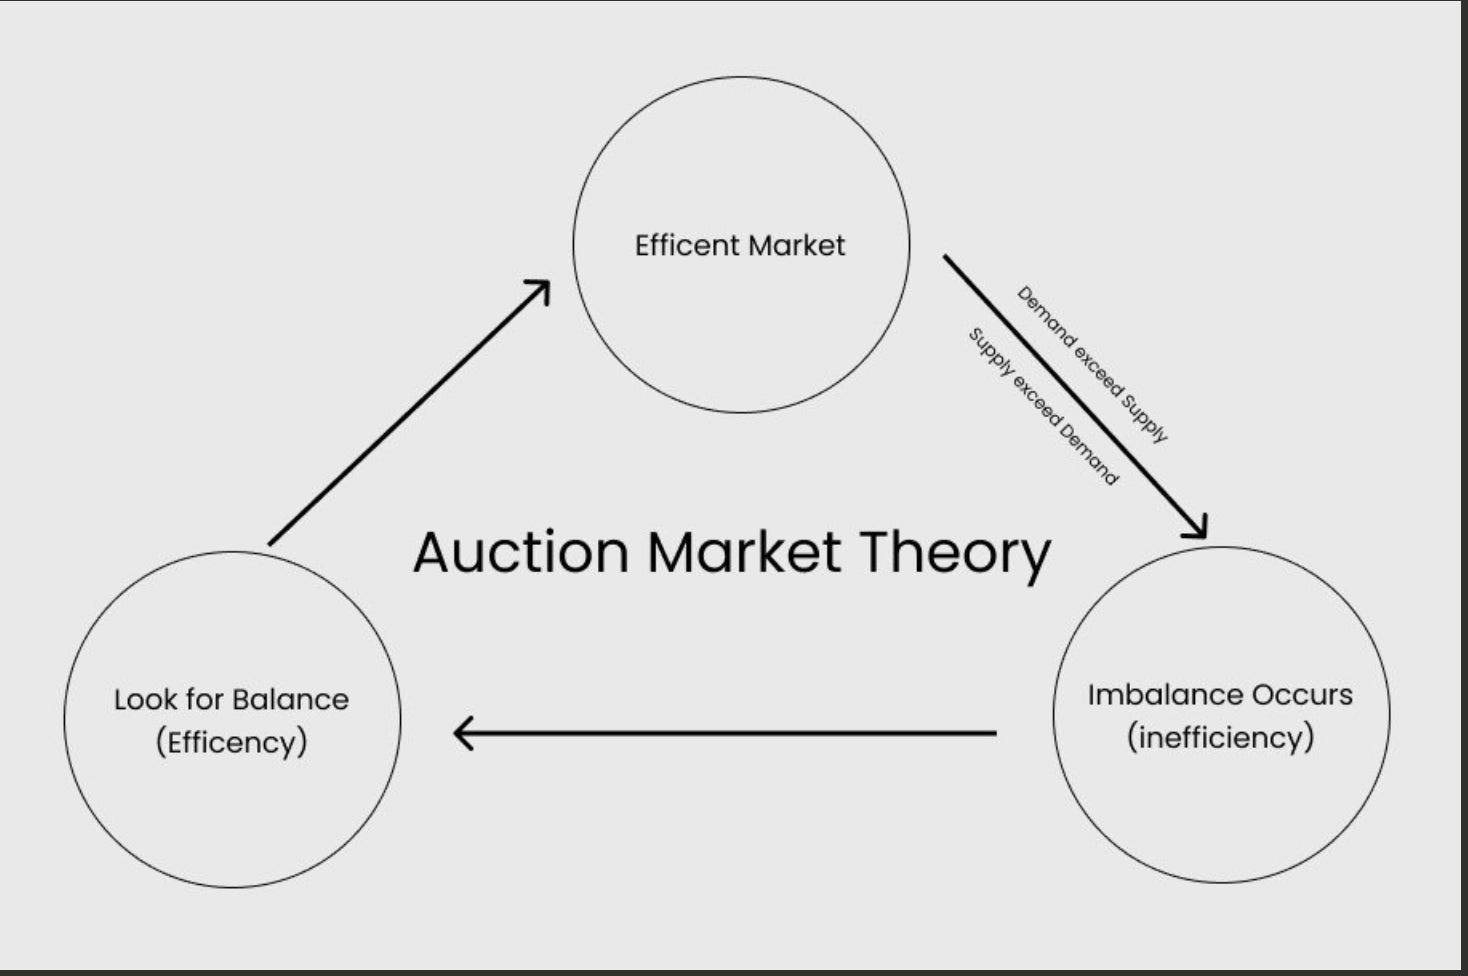
Auction Market Theory breaks down the market’s primary purpose and how market participants interact to fulfil that purpose.
The main idea lies in the fact that financial markets are no different from any other auction where buyers and sellers meet daily. There are two major things every market is trying to achieve:
Facilitate trade in a two-way auction process
Seek the fair value of the asset
A two-way auction means that the end of the “up” auction is followed by the beginning of the “down” auction and vice versa.
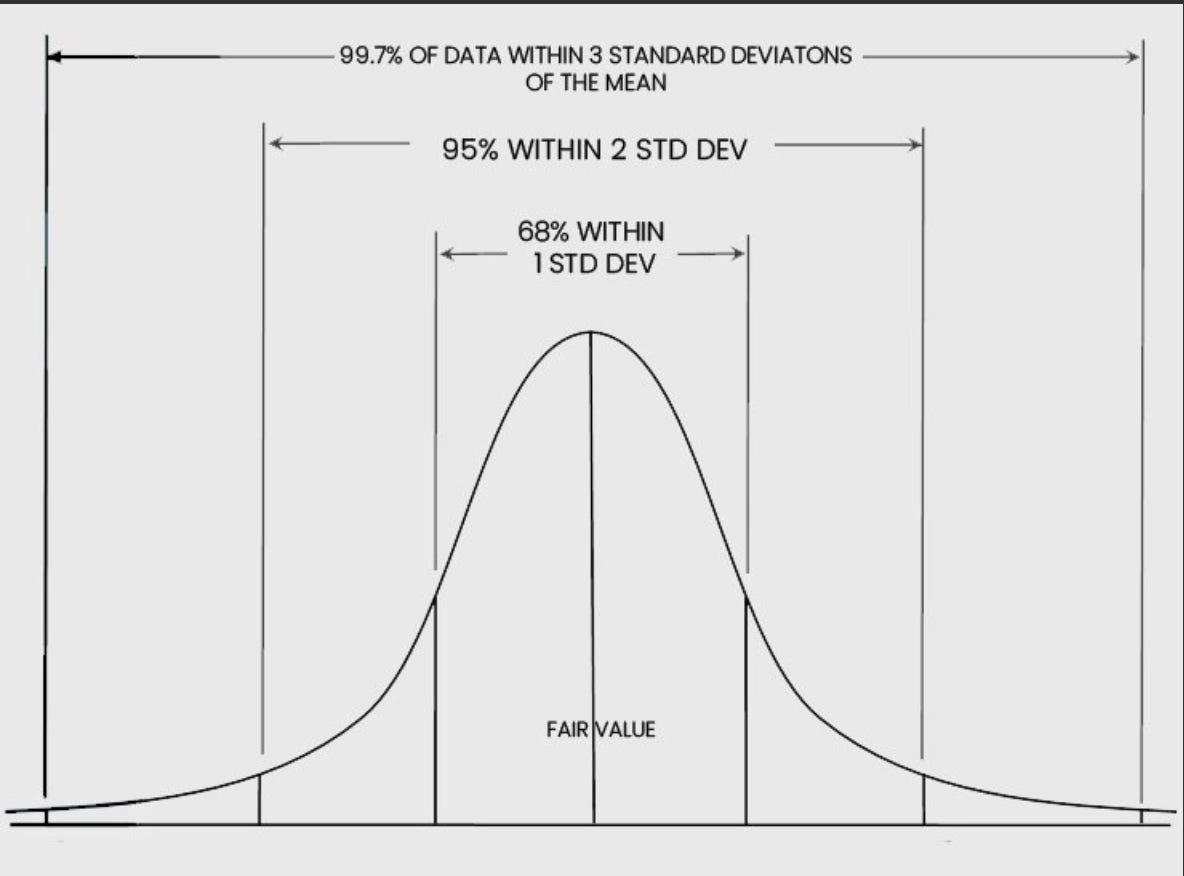
Auction Market Theory translates this process through supply and demand dynamics and price discovery. This process is then represented by tools such as Market Profile or Volume Profile, which produce bell-shaped curves representing 68% of activity as one standard deviation from the mean.
A Practical Example
To make this tangible, let's look at a hypothetical example in the stock market. Say that one share of Samsung stock trades at $100 (which is actually not that far off from the price in Korean won where it actually trades).
A new Samsung phone comes out and it is terrible: the battery is not working, overheating, the whole mess.
Because of this event, Samsung stock starts dropping in value until it finds new buyers at, let's say, $50 per share. This is where a new value area is created.
After some time, the phones get repaired and the price of the stock starts to rise again. Where is the market likely to stop?
The previous value area around $100. This is eventually what every market does. Market participants constantly negotiate prices between balanced and imbalanced values.
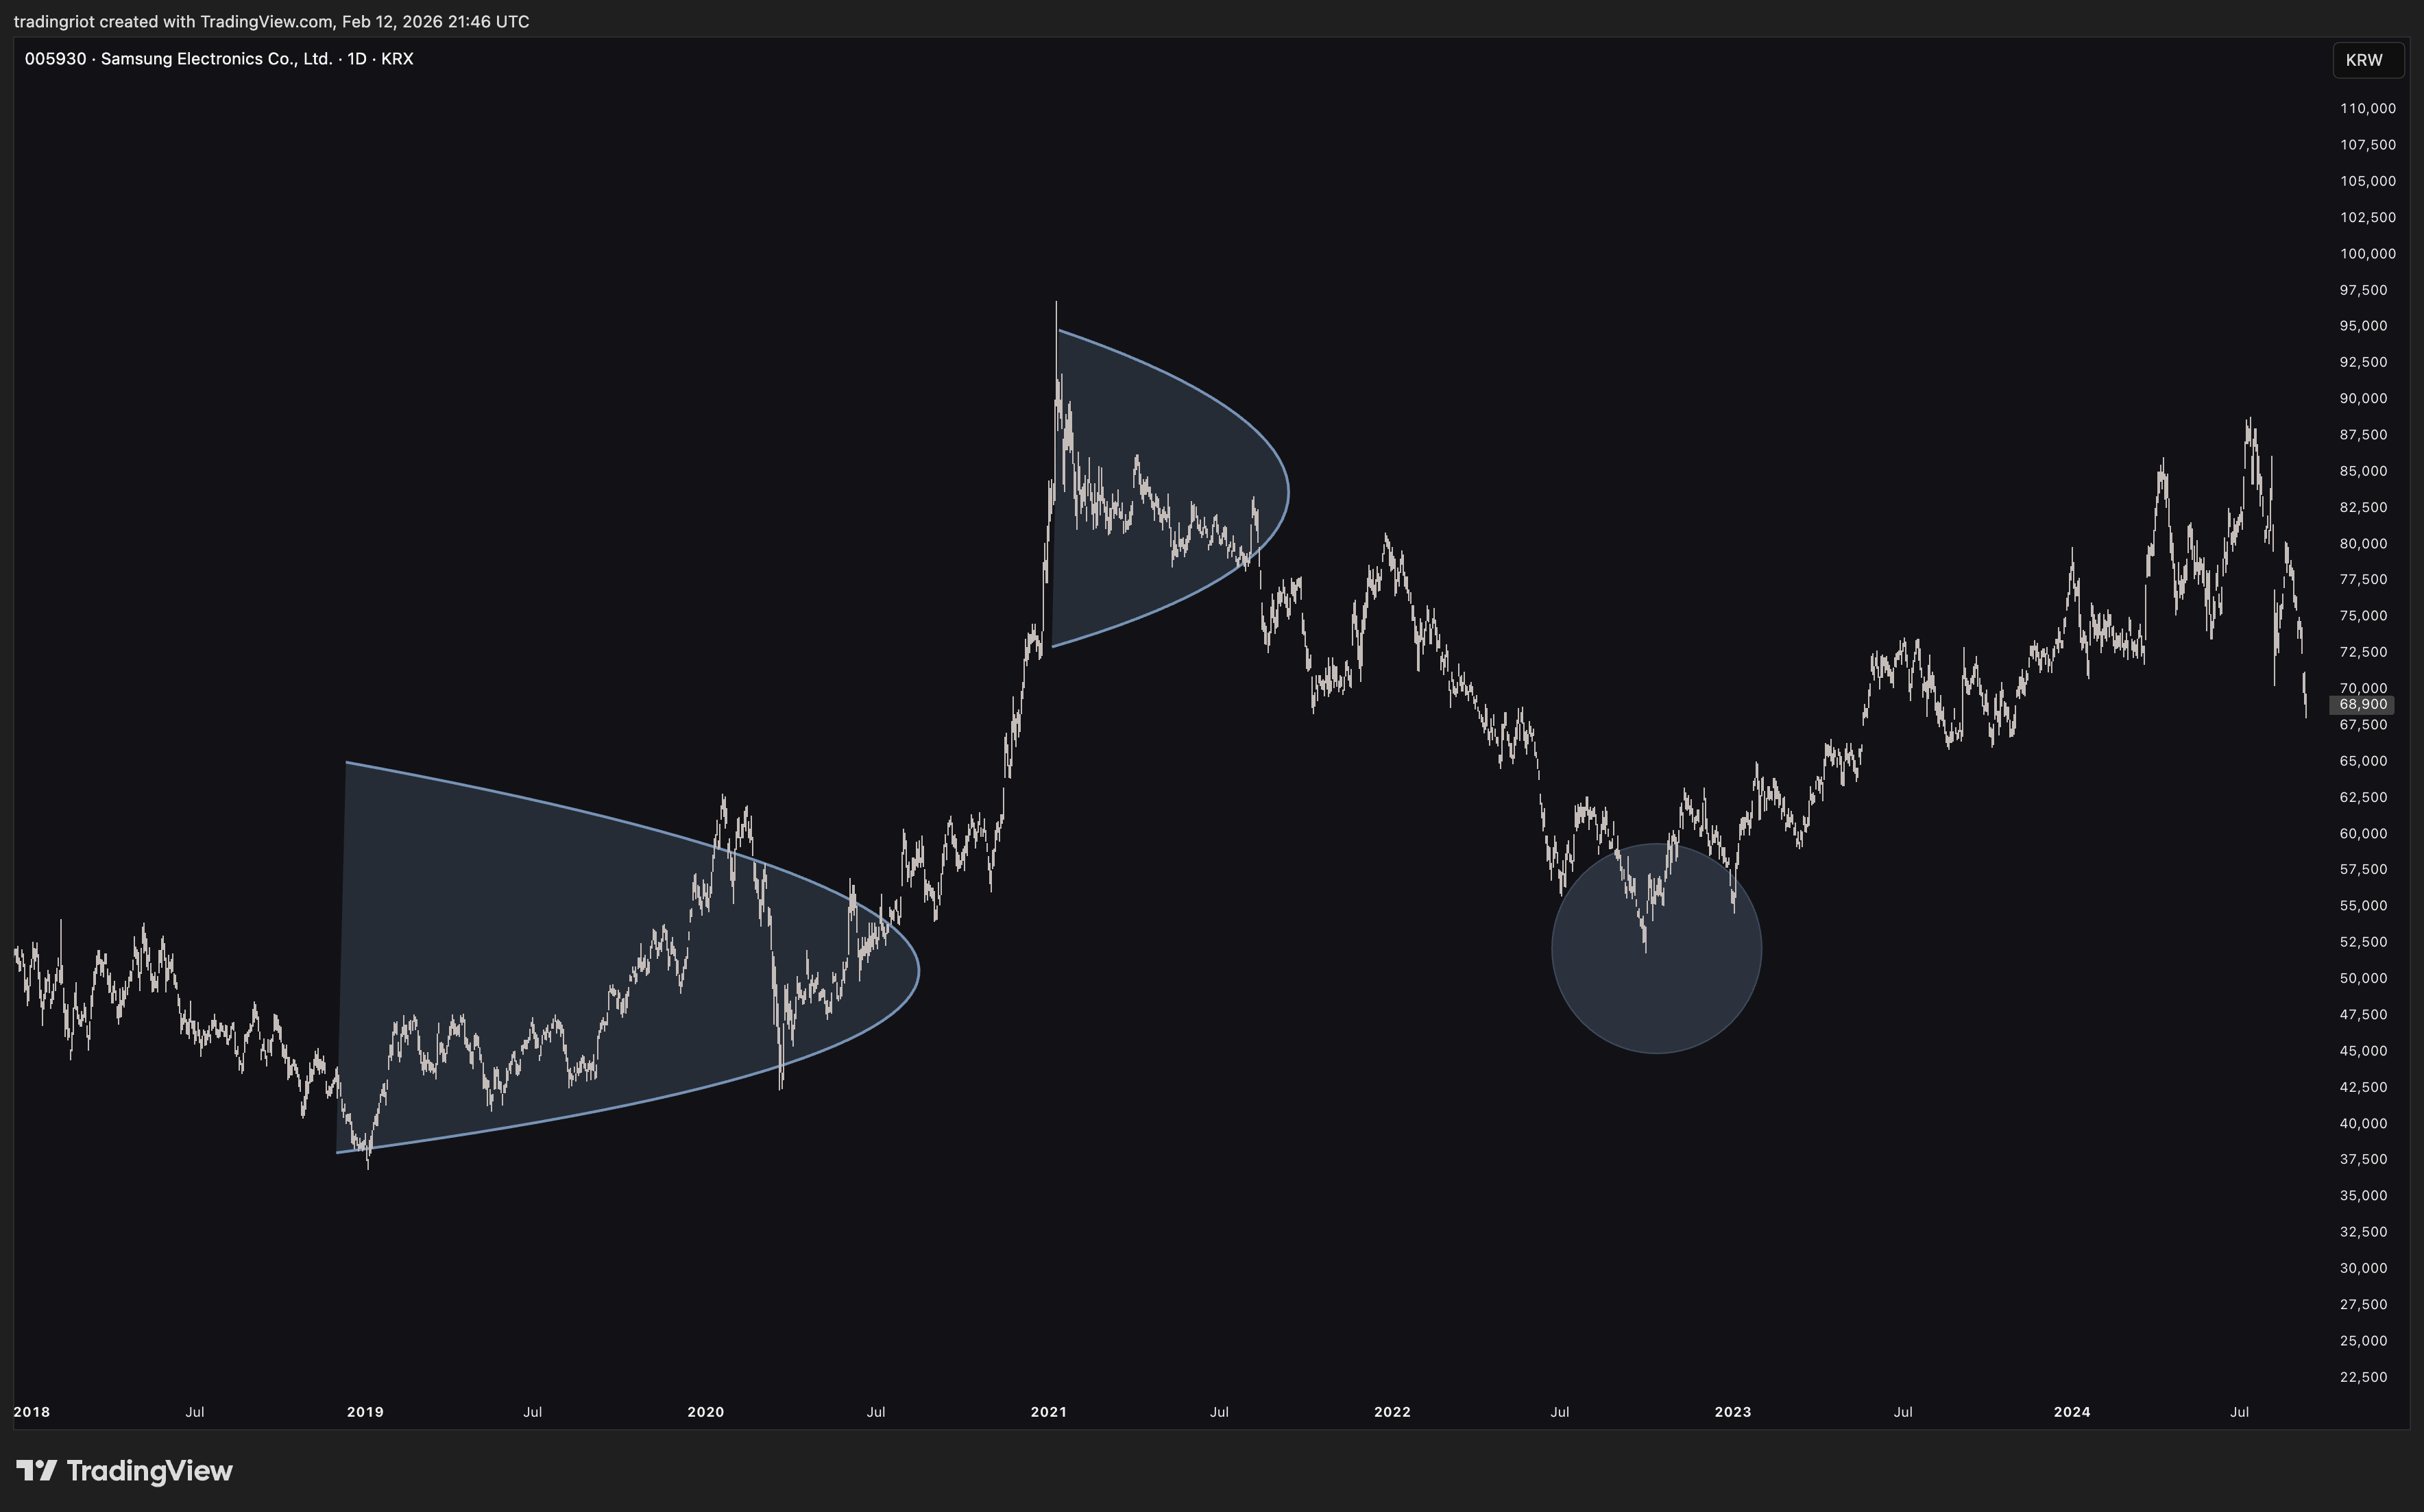
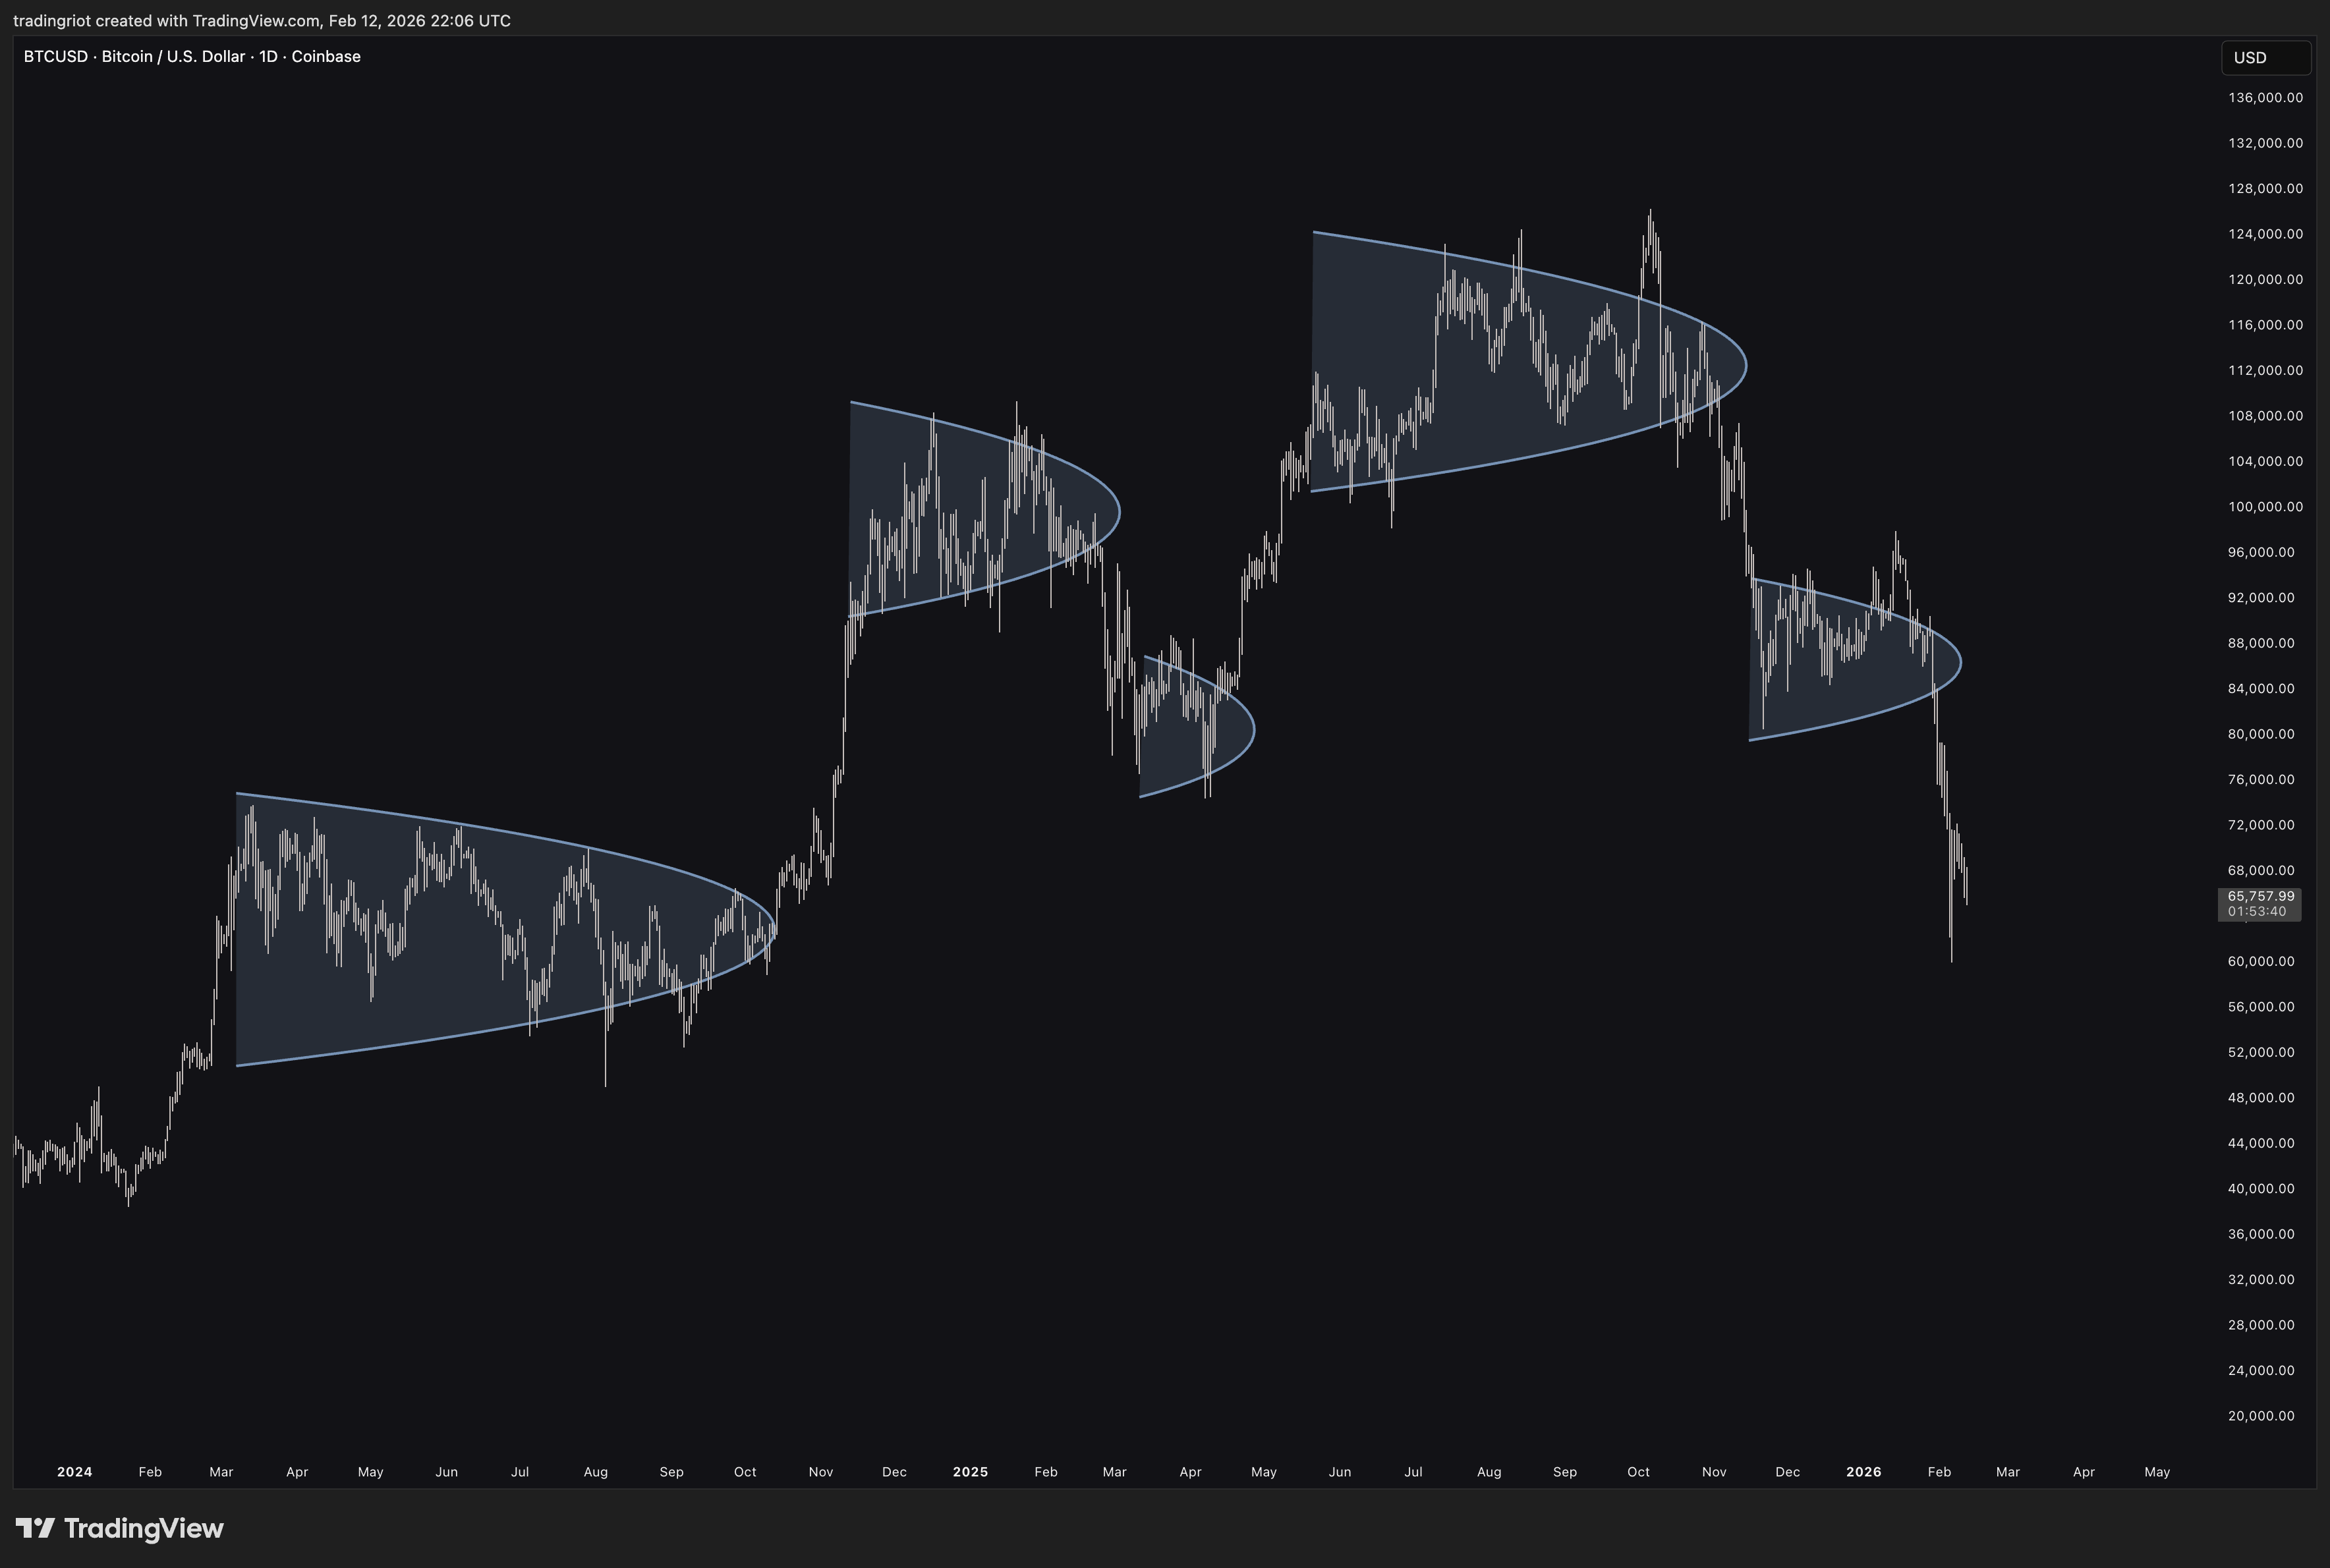
Here you have a chart of Samsung.
While I have absolutely zero clue what caused the price movements from 2019 to 2023, it reflects our scenario quite well.
Value built at the lows, followed by a move to the upside where new fair value was established, and once price sold off, it found support at the prior value area.
When it comes to trading, there is always a narrative. Trump said this, war here or there, Powell did that, someone ate a bat in China and so on.
I earlier mentioned that the longer I trade, the less I care about technical analysis. If there is something I care about even less, it is all of these narratives.
What every market does is facilitate trade, and market participants negotiate prices between balanced and imbalanced values.
Auction Market Theory defines an area where 68% of the volume has traded as a Value Area. Inside the Value Area is also a Point of Control; this is the level where the market traded the most volume or spent the most time.
A Market Profile represents the Value Area and Point of Control based on time.
A Volume Profile represents the Value Area and Point of Control based on volume.
This advertising mechanism and price always seeking value can be represented in the image below.
Value Area and Point of Control
Auction Market Theory defines an area where 68% of the volume has traded as a Value Area. Inside the Value Area is also a Point of Control (POC), the level where the market traded the most volume or spent the most time.
A Market Profile represents the Value Area and Point of Control based on time.
A Volume Profile represents the Value Area and Point of Control based on volume.
Both are tools that present us with value areas in a non-subjective way, which is one of their greatest advantages over hand-drawn support and resistance levels.
Key Components of AMT
There are three key components of Auction Market Theory:
Price advertises opportunity in the market. When price moves away from value, it is advertising to potential participants that there may be an opportunity. If a underlying drops significantly below its established fair value, that low price is essentially advertising to buyers that there might be a bargain available.
Time regulates price opportunity. The longer the market spends at a certain price level, the more accepted that price becomes. Time validates or invalidates the price discovery process.
Volume measures the success or failure of the auction. Volume represents the interaction of market participants at different levels. From these three components, volume is arguably the most important in the current age of electronic trading. By looking at volume, we can see where other market participants were interested in doing business, which can significantly help us make more educated trading decisions.
Balance and Imbalance
To fully understand how markets behave, we have to understand the context of a given market, because there are two types of auction environments.
Balanced Markets
In a balanced market, buyers and sellers agree on prices and they are willing to buy and sell at current levels. They perceive these prices as fair value. A balanced market is usually represented by lower volatility.
Prices remain more or less the same, and markets are ranging. Thanks to Market Profile, Volume Profile or VWAP, we can easily recognize fair value. It looks like the Gaussian bell-shaped curve.
Imbalanced Markets
With new information coming to the market, whether fundamental or technical drivers, markets leave fair value and shift to an imbalanced state.
The imbalance is the exact opposite of balance. There is a disagreement about fair value, one side of market participants is more aggressive, and the market trends.
Despite popular belief that markets always absolutely have to trend, markets are mostly balanced. This tendency can be especially observed in the options market by the fact that implied volatility (the market’s expectation of future volatility) overstates realized volatility.
This is why selling structures like straddles or strangles is often a profitable thing to do, until it is not and you get run over by the market being imbalanced.
While you obviously cannot predict the future, using tools to help you establish fair value can be extremely beneficial for having an idea of future market behavior.
Auction Market Theory Rules
Although Auction Market Theory is not a trading strategy by itself, there are some rules that can be applied.
Rule 1: If the price accepts into the balance area, it is likely to revert to the other side. Price often retests the edge of the balance area before travelling to the opposite side.
Rule 2: Price inside a balance is expected to reject the edges and behavior is choppier. This is where most traders get chopped up trying to trade breakouts that never materialize.
Rule 3: Once price accepts outside the balance, it is likely to become imbalanced and seek new value, often the POC of an older balance area.
Rule 4: If the price reacts strongly from POC, it can disrupt Rule 1. A strong rejection from POC can prevent the full rotation to the other side of the balance.
Rule 5: If time and volume build at the edge of a balance, price is likely to push through. When you see the market spending time at the boundary of a balance area and volume is increasing, that is often the setup for a genuine breakout rather than a failed auction.

Market Profile: The Original AMT Tool
Market Profile was created in the early 1980s at the Chicago Board of Trade (CBOT) by Peter Steidlmayer.
Using the statistical bell curve, Steidlmayer developed a system that displays trading data and shows the activity happening during a trading session.
In 1985, he published the CBOT Market Profile guide. Although Market Profile has evolved since the 80s, the core principles have remained the same.
Market Profile is not a trading strategy. It is a tool for organizing data in a way that gives us a different, and I would argue better, view of the market.
How Market Profile Works
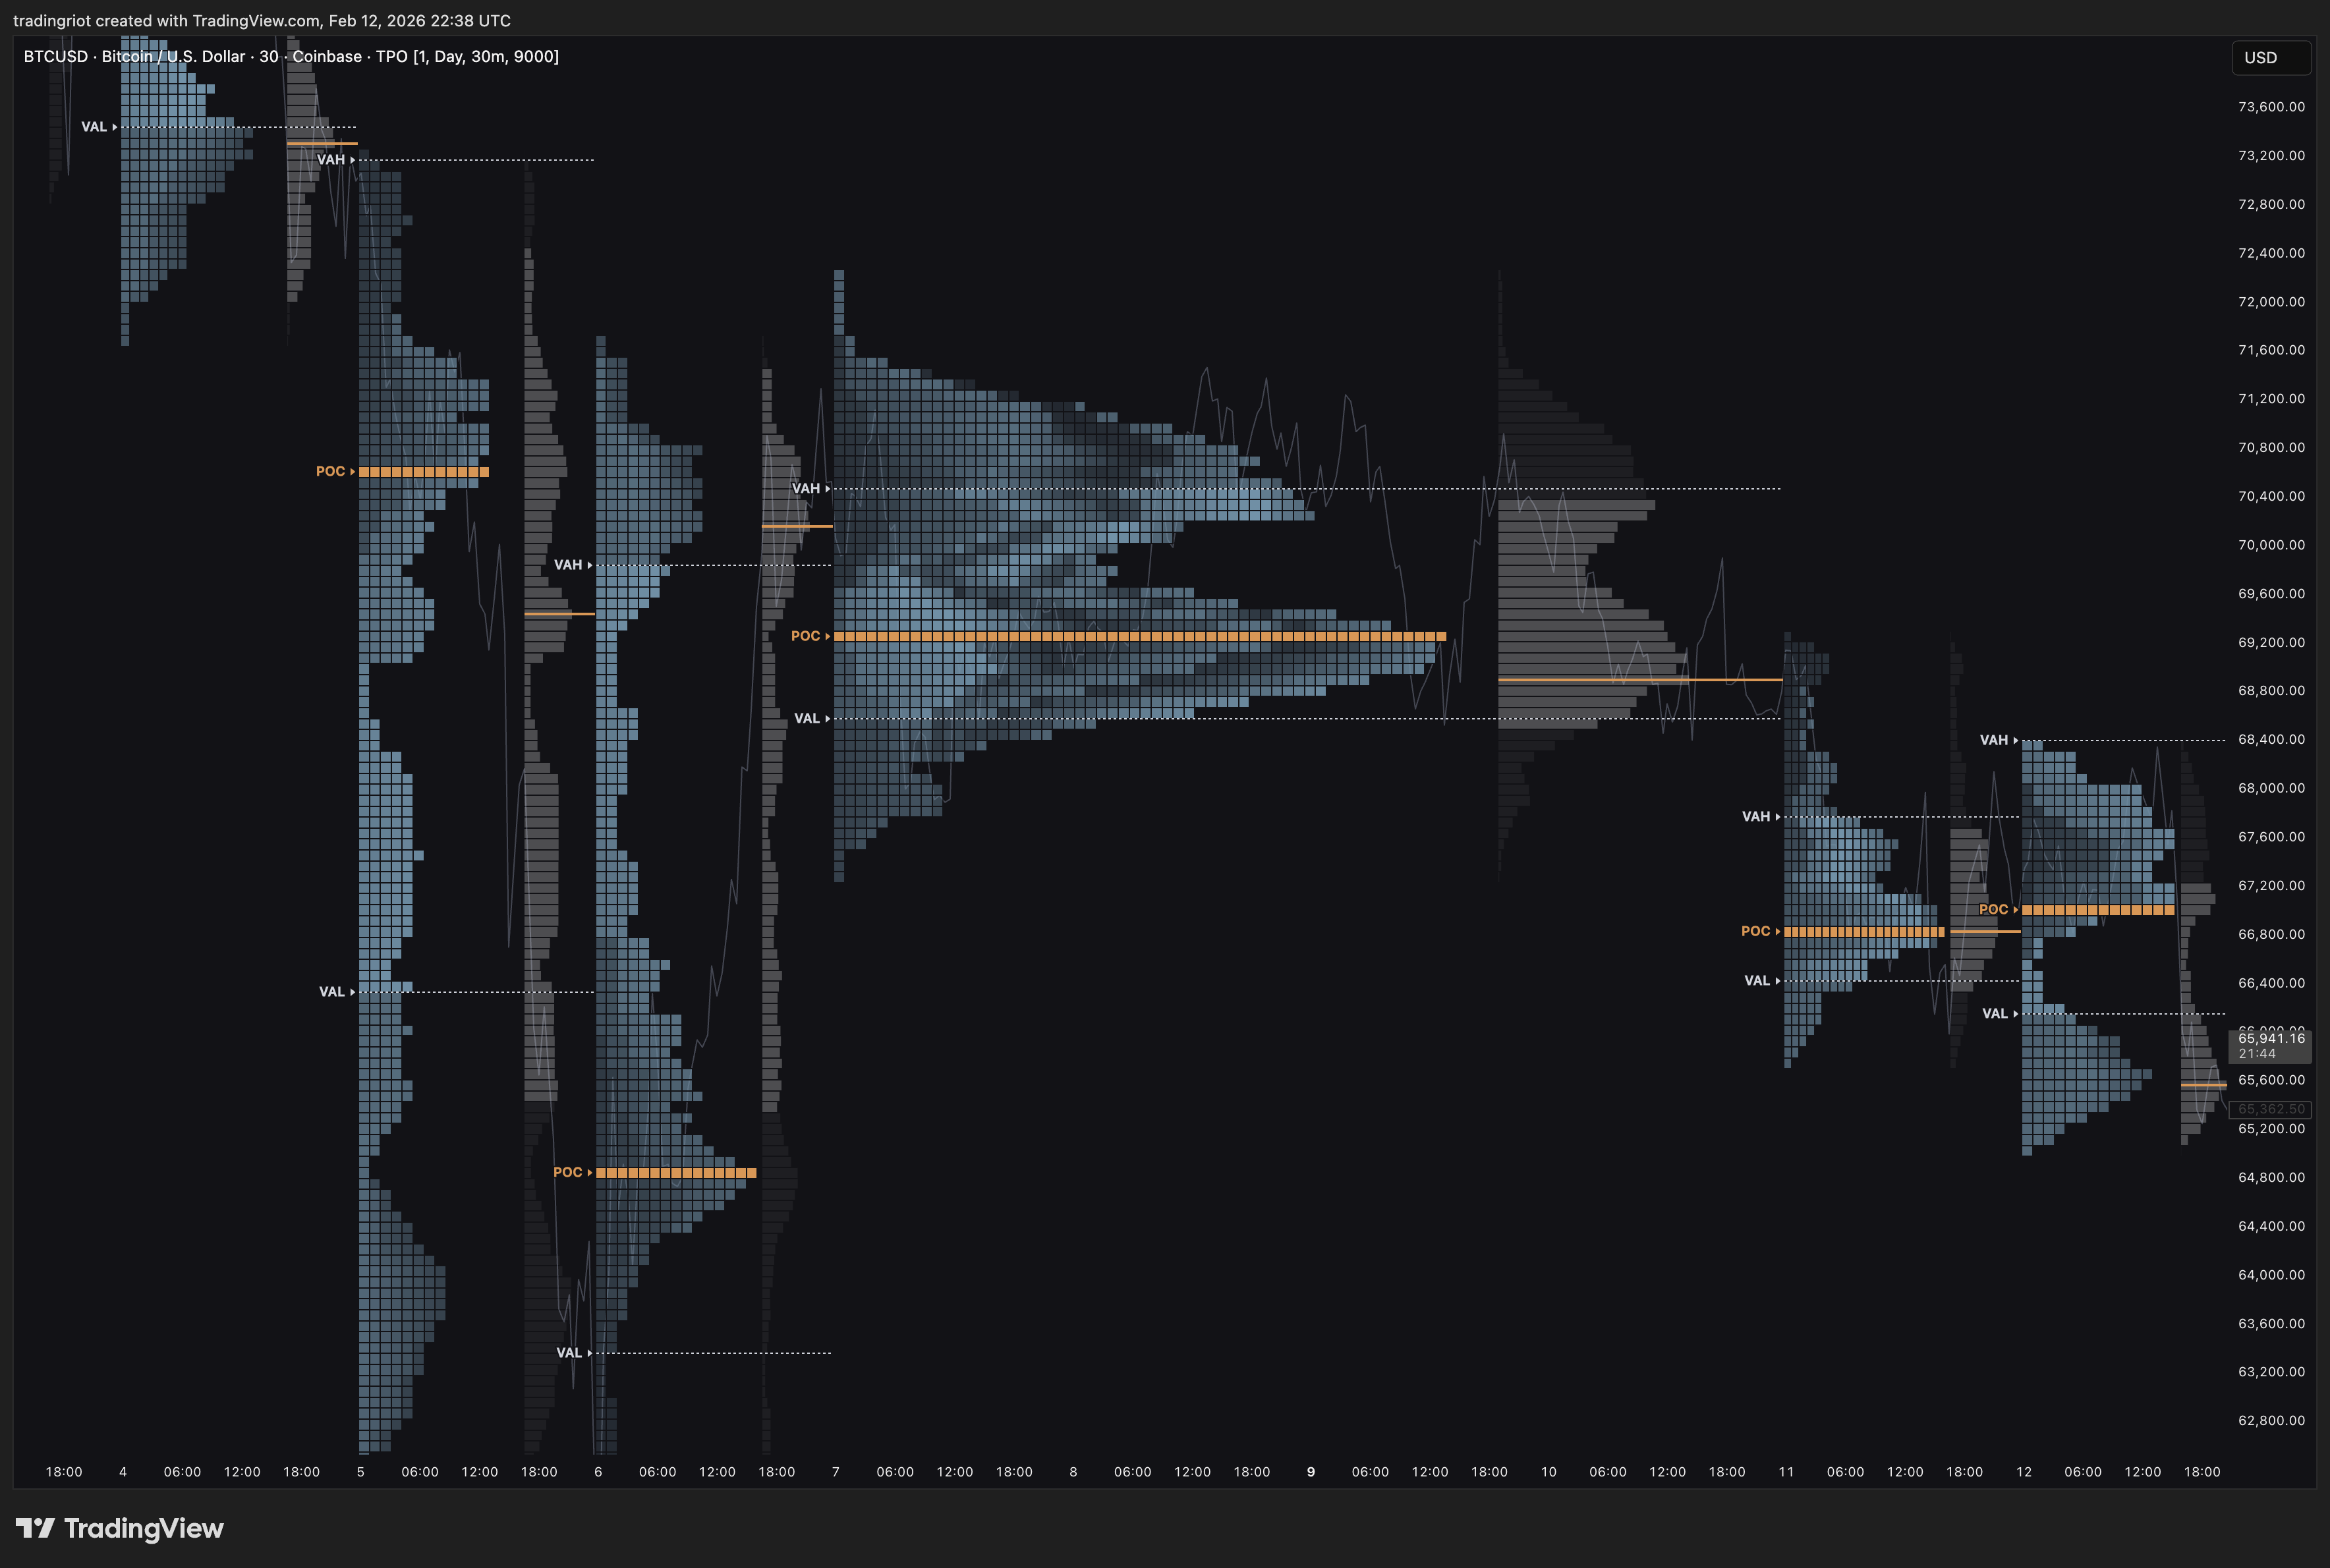
The building block of a Market Profile chart is the TPO, or Time Price Opportunity. The default and most common setting uses 30-minute time intervals.
Instead of candlesticks, you see strings of letters. Each string of letters represents one 30-minute candle. After the trading session is done, you can collapse all letters to form a bell-shaped distribution.
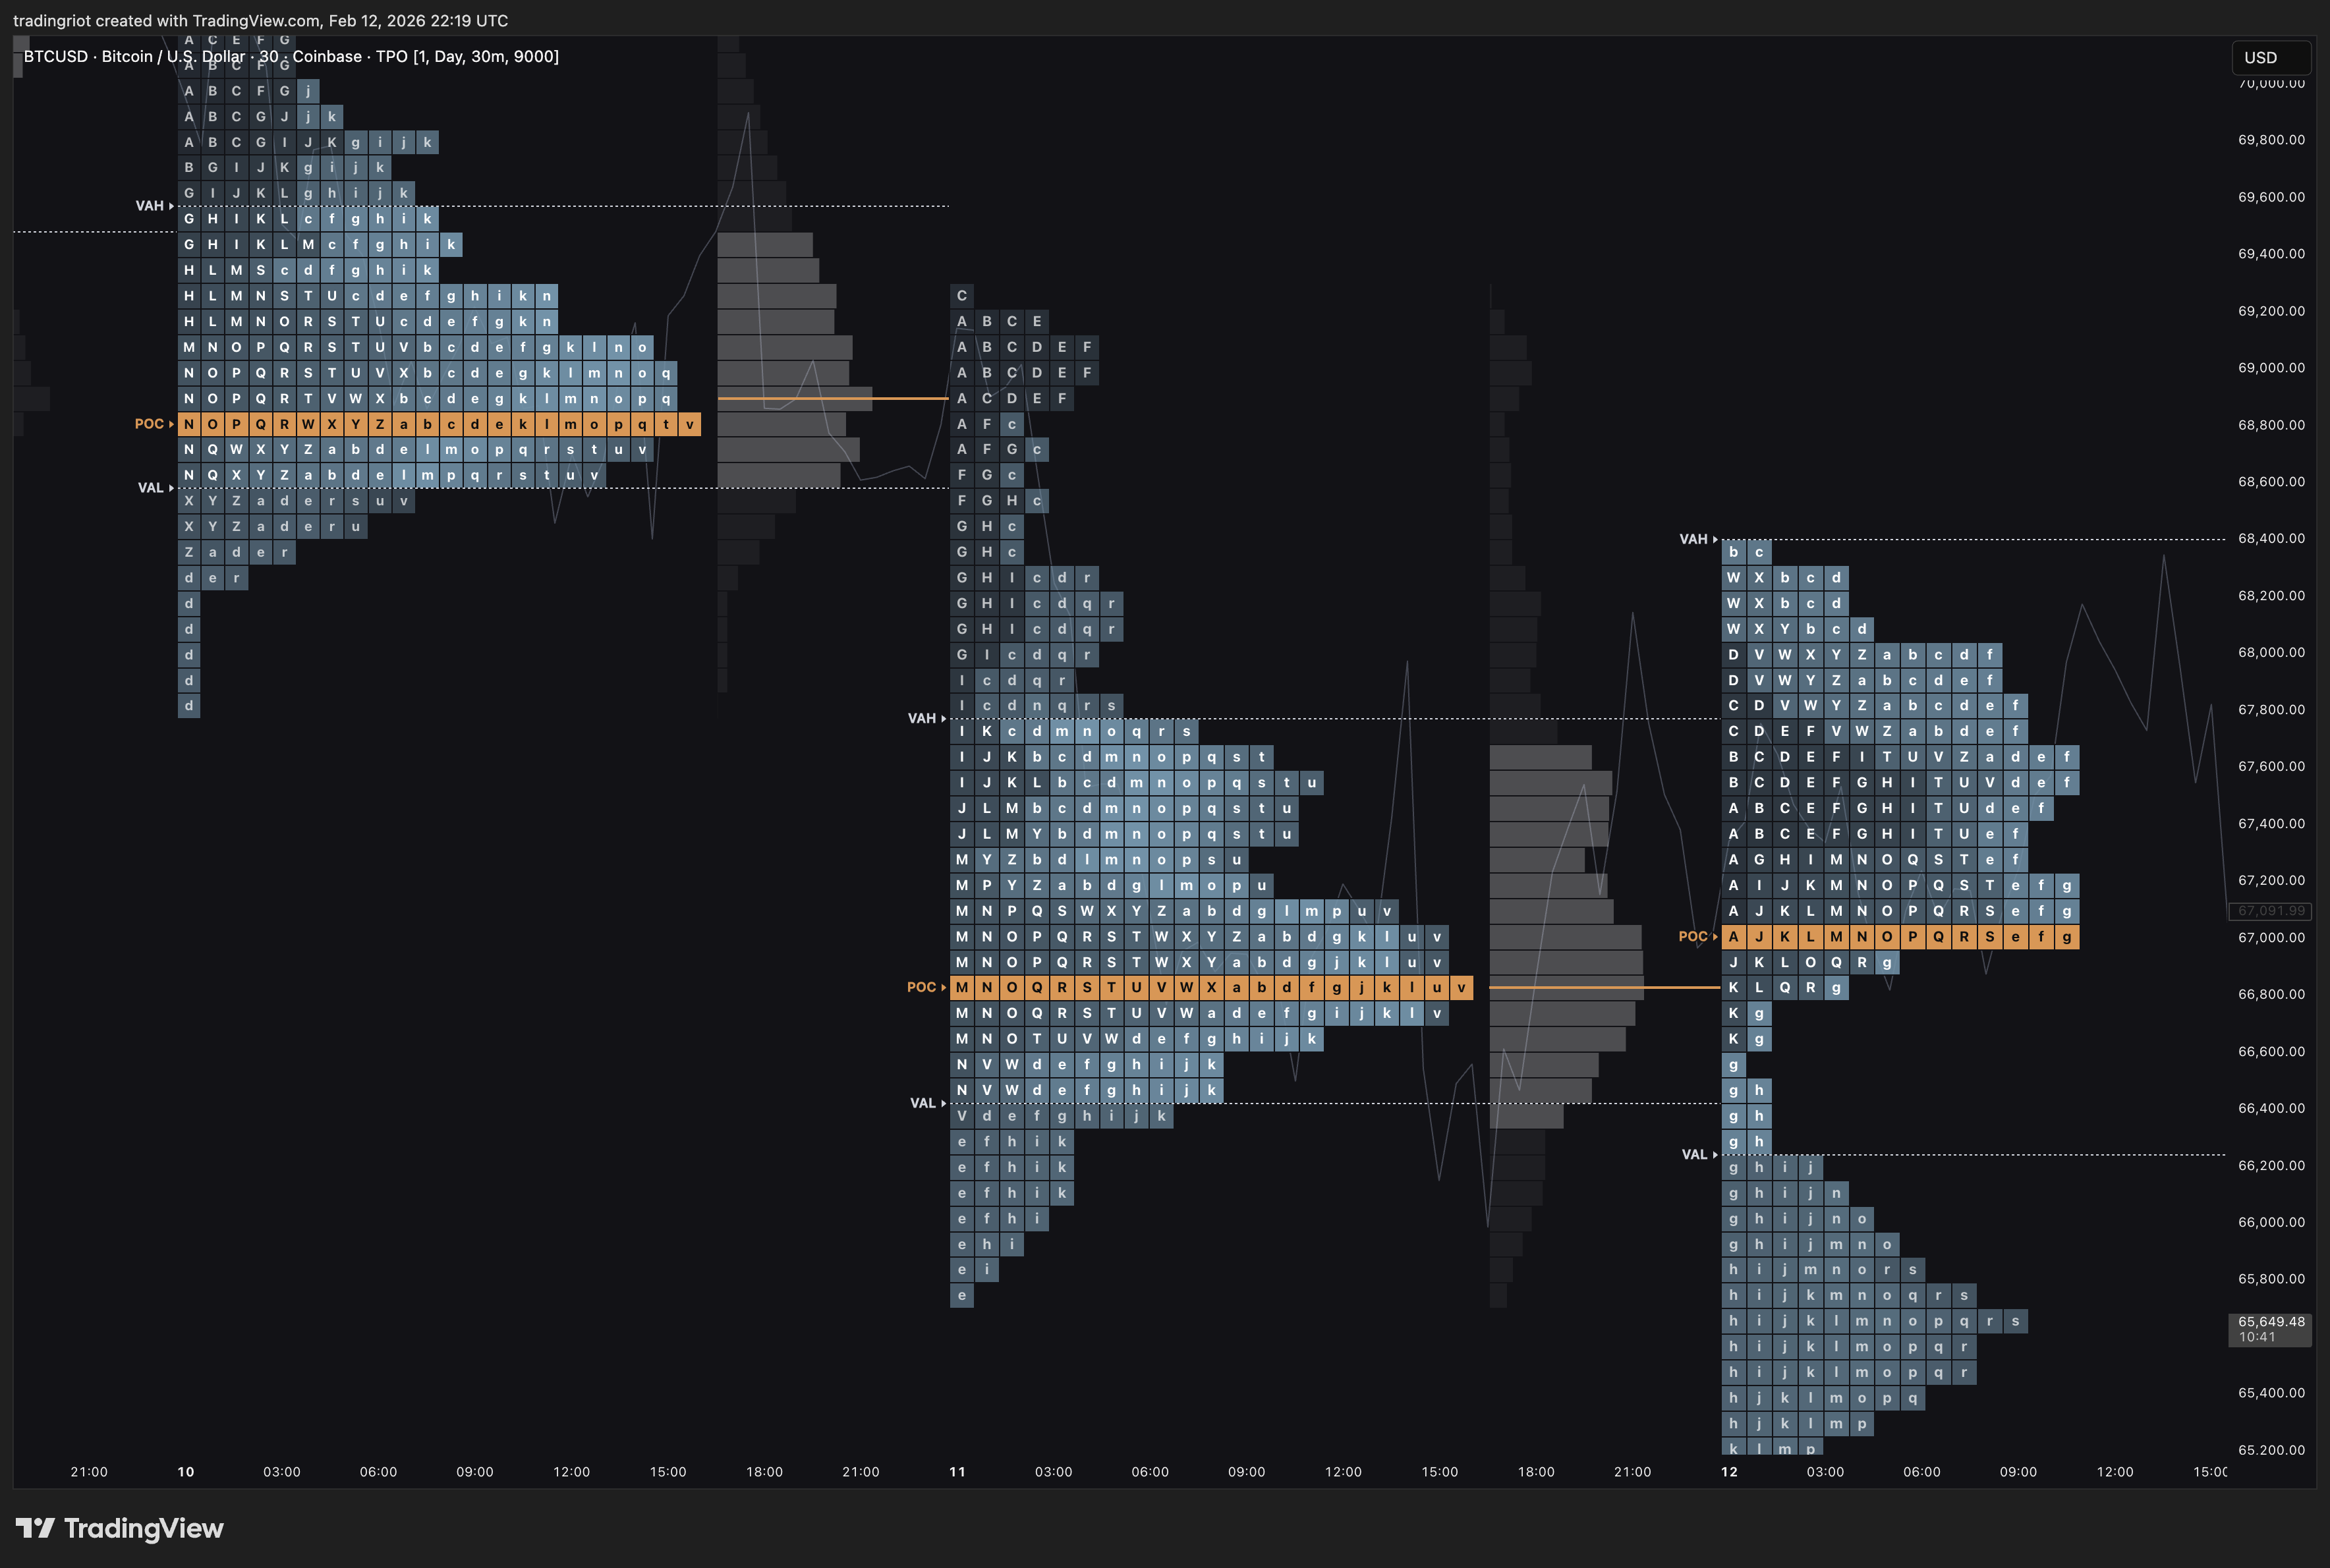
In the Market Profile, the Value Area represents 68% of data within one standard deviation of the mean. In other words, it is the area that contains 68% of the trades that occurred during a single session, measured by time.
Because this is where most of the activity happened, we can say that buyers and sellers agreed on prices in this area. In the center of the Value Area sits the Point of Control, the price closest to the center where the most TPOs printed.
The great advantage of using Market Profile is that you end up with market-generated information instead of subjective levels.
Volume Profile
If you understand Auction Market Theory and Market Profile, Volume Profile becomes very easy.
Volume represents the number of contracts or shares traded between buyers and sellers for a given period.
In stocks, volume is the number of shares traded. In futures and options, it is based on the number of contracts exchanged.
From the three components of Auction Market Theory, volume is the most important in the current age of trading.
By looking at volume, we can see where other market participants were interested in doing business.
Market Profile vs Volume Profile
The key difference is simple.
Market Profile measures how much time was spent at each price level. Volume Profile measures how much volume was executed at each price level.
Both produce a similar bell-curve shape, but the levels they generate can differ.
It is honestly completely up to you which one you prefer. There is a strong argument for using volume since in the current day and age volume is what matters, but it can also be easily skewed.
For example, in futures the most volume during a trading day happens in the last hour as many traders are simply forced to close positions. This does not necessarily represent the market's fair value.
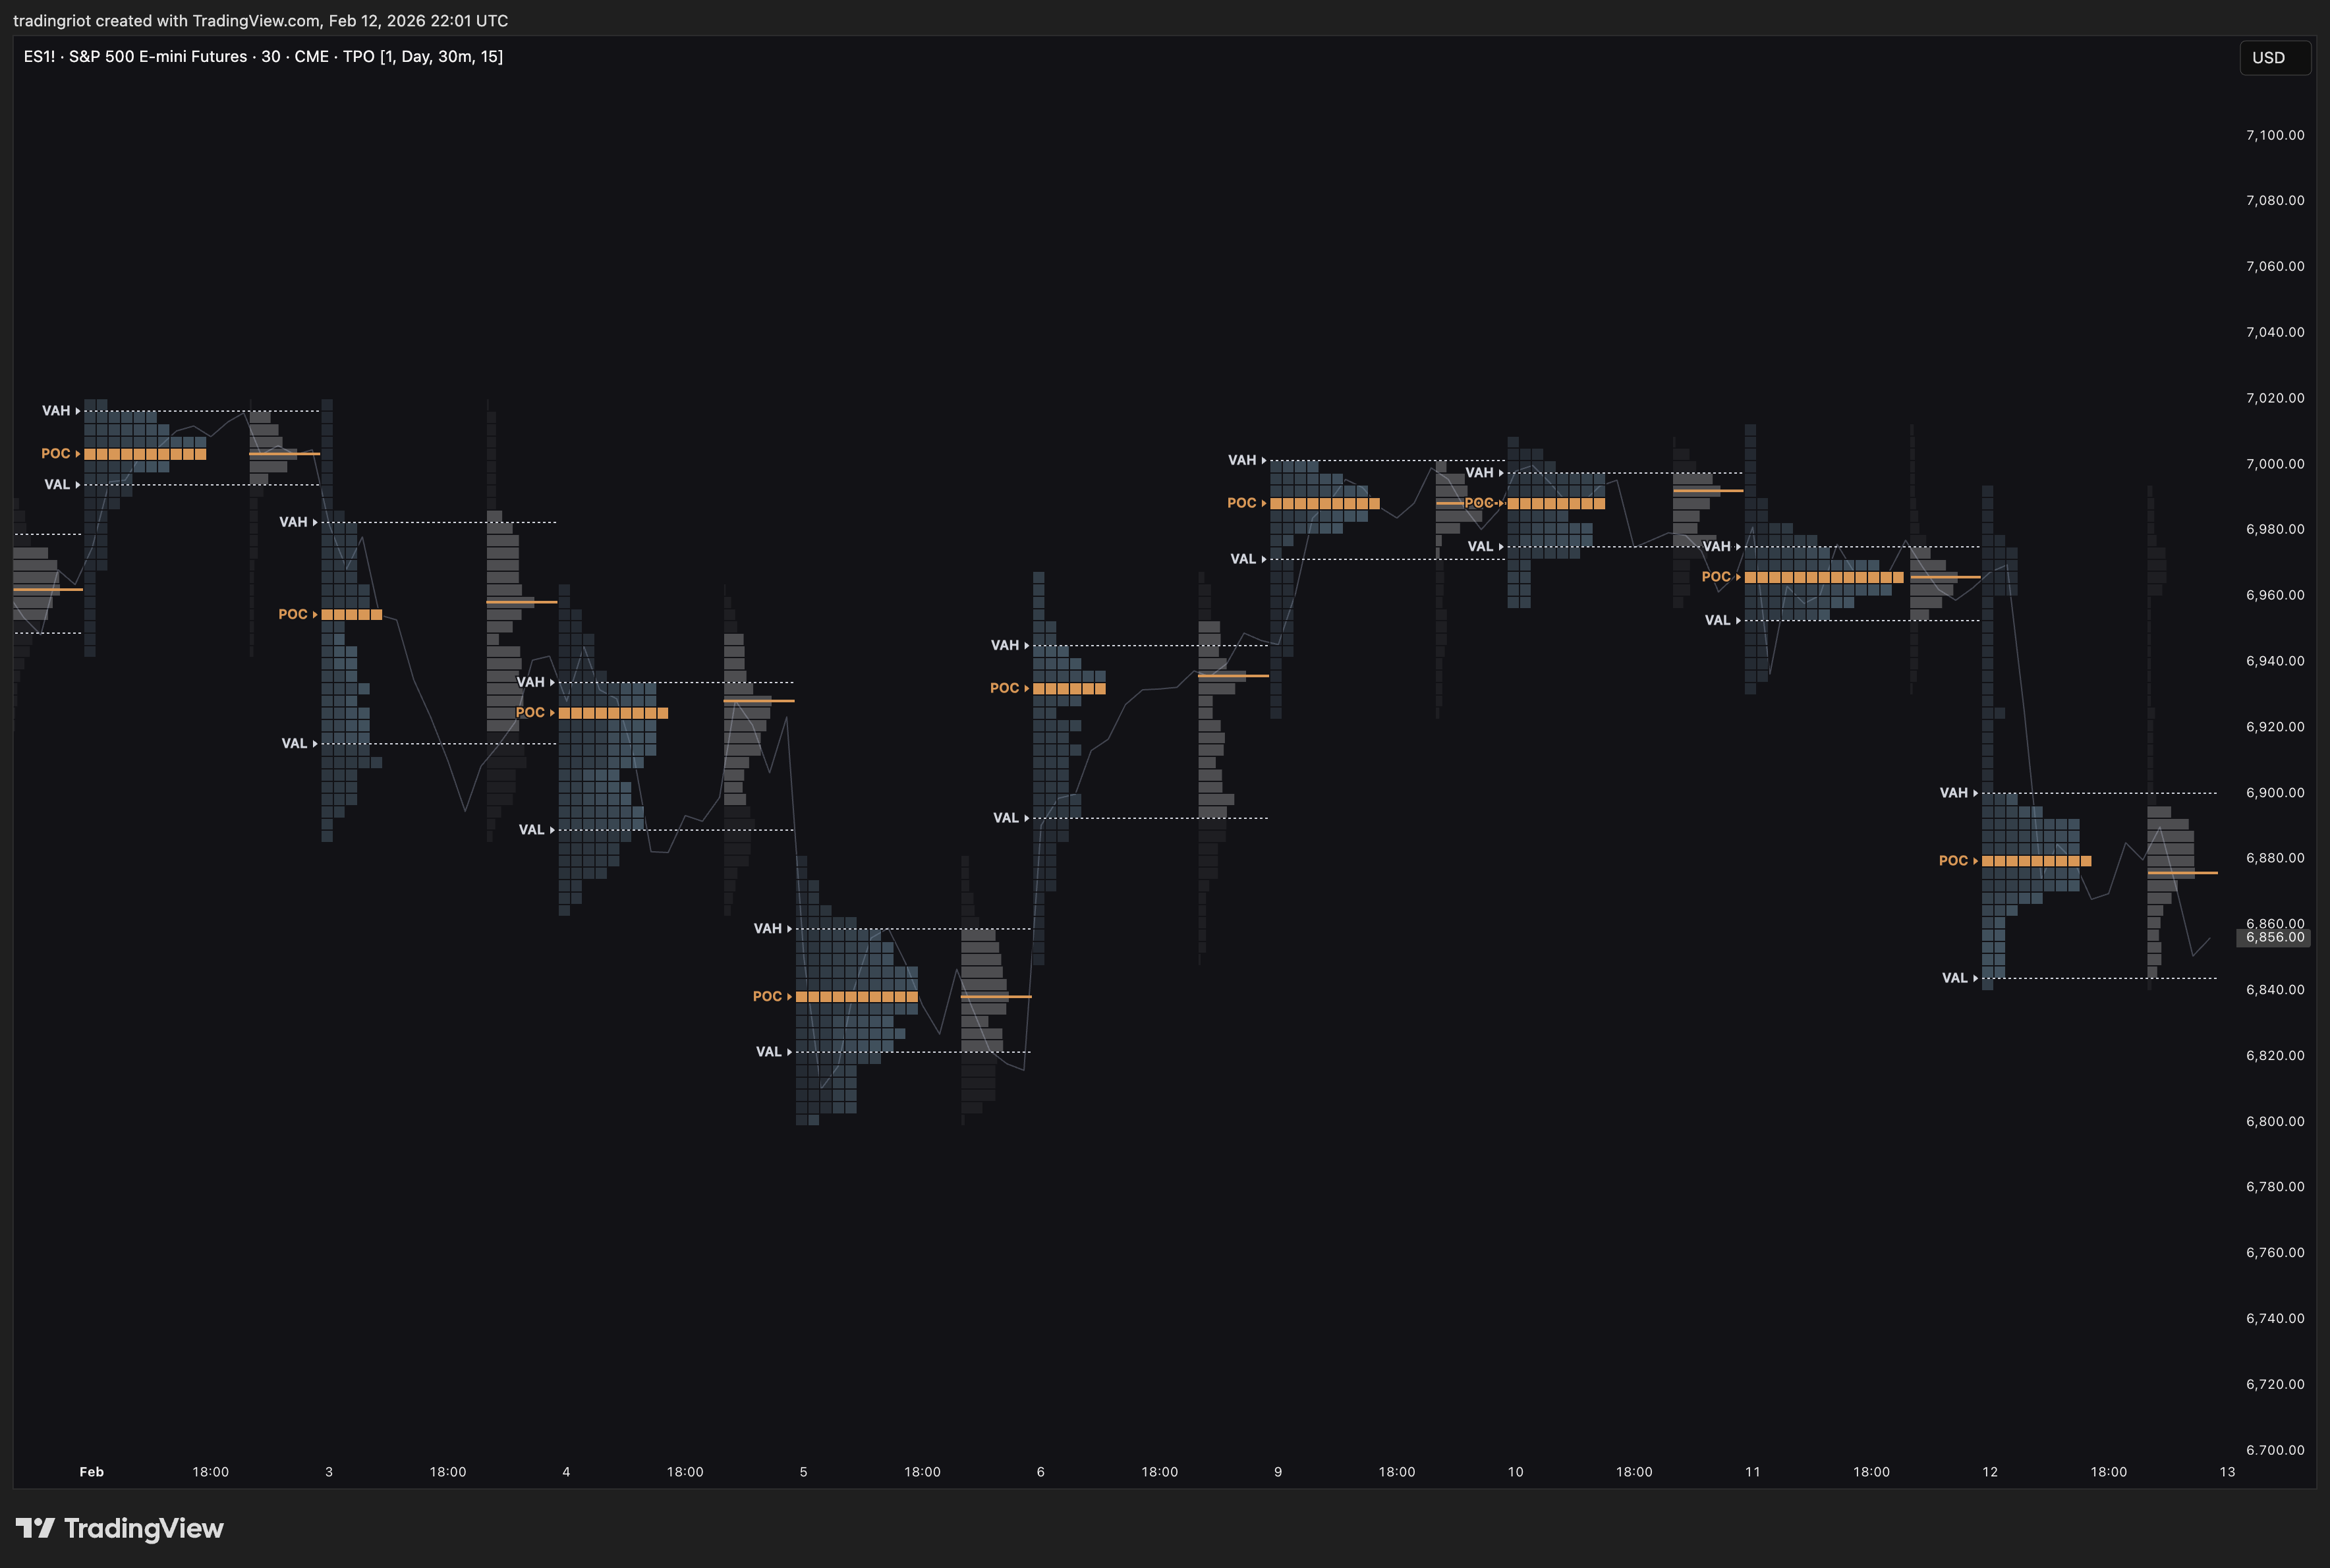
Composite Values
While Market Profile and Volume Profile are often displayed on a day-to-day basis, you might have noticed that in previous examples I showed you the value areas over many days, sometimes weeks or months.
These are called composite values. Composite values are created when you overlay one or more days where the value areas overlap.
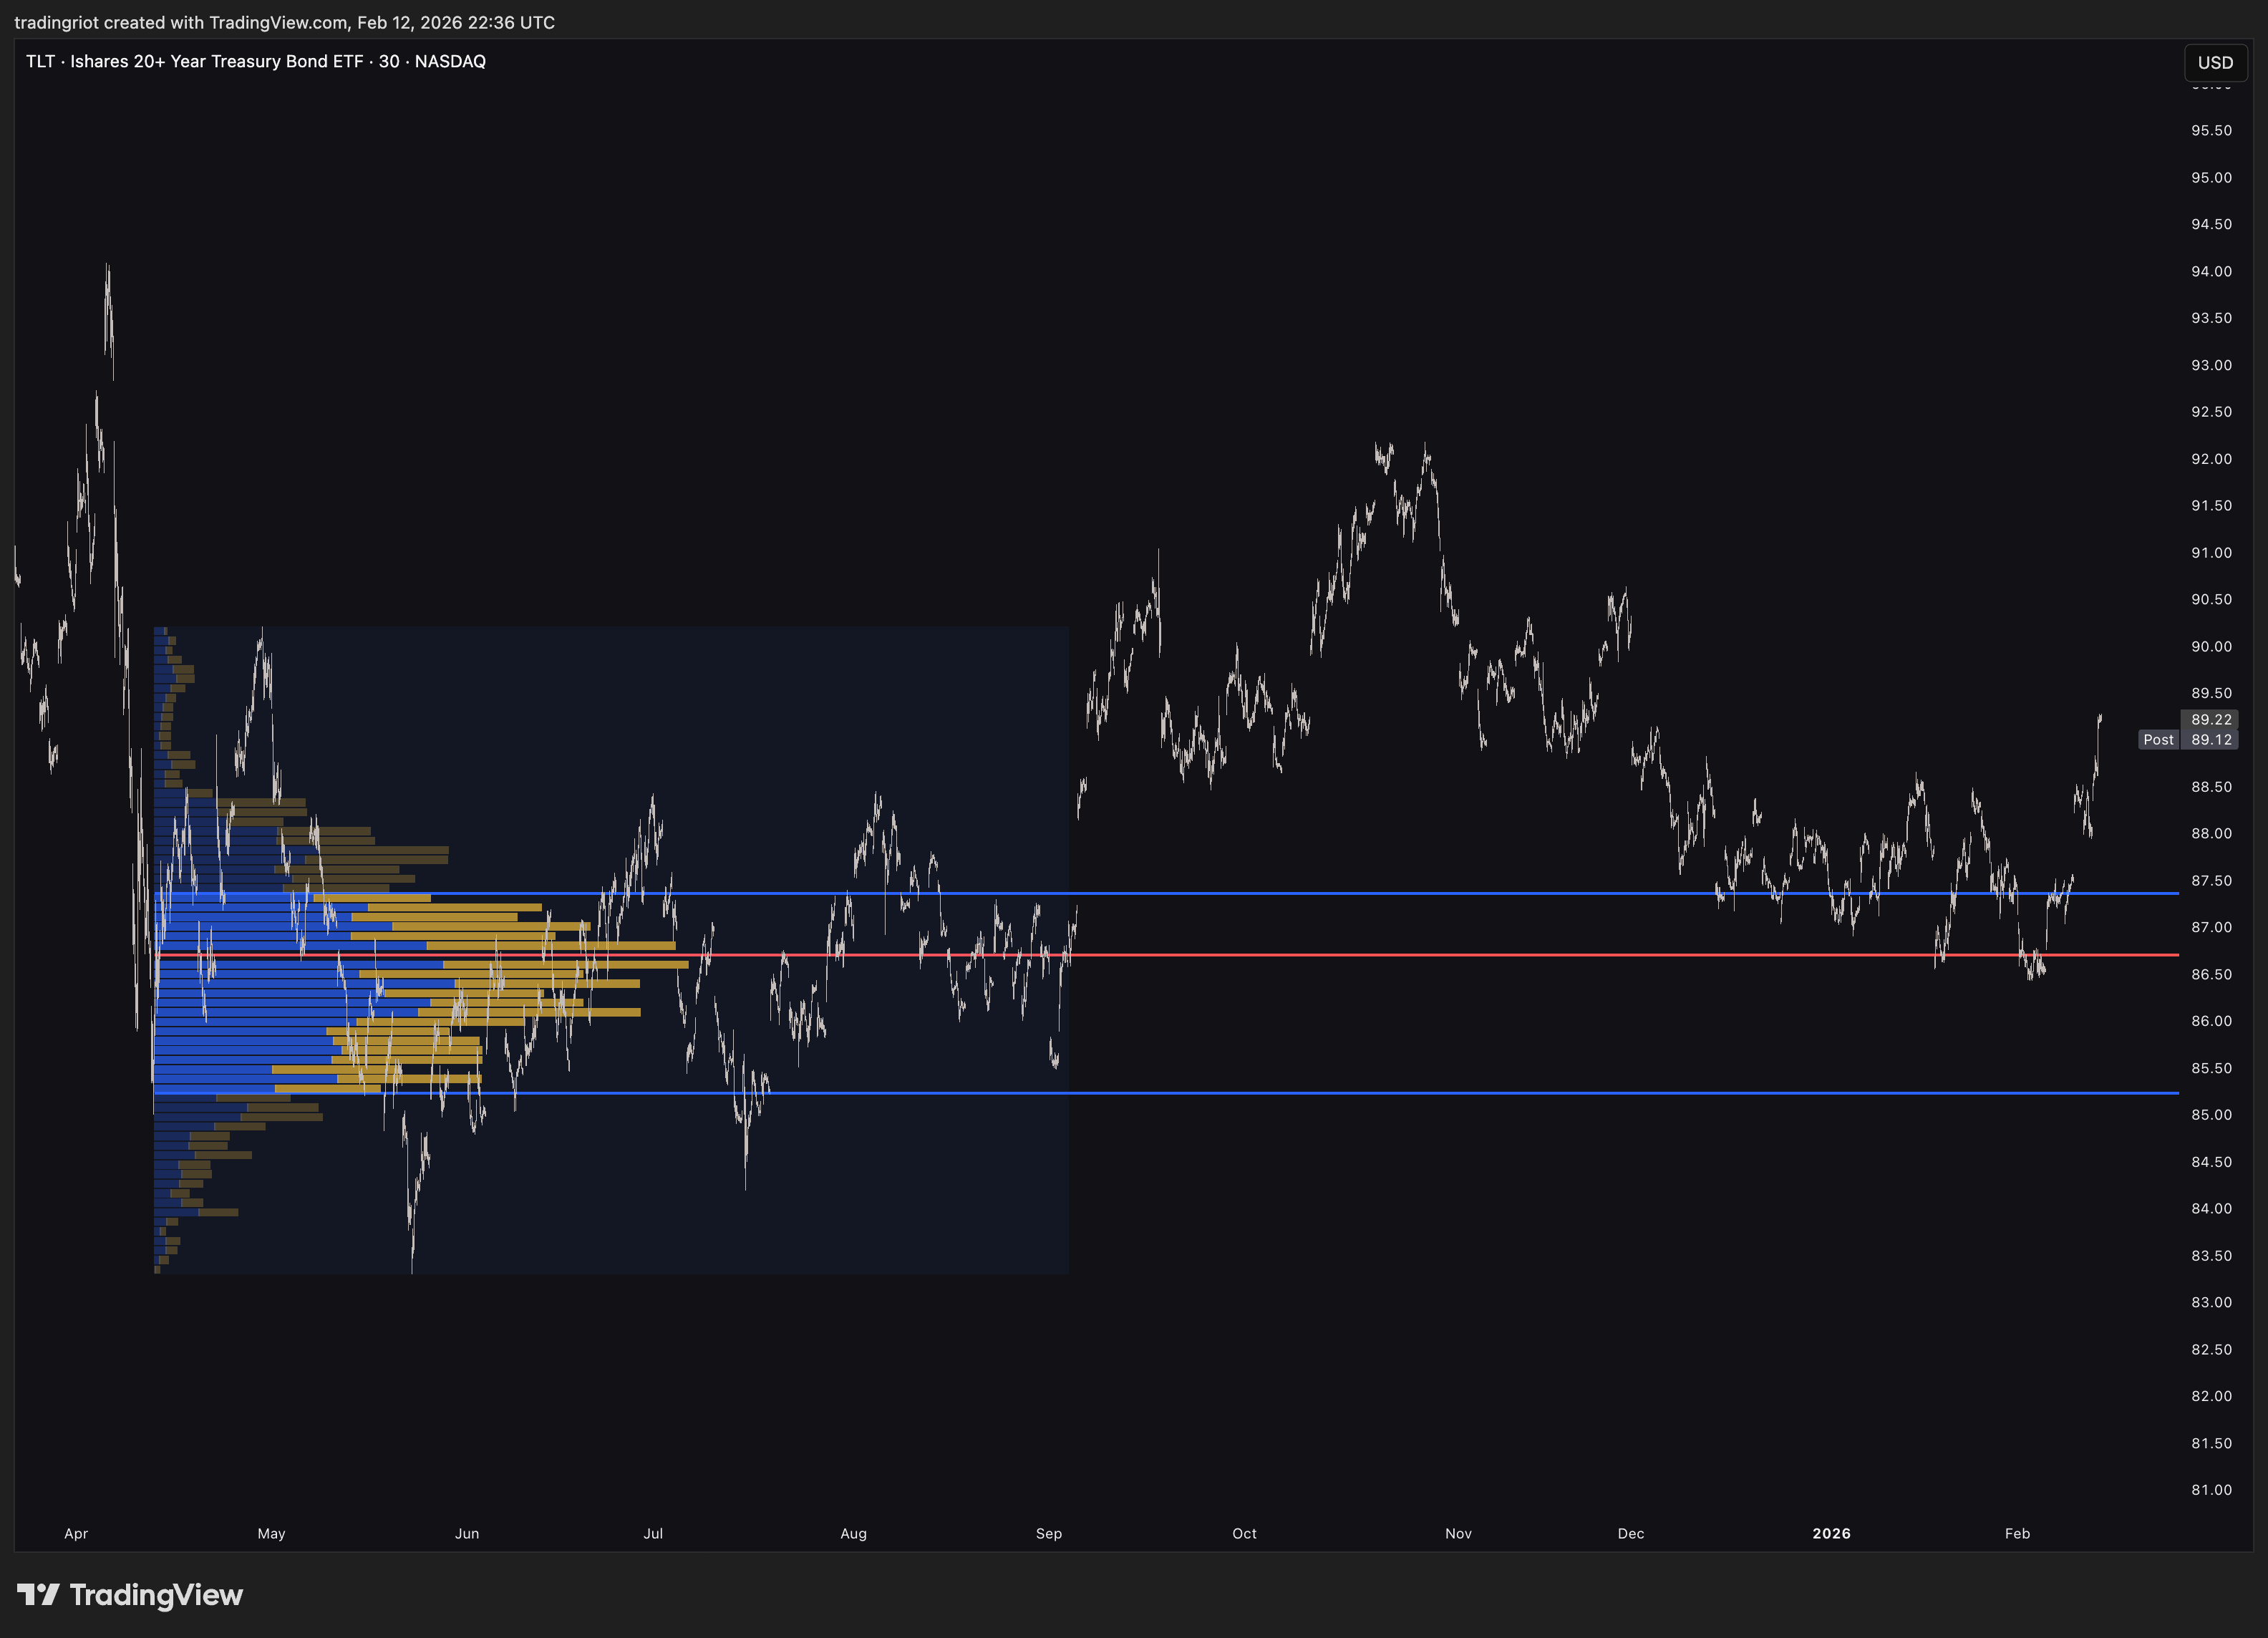
This can be done with both Volume and Market Profiles. Volume composites are usually used to highlight bigger ranges while Market Profile composites serve day trading ranges.
These composite can be either created manually by eye-balling the overlapping values, or used on fixed look backs such as weekly, monthly, quarterly or yearly.
Volume Weighted Average Price
Volume Weighted Average Price (VWAP) is calculated by taking the cumulative total of price multiplied by volume, divided by the cumulative total of volume. In simple terms, it gives you the average price of an asset weighted by how much volume was traded at each price level.
The key difference between VWAP and a simple moving average is that VWAP puts more weight on price points where more volume was traded. On a 30-minute chart, you might see a $0.30 difference between a 24-hour simple moving average and the VWAP. That difference comes entirely from the volume weighting.
VWAP is most often plotted on fixed time horizons such as daily, weekly, monthly, or yearly, but you might also experiment with anchored or rolling VWAPs.
The Institutional Use Argument
If you have ever watched a video or read an article about VWAP, one of the first things you hear is that VWAP is used by large players and therefore you must use it too.
The reality is more nuanced. Institutional traders often use VWAP as a benchmark for execution quality, not necessarily as a directional signal. Their algorithms are designed to execute large orders at or near VWAP to minimize market impact. This does not mean that VWAP acts as some magic level of support and resistance because institutions are “defending” it.
It is completely useless to make huge assumptions based on VWAP and justify trading decisions with this “institutional trading approach,” simply because you never know what someone on the other side of the screen is about to do. With that said, VWAP is a valuable tool when used properly and without the mythology.
VWAP Standard Deviation Bands
This is where VWAP and Auction Market Theory connect.
By adding standard deviation bands around VWAP, we create a framework that directly mirrors AMT concepts: the VWAP line represents fair value, and the bands represent areas where price is statistically extended from that fair value.
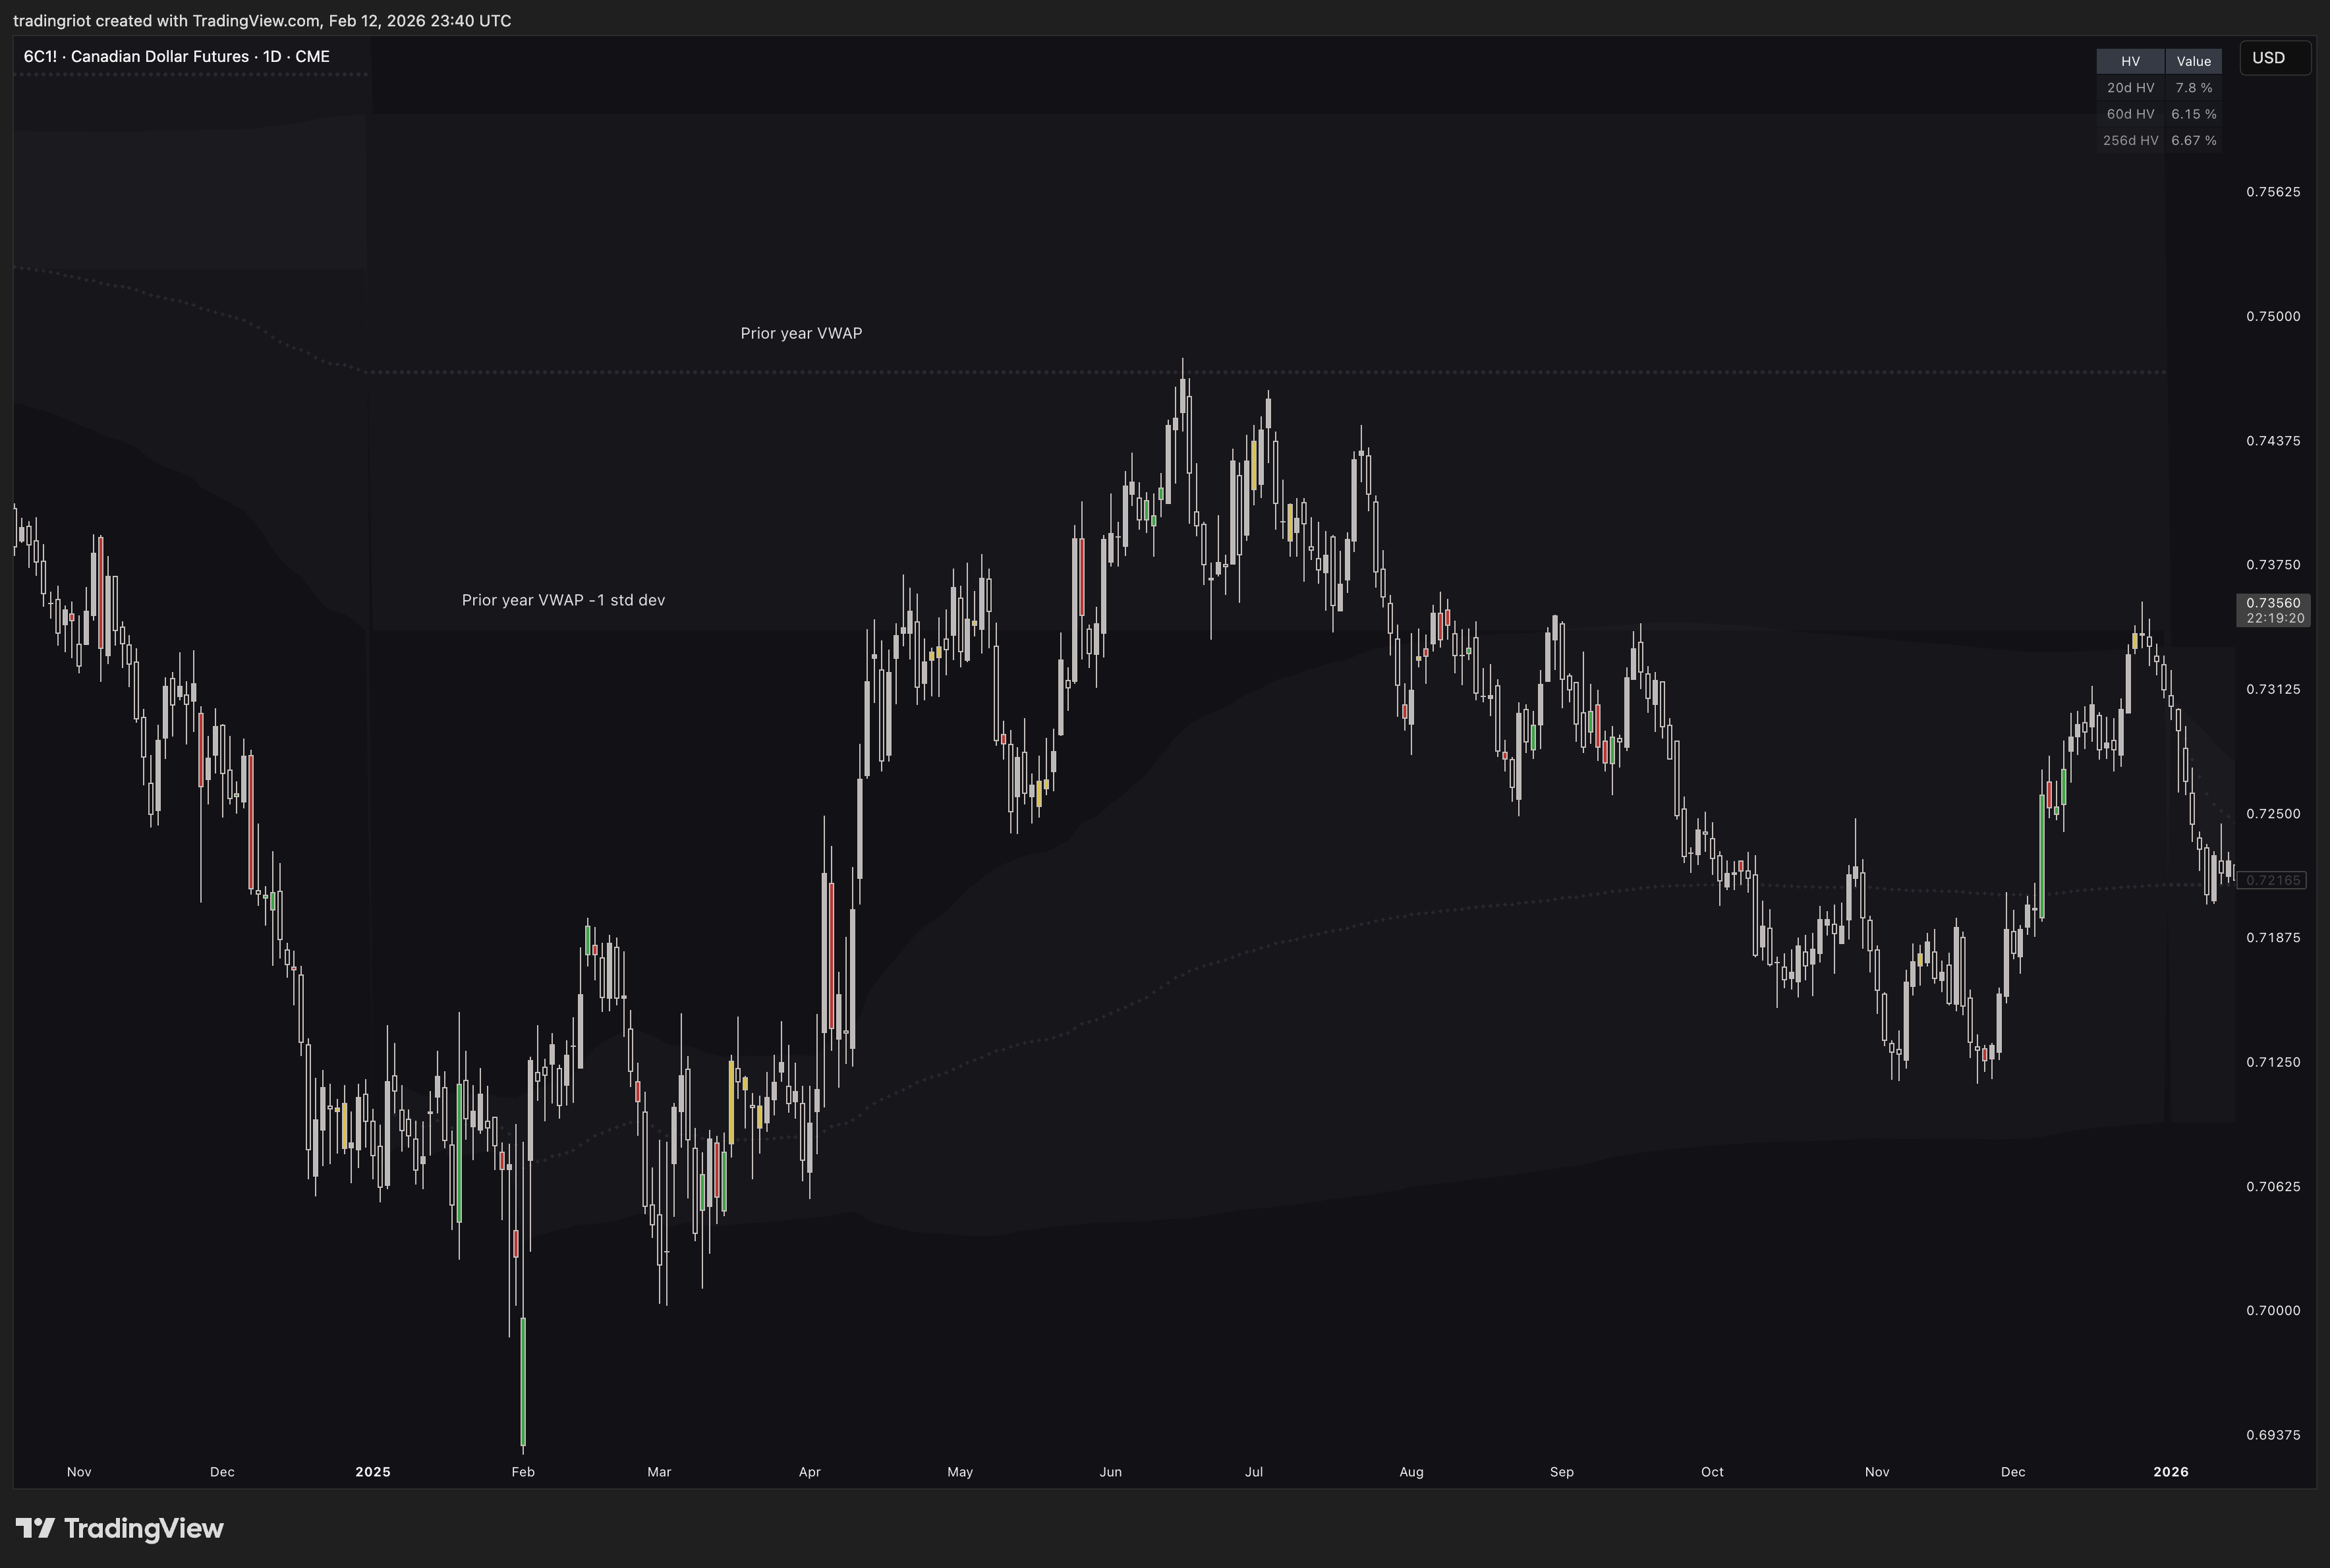
As you can see on the chart of Canadian dollar futures, the yearly VWAP is used, therefore each VWAP represents one trading year.
After price re-accepted into the prior year’s value area, it traveled to the prior year’s VWAP which acted as a point of control.
After breaking down, the -1 standard deviation served as resistance before rotation through the current value area.
These levels are never going to be perfect, but they This is where you can very loosely follow the Auction Market Theory rules.
I generally expect prices to range when they hit a key Point of Control or VWAP. When the reaction is strong, this can break that rule.
I prefer to look for trending moves once price breaks outside of the value, simply because there is going to be less volume resisting price from going in the desired direction.
Putting It All Together
Auction Market Theory is a framework, not a strategy.
It tells you how to think about markets: as a continuous two-way auction process where participants negotiate prices between balance and imbalance.
Market Profile gives you the time-based structure of that auction. Volume Profile gives you the volume-based structure. VWAP with standard deviation bands gives you a dynamic, representation of fair value and its boundaries.
None of these tools work in isolation, and none of them are a magic.
What they provide is context. Knowing whether you are inside a value area or outside it, whether the market is balanced or imbalanced, whether new prices are being accepted or rejected, these are the questions that actually matter.
Whether you are trading directionally or running non-directional strategies like selling options premium, knowing where fair value sits and whether the market is balanced or imbalanced gives you a significant edge.
Even simple technical analysis such as price action can be beneficial when used as confluence to spot acceptance into value or breaks outside of it.
At the end of the day, no single tool or concept will give you all the answers, but understanding the auction process behind every market will make everything else you use more effective.
A gift to aspiring trades. Well done
How do you find them on trading view