
How To Trade Cryptocurrencies
Complete guide on crypto trading

While the times of crypto being a wild west are mostly gone, as the whole asset class has matured a lot over the years, crypto is still a fairly young market offering an edge for those willing to put in the work.
There are still a lot of advantages to choosing crypto over other asset classes.
One of the primary benefits of trading cryptocurrencies, in contrast to markets like forex or futures, is the widespread availability and often free access to a wealth of data.
Forex is traded OTC, and futures markets provide data at high cost. On top of that, these markets have much more sophisticated participants, as most of the quant firms are probably not too thrilled to go and trade Fartcoin.
All this makes crypto very attractive. The market trades 24/7, so you can go long, go short, or delta neutral across a range of strategies.
Of course this comes with cost, the volatility that exists in crypto can probably be found only in penny stocks and over the years we saw many scams, collapses and the market behaviour which turned off a lot of people.
But this volatility that scares most people off is the same volatility that pays you for showing up.
While this article is not going to cover much of a conventional technical analysis or tell you where to buy or sell, it will cover everything you need to know if you want to start trading crypto.
For reference I usually hold positions from days to weeks, but I am sure all of the concepts covered can be adjusted to lower timeframes as well.
All analytics in this article are powered by TradingRiot Analytics. Sign up to access data for 1,000+ futures, crypto, stocks, and ETFs, plus education on turning data into strategies. Those interested trying it out can use code “ANALYTICS” to get 50% off their first month.
Perpetual Futures
If you end up trading crypto you are very likely going to trade perpetual futures, of course you can just buy spot, log out and go enjoy life like a normal human being, but where is fun in that?
In a simple terms, a perpetual future is a derivative contract that tracks the price of an underlying asset, trades with leverage, and never expires.
It is the dominant instrument in crypto, accounting for the large majority of all trading volume. To understand why it behaves the way it does, it helps to start with the thing it was modeled on and then deliberately broke: the classical future.
A traditional futures contract is an agreement to buy or sell an asset at a set price on a set date called expiration.
Because the contract must settle, its price is tethered to spot by arbitrage: as expiry approaches, the futures price and the spot price converge, and at settlement they are the same. Any gap between them before then is the basis, and it reflects the cost of carry, financing, storage, and the time left on the contract.
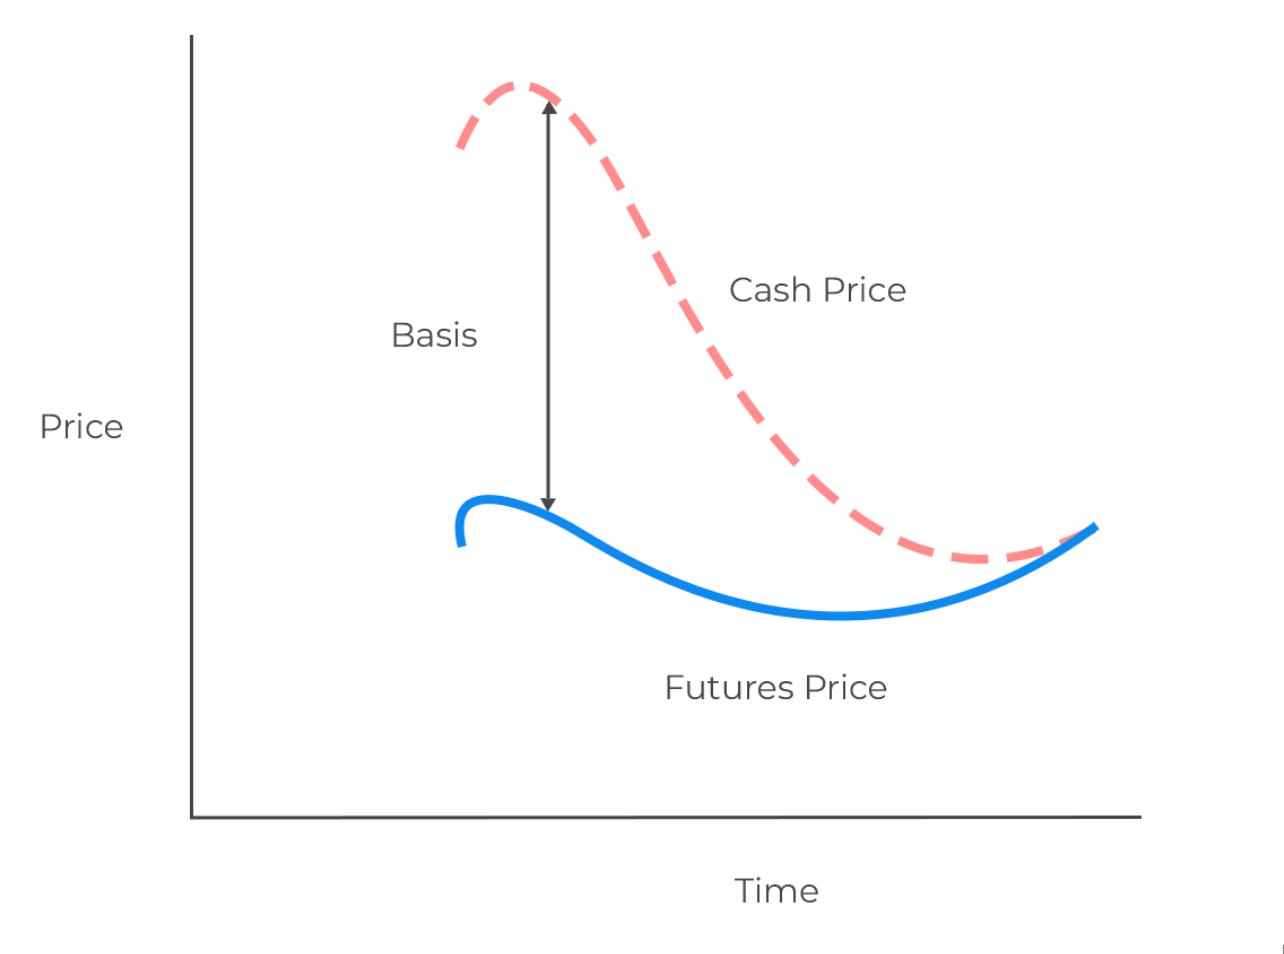
The main purpose of traditional futures is hedging for different producers and companies to hedge their exposure in the underlying.
Expiry also forces a term structure. An exchange lists many contracts on the same asset, each with a different expiry, and the prices of those contracts form a curve. When longer-dated contracts trade richer than spot, the market is in contango. When they trade cheaper, it is in backwardation. A trader who wants to hold exposure past expiry has to roll, closing the expiring contract and opening the next one, paying or receiving the basis each time.
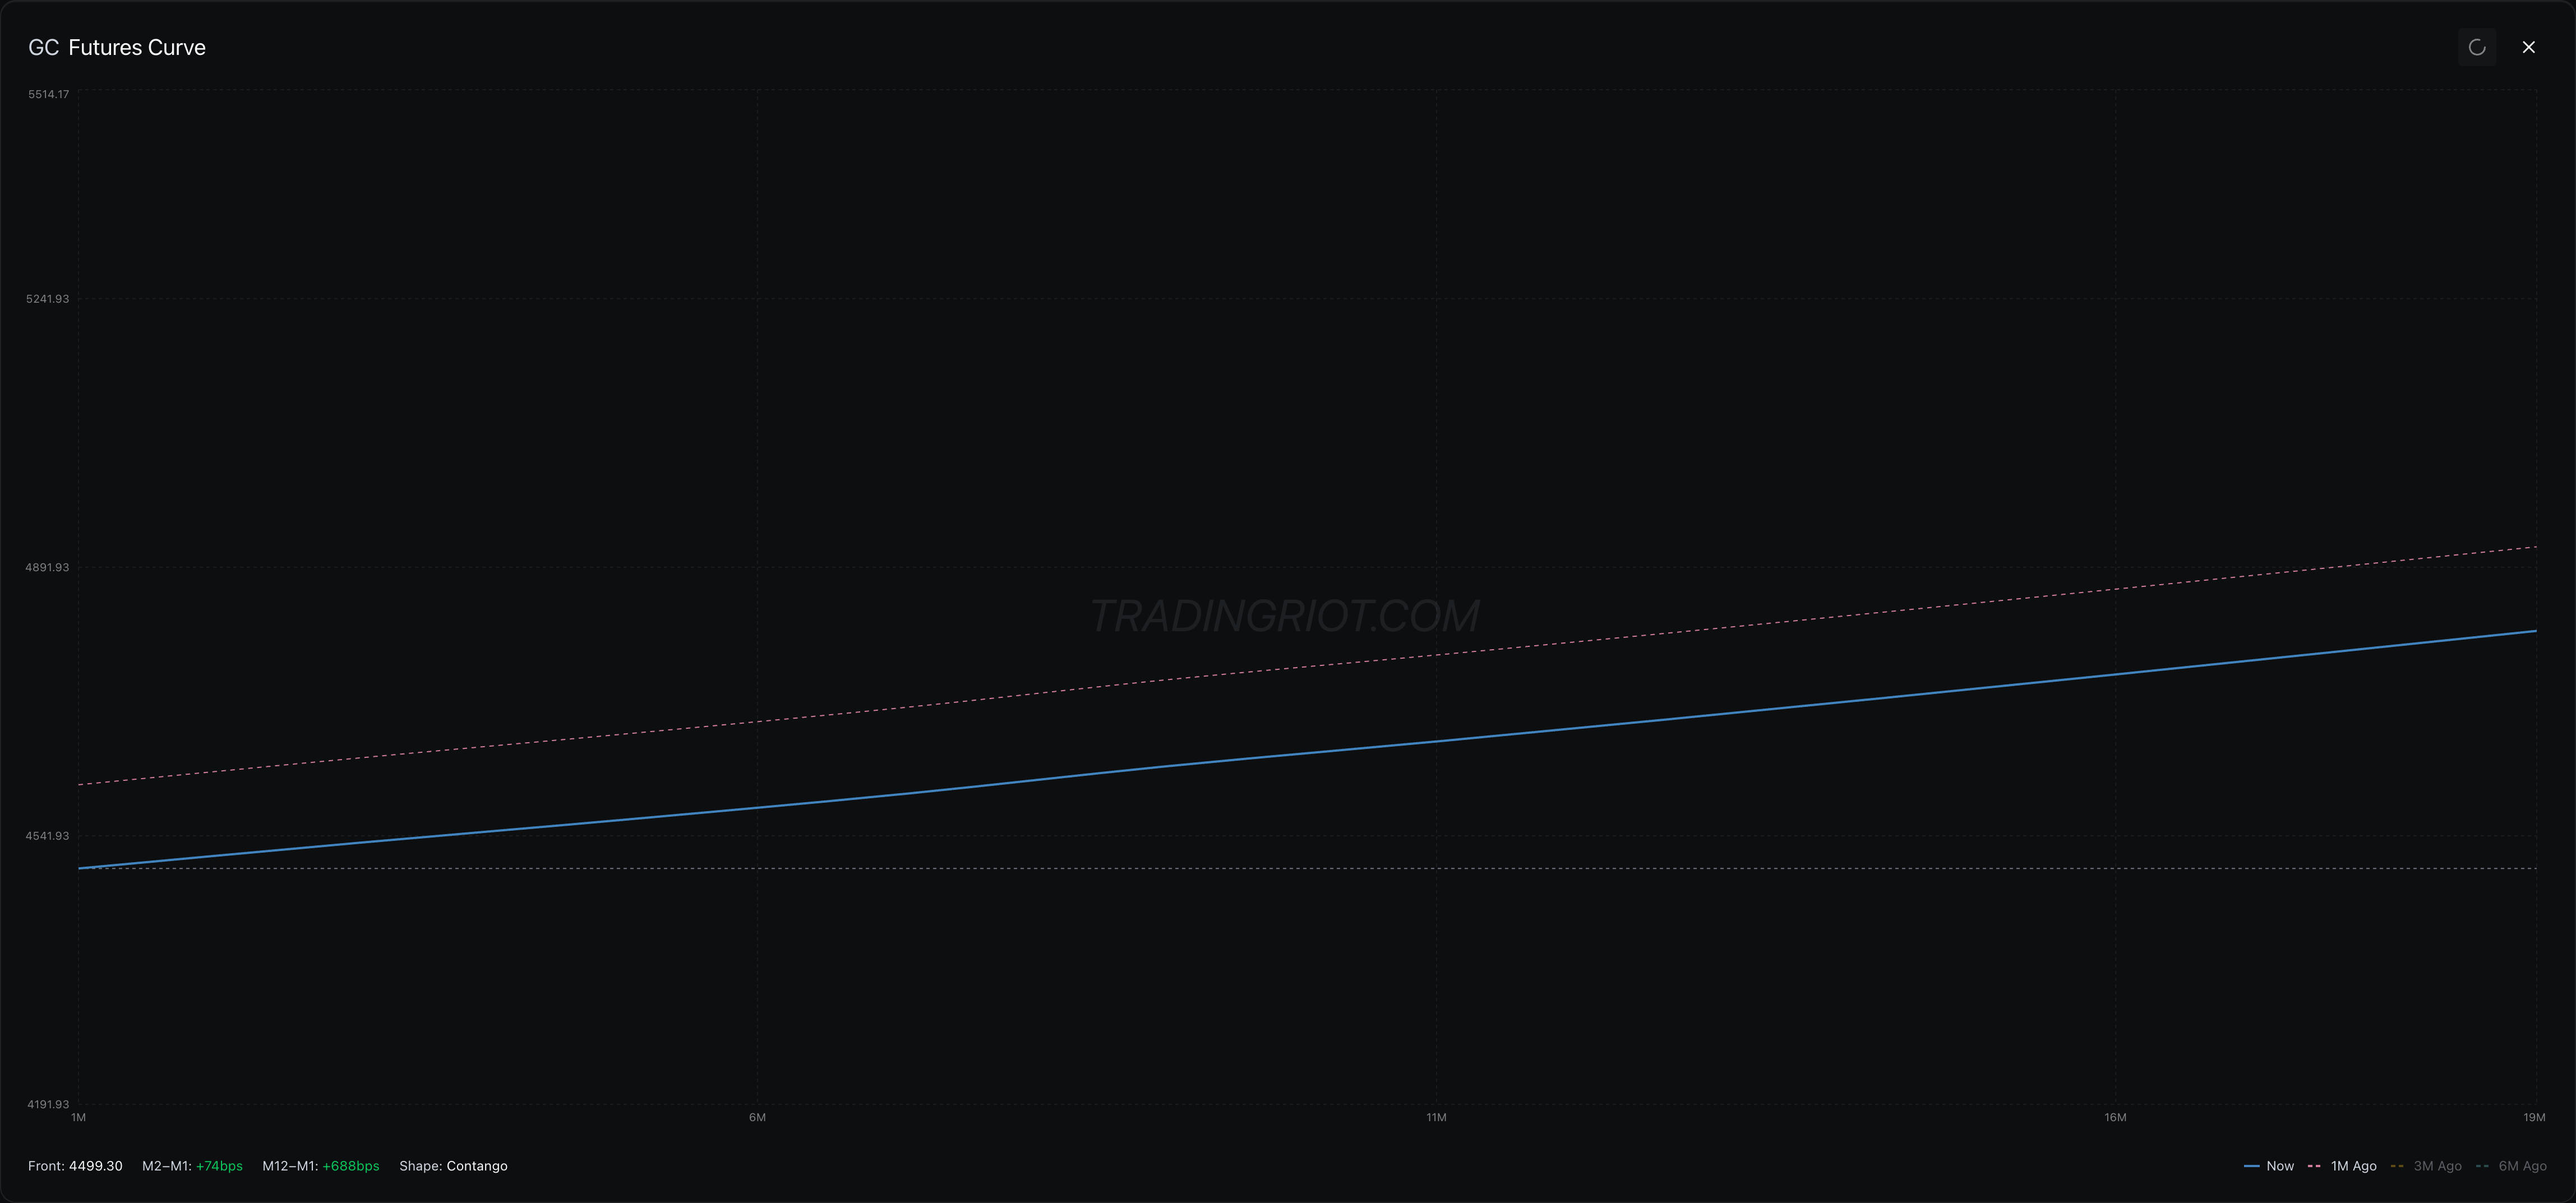
This system works, but has a lot of friction like rolling and expiration, with liquidity fragmented across many expiration dates.
Since crypto is not a coffee (coffee has at least some intrinsic value after all), there is no need to use different expirations to hedge against rains in South America, therefore perpetual futures strip away any expirations and give users one continuous futures contract to trade.
But you cannot just delete expiration and walk away. The expiration was the thing dragging the contract back to spot. Pull it out and nothing stops a perpetual from floating above or below the real price and sitting there forever, at which point it stops tracking the asset it is supposed to represent and turns into its own little casino.
So perpetuals need something to replace the gravity that expiry used to provide. That something is the funding rate.
Funding Rates
With no expiry to force convergence, the perpetual leans on the funding rate to keep its price anchored to spot. Funding is a payment exchanged directly between long and short holders at fixed intervals, every eight hours by default on most exchanges.
For example, Binance settles at 00:00, 08:00, and 16:00 UTC. The exchange takes no cut. It only moves the payment from one side of the book to the other, and you only pay or receive it if you hold a position at the settlement timestamp.
The rate has two components: an interest rate and a premium.
Funding Rate = Interest Rate + Premium Index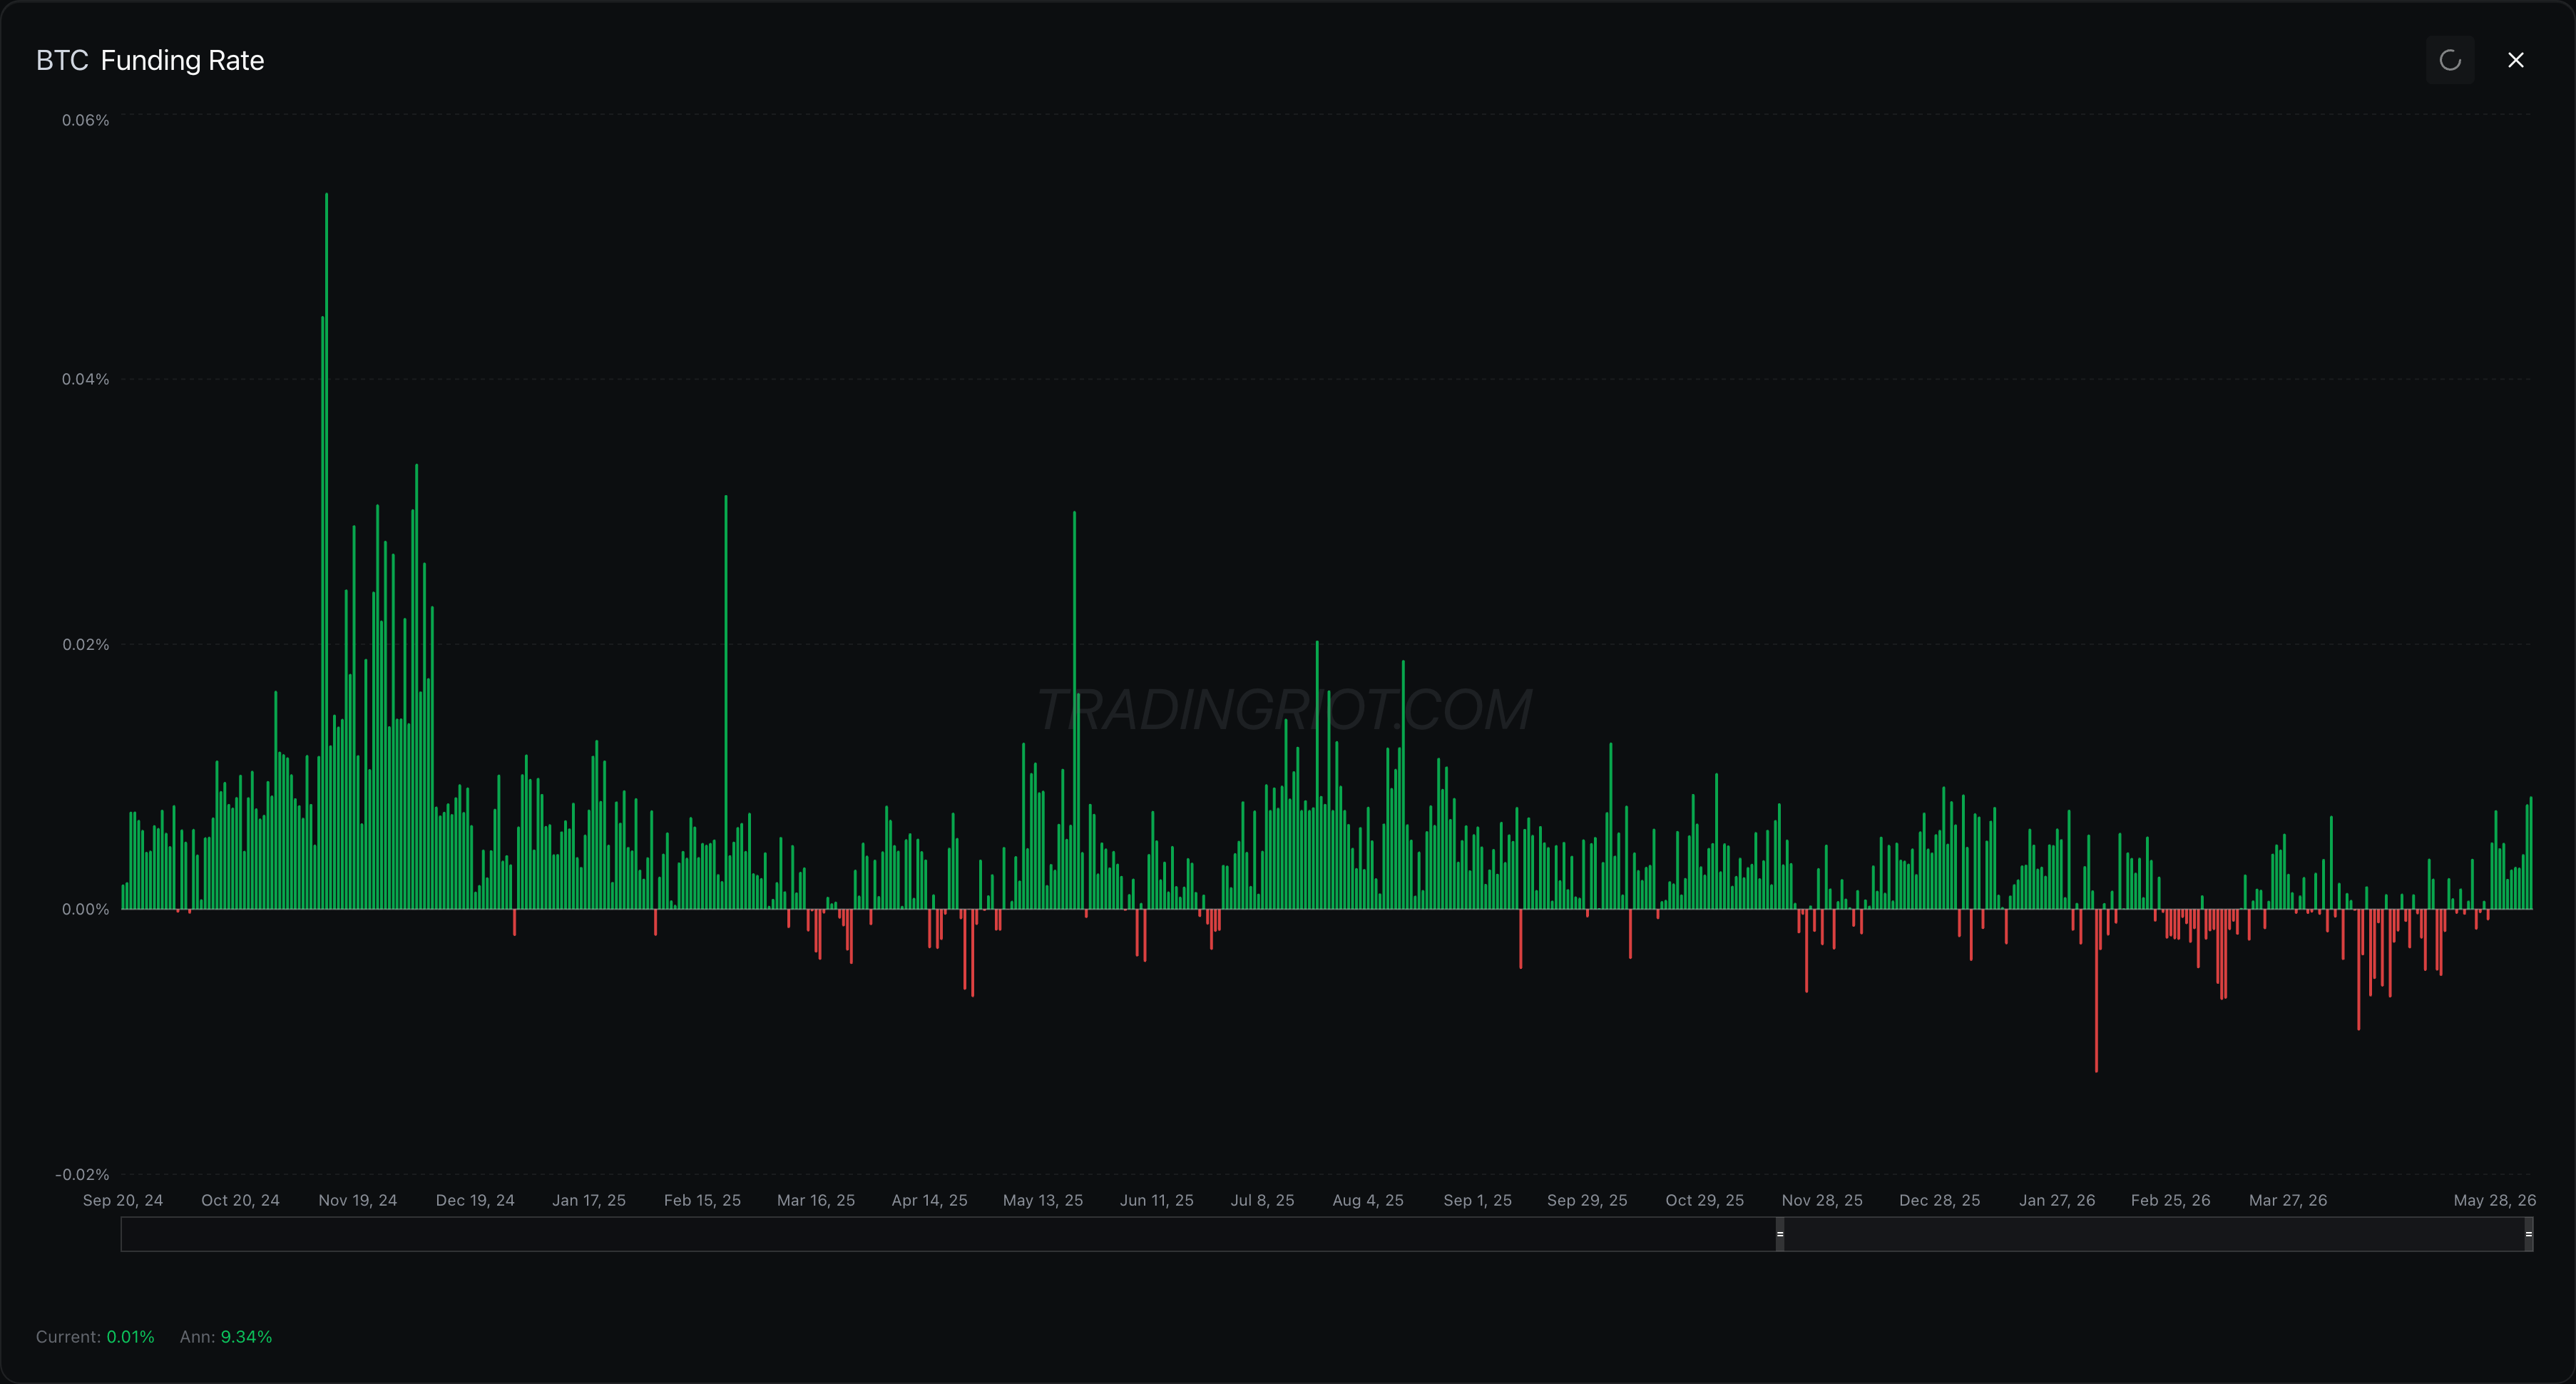
The interest rate is a flat rate the exchange sets, not something the market votes on. Binance fixes it at 0.01% per eight-hour interval (0.03% per day, roughly 10.95% annualized) for most USDT-quoted contracts, on the assumption that holding cash earns more interest than holding the coin. This is the source of funding’s structural positive bias. When the perpetual trades right at the index price, the premium washes out and funding settles at that 0.01%, which means longs pay shorts a small amount even in a perfectly balanced market. Some contracts, including ETHBTC and a number of altcoins, carry a 0% interest rate, so this tilt does not apply to them.
The premium index measures how far the contract is actually trading from spot. The intuition is simply the gap between the perpetual and the underlying:
Premium Index ≈ (Perpetual Price − Spot Price) / Spot PriceIn practice Binance computes it more carefully, using the impact bid and ask prices (the average fill price for a set notional walking the order book) against a spot index drawn from major exchanges, and sampling every five seconds for a time-weighted average across the interval:
Premium Index = [ max(0, Impact Bid − Index Price) − max(0, Index Price − Impact Ask) ] / Index PriceThe two pieces combine through a clamp, which keeps a single dislocation from blowing the rate out:
Funding Rate = Premium Index + clamp(Interest Rate − Premium Index, −0.05%, +0.05%)The clamp has a clean consequence. As long as the premium index sits between roughly −0.04% and +0.06%, the whole adjustment term collapses and the funding rate just equals the 0.01% interest rate. Only once the premium pushes outside that band does funding start tracking the premium itself. On top of this, exchanges cap the final rate (Binance bounds most majors at ±0.75% of the maintenance margin ratio) and will switch a contract to hourly settlement when it pins the cap.
Your payment applies the rate to the notional value of your position, not your margin:
Funding Payment = (Mark Price × Position Size) × Funding RateA worked example. Long 10 BTC with funding at 0.01%, you pay 0.001 BTC to the shorts. Flip the sign and you receive the same from them.
The takeaway is structural, and it mirrors the classical future. A dated contract prices the cost of carry into its term structure, the curve across expirations. A perpetual has no curve, so it charges that same carry as a recurring payment instead. The cost of carry does not vanish when you delete expiry. It just gets paid in installments. And exactly as the slope of the futures term structure carries information about positioning and sentiment, the funding rate is a sentiment gauge in its own right, which is something we will lean on heavily later.
Linear and Inverse Contracts
Perpetuals come in two main flavors, and the only real difference is what currency settles the trade.
Linear contracts settle in a stablecoin, usually USDT/USDC. Quote and settlement are the same currency, so the payoff is boring in the best way: one dollar of price movement is one dollar of P&L. This is what you will trade ninety-something percent of the time.
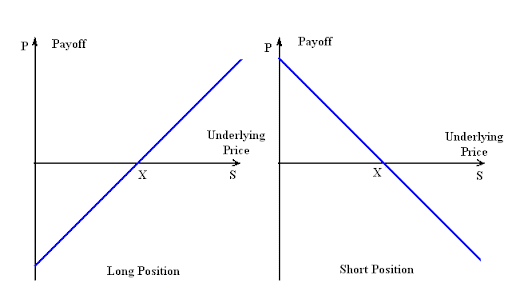
Inverse contracts settle in the coin itself while quoting in dollars. Your collateral is BTC, the chart is in USD, and because the thing backing your position is also moving against the dollar, the payoff bends. Gains and losses do not scale evenly with price, and an equal-size long and short do not carry the same coin-denominated risk. These came first, back in the BitMEX days, and now survive mostly among people who want their entire stack denominated in one coin.
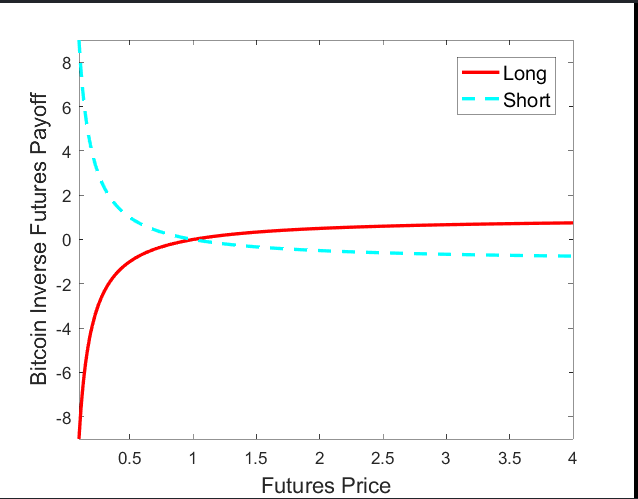
There is a third type, the quanto, which settles in a currency unrelated to either leg and bends the payoff even harder. Almost nobody trades them, so we can keep pretending they do not exist.
Margin, Leverage, and the Mark Price
Leverage is where perpetuals split hardest from the futures they were copied from, so it is worth being precise about what the word even means on each venue.
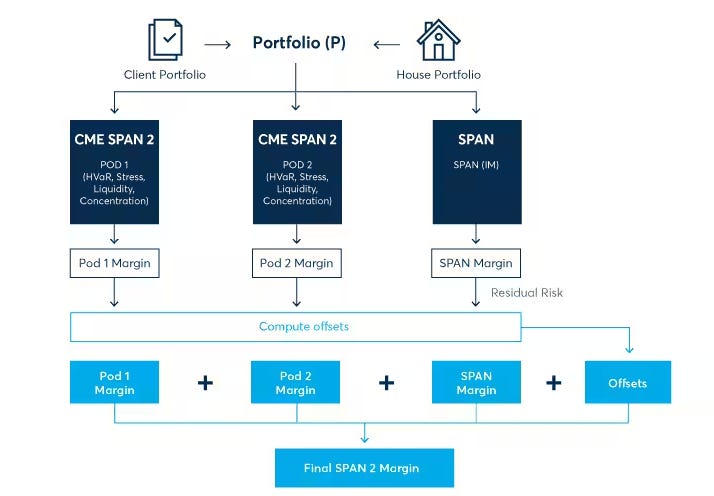
On a traditional exchange like CME, leverage is baked into the contract. One standard CME Bitcoin future is exactly 5 BTC, and the Micro contract is 0.1 BTC. You do not pick a leverage number anywhere. You buy a contract of fixed size, and the clearinghouse tells you how much margin you have to post against it, calculated through a risk model called SPAN and posted as a performance bond. With BTC near 100k, one standard contract carries 500k of notional, and the margin behind it is a schedule the exchange sets, not a slider you touch. Your effective leverage is just that notional divided by the margin demanded. Want less leverage, post more capital or trade fewer contracts. You cannot crank it past what the schedule allows.
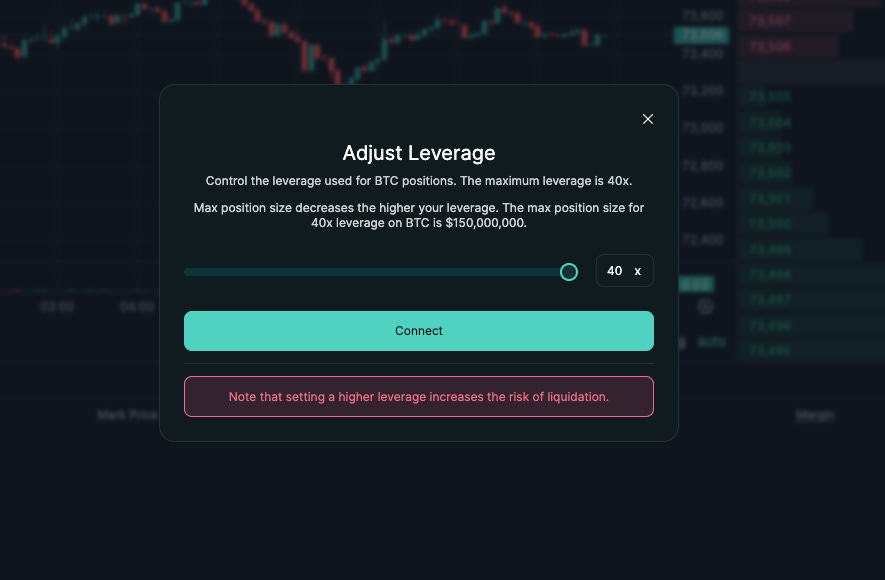
Crypto perpetuals invert this. The contract is tiny or fractional, and you set your own leverage directly, usually by dragging a slider. Hyperliquid lets you go up to 40x on BTC, and the big centralized exchanges advertise higher still. Picking 40x is really just picking your initial margin: at 40x, Hyperliquid wants 2.5% of the notional up front. The leverage figure and the margin requirement are the same dial seen from two sides.
Initial and Maintenance Margin
Initial margin is what you post to open it. Maintenance margin is the floor you have to stay above to keep it running. Hyperliquid sets maintenance at half the initial margin for a given tier, so a 40x position opened on 2.5% gets liquidated once equity falls to 1.25% of notional. The distance between your entry and that maintenance line is your room to be wrong, and more leverage squeezes it toward zero. At 40x, a move of a couple percent ends you.
Both worlds also scale margin with size, for the same reason from opposite directions. CME runs it through SPAN. Crypto exchanges use leverage tiers: the larger your position, the lower the max leverage they permit and the higher the maintenance margin they charge. Hyperliquid drops positions above roughly 20m of notional down to 3x to 5x.
Isolated vs Cross Margin
Crypto exchanges also let you decide how your collateral is walled off, a choice CME does not really hand the retail trader.
Isolated margin fences off a set amount of collateral for one position. If that position is liquidated, that fenced amount is all you lose and the rest of the account is untouched. It is the sane default for a speculative bet you want to quarantine.
Cross margin does the opposite. Your whole account balance backs every open position, and unrealized profit on one trade holds up another. You only get liquidated when total account equity drops below the combined maintenance margin of everything you hold. Cross survives deeper drawdowns because it has more collateral to lean on, but when it finally breaks it can take the entire account down rather than one position. On Hyperliquid, a cross account is liquidated when account value including unrealized PnL falls under maintenance margin times total open notional, and if the book cannot close it and equity slips below two-thirds of maintenance, a backstop liquidator vault steps in.
The Mark Price
A perpetual is not liquidated off its own last traded price. It is liquidated off a mark price, engineered to be harder to push around than any single venue’s price.
On Binance the mark price is the median of three numbers: a spot price index, that index nudged by the current funding basis, and the contract’s own price. The index is itself a weighted average of spot prices across a long list of exchanges, Binance, Coinbase, Kraken, OKX and others, with a guard that caps any single source deviating more than a few percent from the median. What you get is a reference price tied to the broad spot market instead of one order book.
This is why a position can wick straight down to its apparent liquidation level on the contract chart and live. The chart is showing the last traded price. The liquidation engine is watching the mark price, and the mark did not travel as far. It is also why nobody can ram one thin venue to trigger liquidations the rest of the market does not agree with. Both your unrealized PnL and your liquidation level are measured against the mark, never the last print.
Insurance Funds and ADL
When the mark price hits the point where your equity equals maintenance margin, you get liquidated, closed out by a forced order. Plenty of venues do this in stages, trimming the position instead of dumping all of it, where size and liquidity allow.
What happens when a position cannot be closed for enough to cover its losses, and the account goes bankrupt? Classical futures lean on a clearinghouse that guarantees the trade and spreads default risk across members under a regulated waterfall. Perpetual exchanges built their own two answers.
First is the insurance fund, a pool fed by liquidations that close better than their bankruptcy price, there to absorb the ones that close worse. Second, and only when the insurance fund gets steamrolled, is auto-deleveraging, or ADL. Under ADL the exchange reaches over to the profitable traders on the other side and closes them out to cover the bankrupt ones, ranked by profit and leverage. Read that again, because it is the part nobody likes: you can be on the right side, deep in profit, and still get yanked out so the exchange stays solvent. A clearinghouse-backed future never digs into a winner’s account to pay a loser’s default. A perpetual, in a bad enough moment, will.
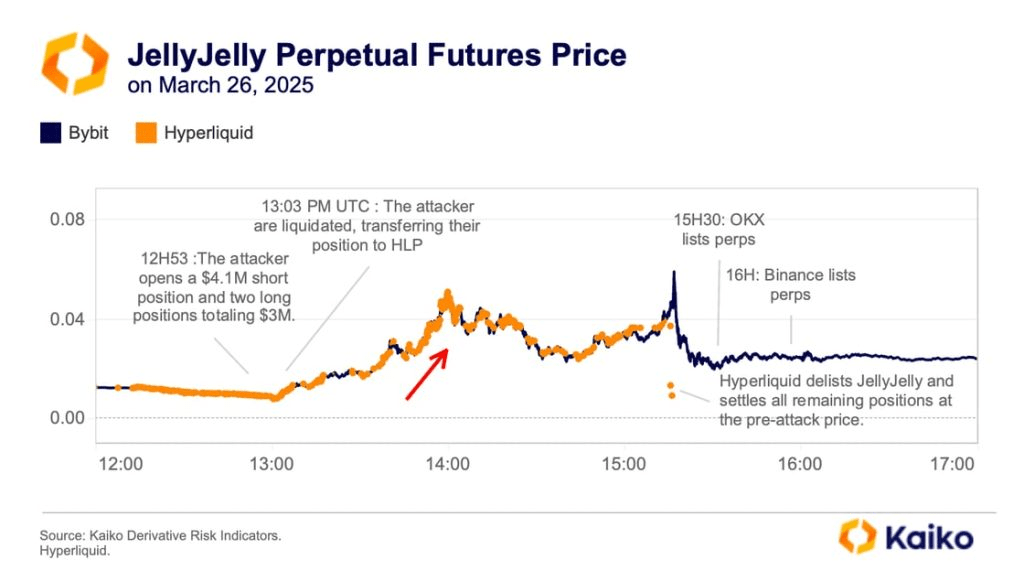
Decentralized venues handle the same problem with a twist, and Hyperliquid’s JELLY episode in March 2025 is the cautionary tale. Hyperliquid does not run a traditional insurance fund so much as a community market-making vault, the HLP, that backstops liquidations. A trader opened a roughly 4 million dollar short on JELLY, an illiquid memecoin, then bought JELLY spot aggressively to ram the price up against their own position. The short blew past its liquidation point, but it was too large to close into JELLY’s thin order book, so the vault inherited it. As spot ripped higher, helped along by major exchanges rushing to list JELLY perps, the HLP’s unrealized loss spiked past 13 million dollars. Hyperliquid’s validators voted to delist JELLY and force-settle the contract at 0.0095, far below the roughly 0.50 the oracle was showing, which wiped out the attacker’s gain and spared the vault. It worked, and it also drew immediate accusations that a supposedly decentralized exchange had simply changed the result when the result got expensive. The lesson is the same one ADL teaches. When a position is too big to liquidate into the available liquidity, somebody has to eat it, and the backstop you assumed was neutral can act in its own interest.
Liquidations are great (not so much if you are the one getting liquidated) as they provide a great piece of information about traders that are forced out of the market. That is exactly the moment a willing counterparty gets paid. Liquidations flush out the overleveraged and hand a premium to whoever is around to provide liquidity into the stress. The same cascades that wreck careless traders are a signal and an opportunity for patient ones, which is something we come back to when we start reading the data.
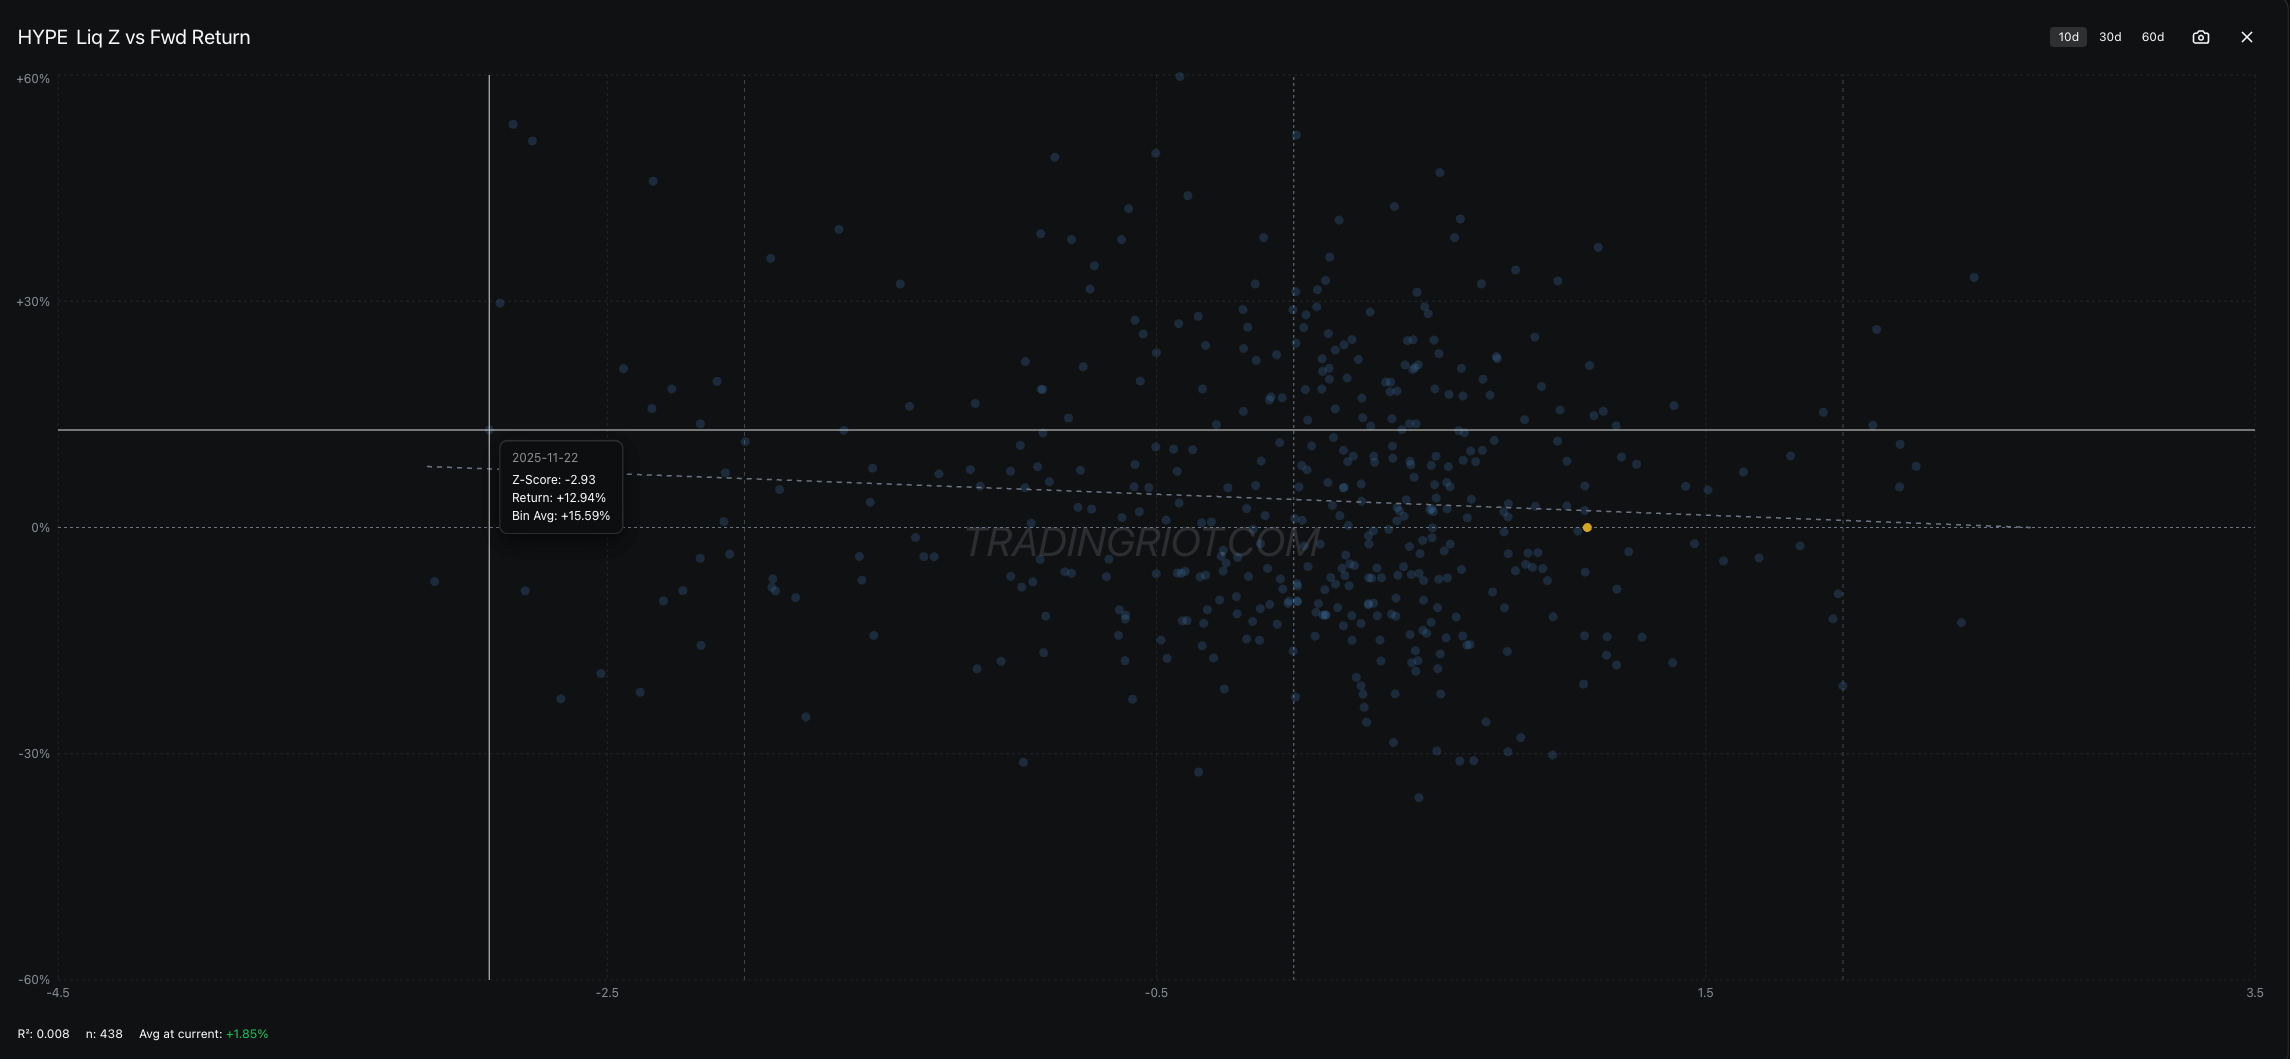
The chart above shows the 10-day forward return following liquidation events on HYPE. The trend line slopes down from left to right: when the z-score is deeply negative, which is when longs are the ones getting flushed out, forward returns have tended to come in above average.
In many other coins, statistically unusual long shakeouts have historically been a good place to lean long, not a guaranteed trade, but something worth paying attention to.
Liquidation Cascades
A single liquidation is a forced market order. Stack enough of them on top of each other and you get a cascade.
It runs like a chain reaction. Price drops far enough to liquidate the most reckless longs, the highest leverage first. Their positions close with forced market sells, which pushes price down further, which tips the next tier of slightly-less-reckless longs over their liquidation line. Those get force-sold too, price drops again, and the thing feeds on itself. Run it in reverse, a sharp move up force-buying shorts, and you get a short squeeze.
This is most of why crypto moves the way it does. Three things make it worse here than anywhere else. Leverage runs far higher than regulated markets allow, the market trades 24/7 with nobody to halt it, and on smaller coins the order books are thin, so each forced order shoves price more than it should. Traditional futures have circuit breakers and margin-call grace periods that slow all of this down. Crypto has none of that.
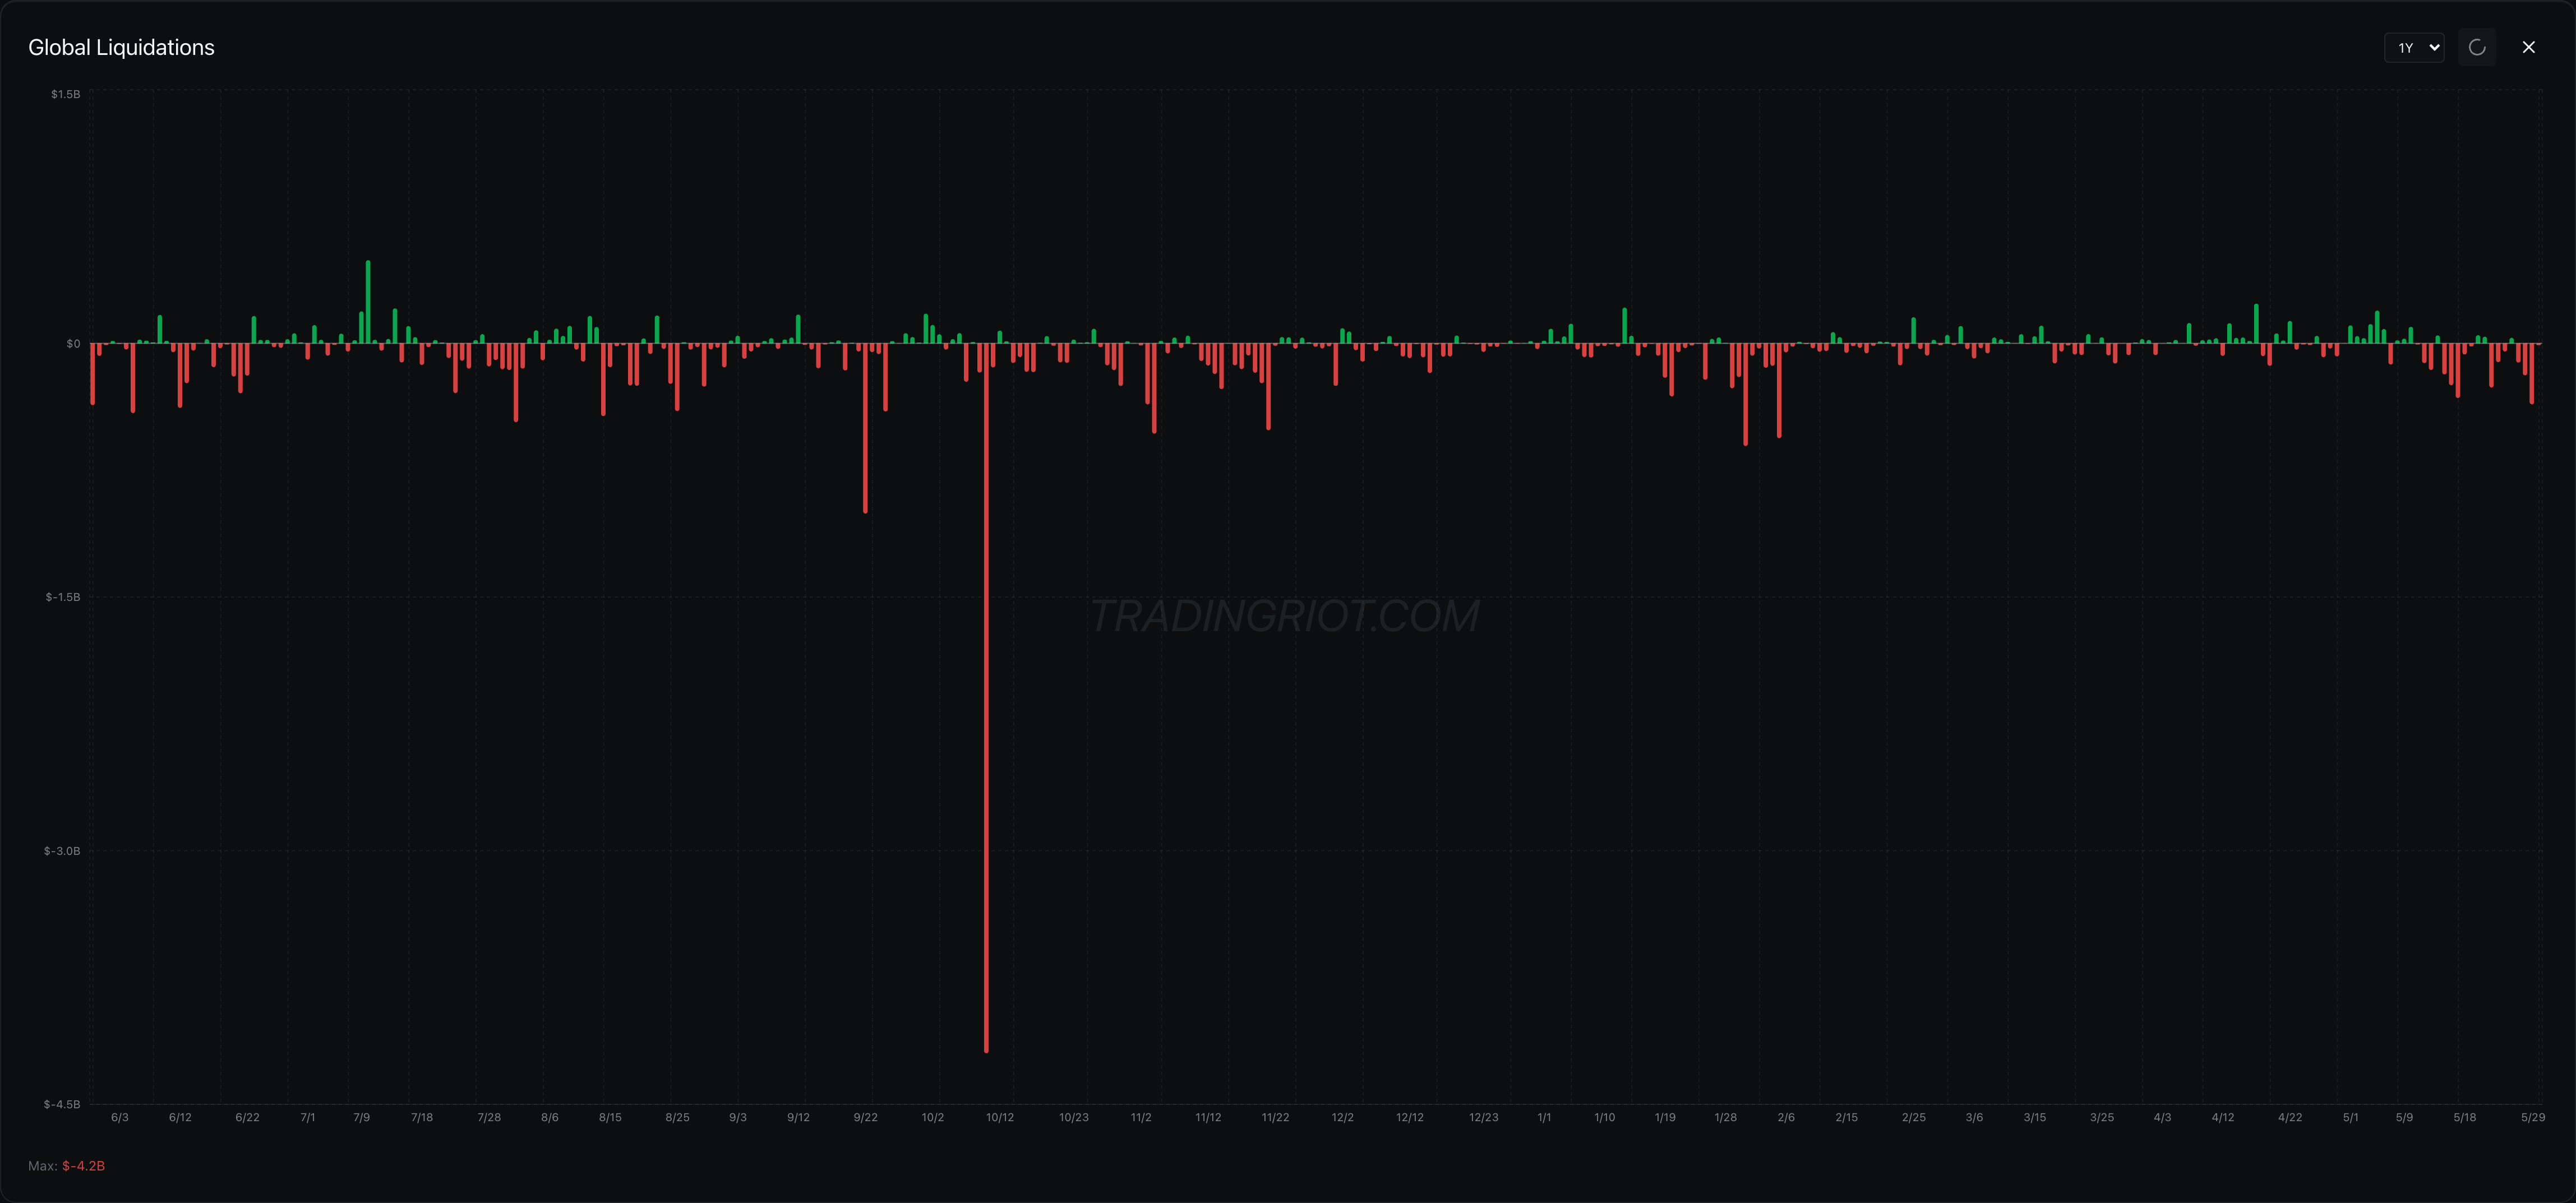
The cleanest recent example is October 10, 2025. A surprise threat of 100% US tariffs on Chinese goods hit the tape, risk assets dropped, and the leverage did the rest. More than 19 billion dollars of positions were liquidated in 24 hours, the largest single-day deleveraging in crypto’s history, hitting over 1.6 million trader accounts. Roughly 87% of what got wiped was longs. Bitcoin fell around 14% in a matter of hours and the total market shed something like 350 billion in value, but the real carnage was in the smaller alts, where thin books and stacked leverage sent some names wicking down 50% or more before snapping back. The cascade was the mechanism. The tariff headline was just the match.
That feedback loop is the single biggest risk sitting under any leveraged position in this market, and it is the reason the backstops we just covered exist at all.
Fees
A perp position bleeds two kinds of cost: funding, which we covered, and trading fees. The fees work differently from what you might know in traditional markets, so they are worth a quick pass.
Crypto exchanges run a maker-taker model. Post a resting limit order that adds liquidity to the book and you are a maker. Hit the market, or send a limit order that fills immediately against resting orders, and you are a taker who removes liquidity. Takers pay more, because they are the ones demanding immediacy. Base rates land around 0.02% for makers and 0.05% for takers, and they drop as your volume tier climbs, with a further discount on most venues if you pay fees in the exchange’s own token. At the top tiers some venues even pay makers a small rebate, which is how market makers earn a living posting two-sided quotes on razor-thin spreads.
A newer wrinkle is the zero-fee venue. Lighter, a decentralized perp exchange, pulled the same move Robinhood did in equities: drop the visible fee to pull in volume, then make the money elsewhere. Nothing is actually free. With no maker rebate to compensate you for providing liquidity, your resting limit orders get picked off by faster participants the instant the market moves against them. You wanted to buy at 100, price gaps to 99, your order fills, and it keeps going to 95. If you are taking liquidity in small size, zero fees probably help you. If you are posting limit orders trying to capture spread, you are likely giving up more in adverse fills than you ever saved in fees.
How much any of this matters comes down to how you trade. Scalp in and out all day and a few basis points of taker fee compound into a real drag, enough to turn a strategy that prints at maker rates into a loser at taker rates. Hold for days to weeks, like I do, and the fee is a rounding error next to the move you are after. On thin alts the bigger cost is not the fee at all, it is slippage, the gap between the price on screen and the price you actually get, and on a newly listed or low-cap market that book tends to vanish the moment volatility shows up. Size for it, and remember the friction cuts both ways. The same thin liquidity that punishes sloppy execution is exactly why those markets can pay better for anyone patient enough to work them properly.
Open Interest
Open interest is the total number of contracts currently open, the ones that have been entered and not yet closed. Think of it as how much money is committed to the market right now. Volume tells you how much changed hands; open interest tells you how much is still sitting on the table.
For every long there is always a short and vice versa. The two are equal by definition, because the contract only exists once someone takes each side. So “more buyers than sellers” is not a real thing in a derivatives market, no matter how many times you hear it on Crypto Twitter. What changes is not the balance between longs and shorts, it is who holds those positions and whether they are opening or closing.
That leaves three situations. Both sides open new positions and open interest rises. Both sides close and it falls. One side opens while the other closes and it stays flat.
So if every trade needs a buyer and a seller, why does price move at all? Market makers. They sit on both sides of the book quoting prices and pocketing the spread, and they do not want a directional bet, so when a directional trader shows up wanting to get long, the market maker takes the short against them and immediately hedges it, usually by buying spot or the same contract somewhere else. That hedging is what actually pushes price. When a lot of directional traders pile onto the same side at once, open interest climbs alongside price, and that is your tell that fresh money is committing rather than old positions just rotating between hands.
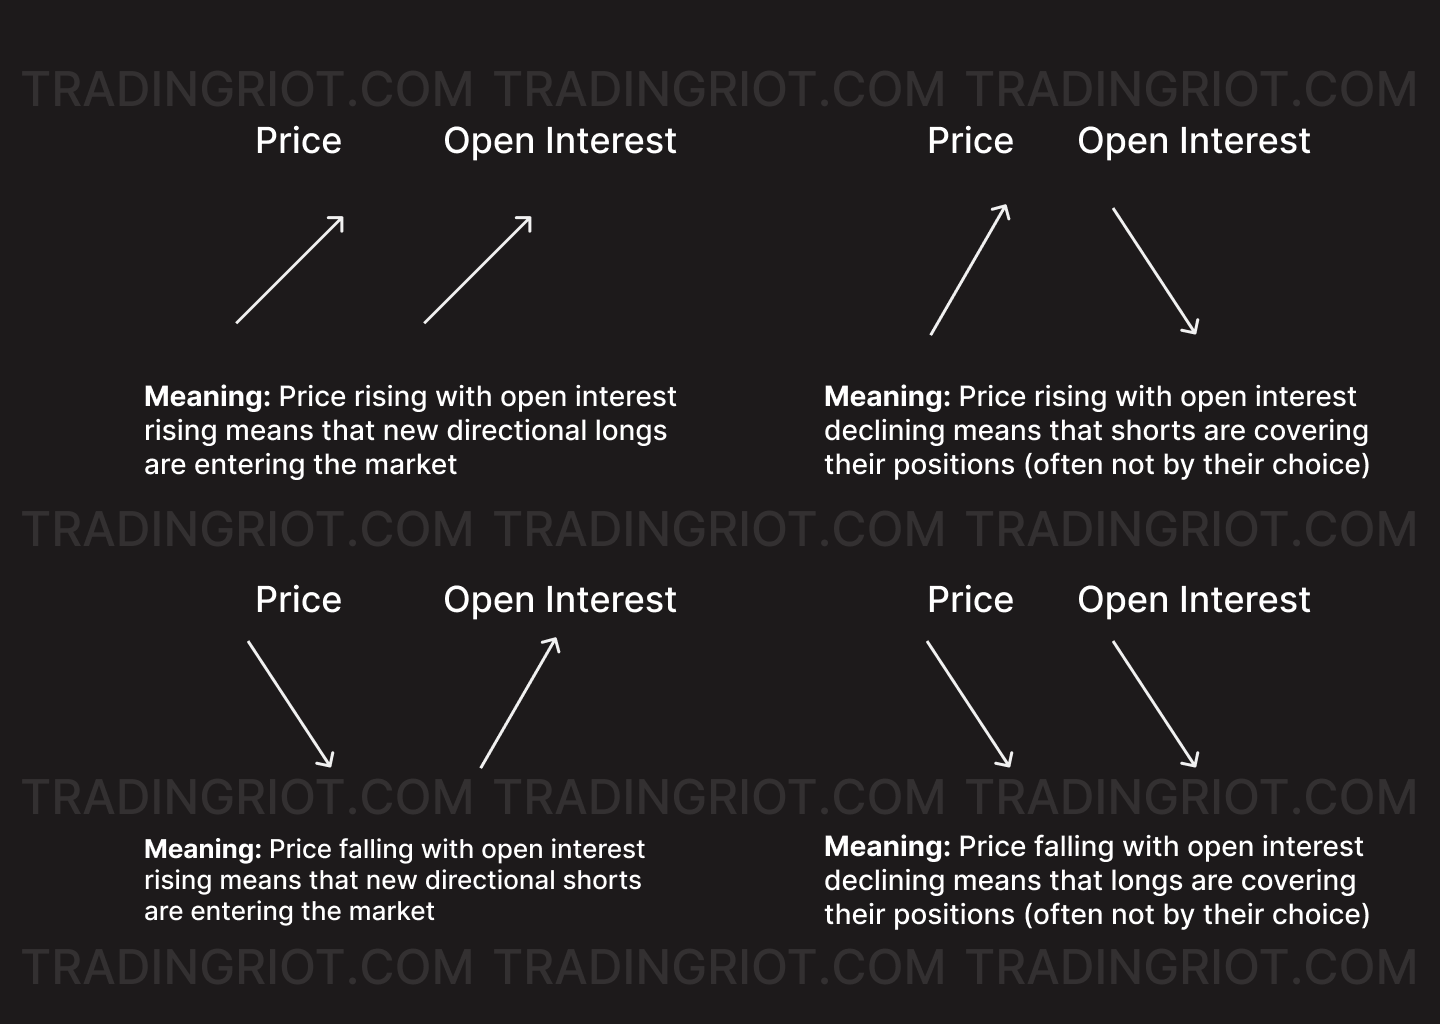
Run it the other way and the readings flip. Price moving while open interest falls means traders are closing out, not piling in. And a sharp, violent drop in open interest is almost always a liquidation wave of forced exits compressing a pile of positions in a hurry.
Where open interest builds up tends to matter too. Big clusters of committed positions act like gravity, levels the market wants to defend, or, when it cannot, levels where the forced exits happen. How to actually read all of this comes later. For now the point is simpler: open interest is the running record of conviction in the market.
And that it runs in real time is the whole gift. This is where crypto hands you something traditional markets do not. On CME, open interest lands once a day, after the session closes, and it arrives scattered across all the different expirations of the contract. In crypto, every decent data provider shows you open interest live, aggregated across exchanges, updating by the second, on a single continuous contract with no expirations to untangle. For a market this driven by leverage and forced flows, that visibility is a real edge, and it is most of why I would rather read positioning in crypto than anywhere else.
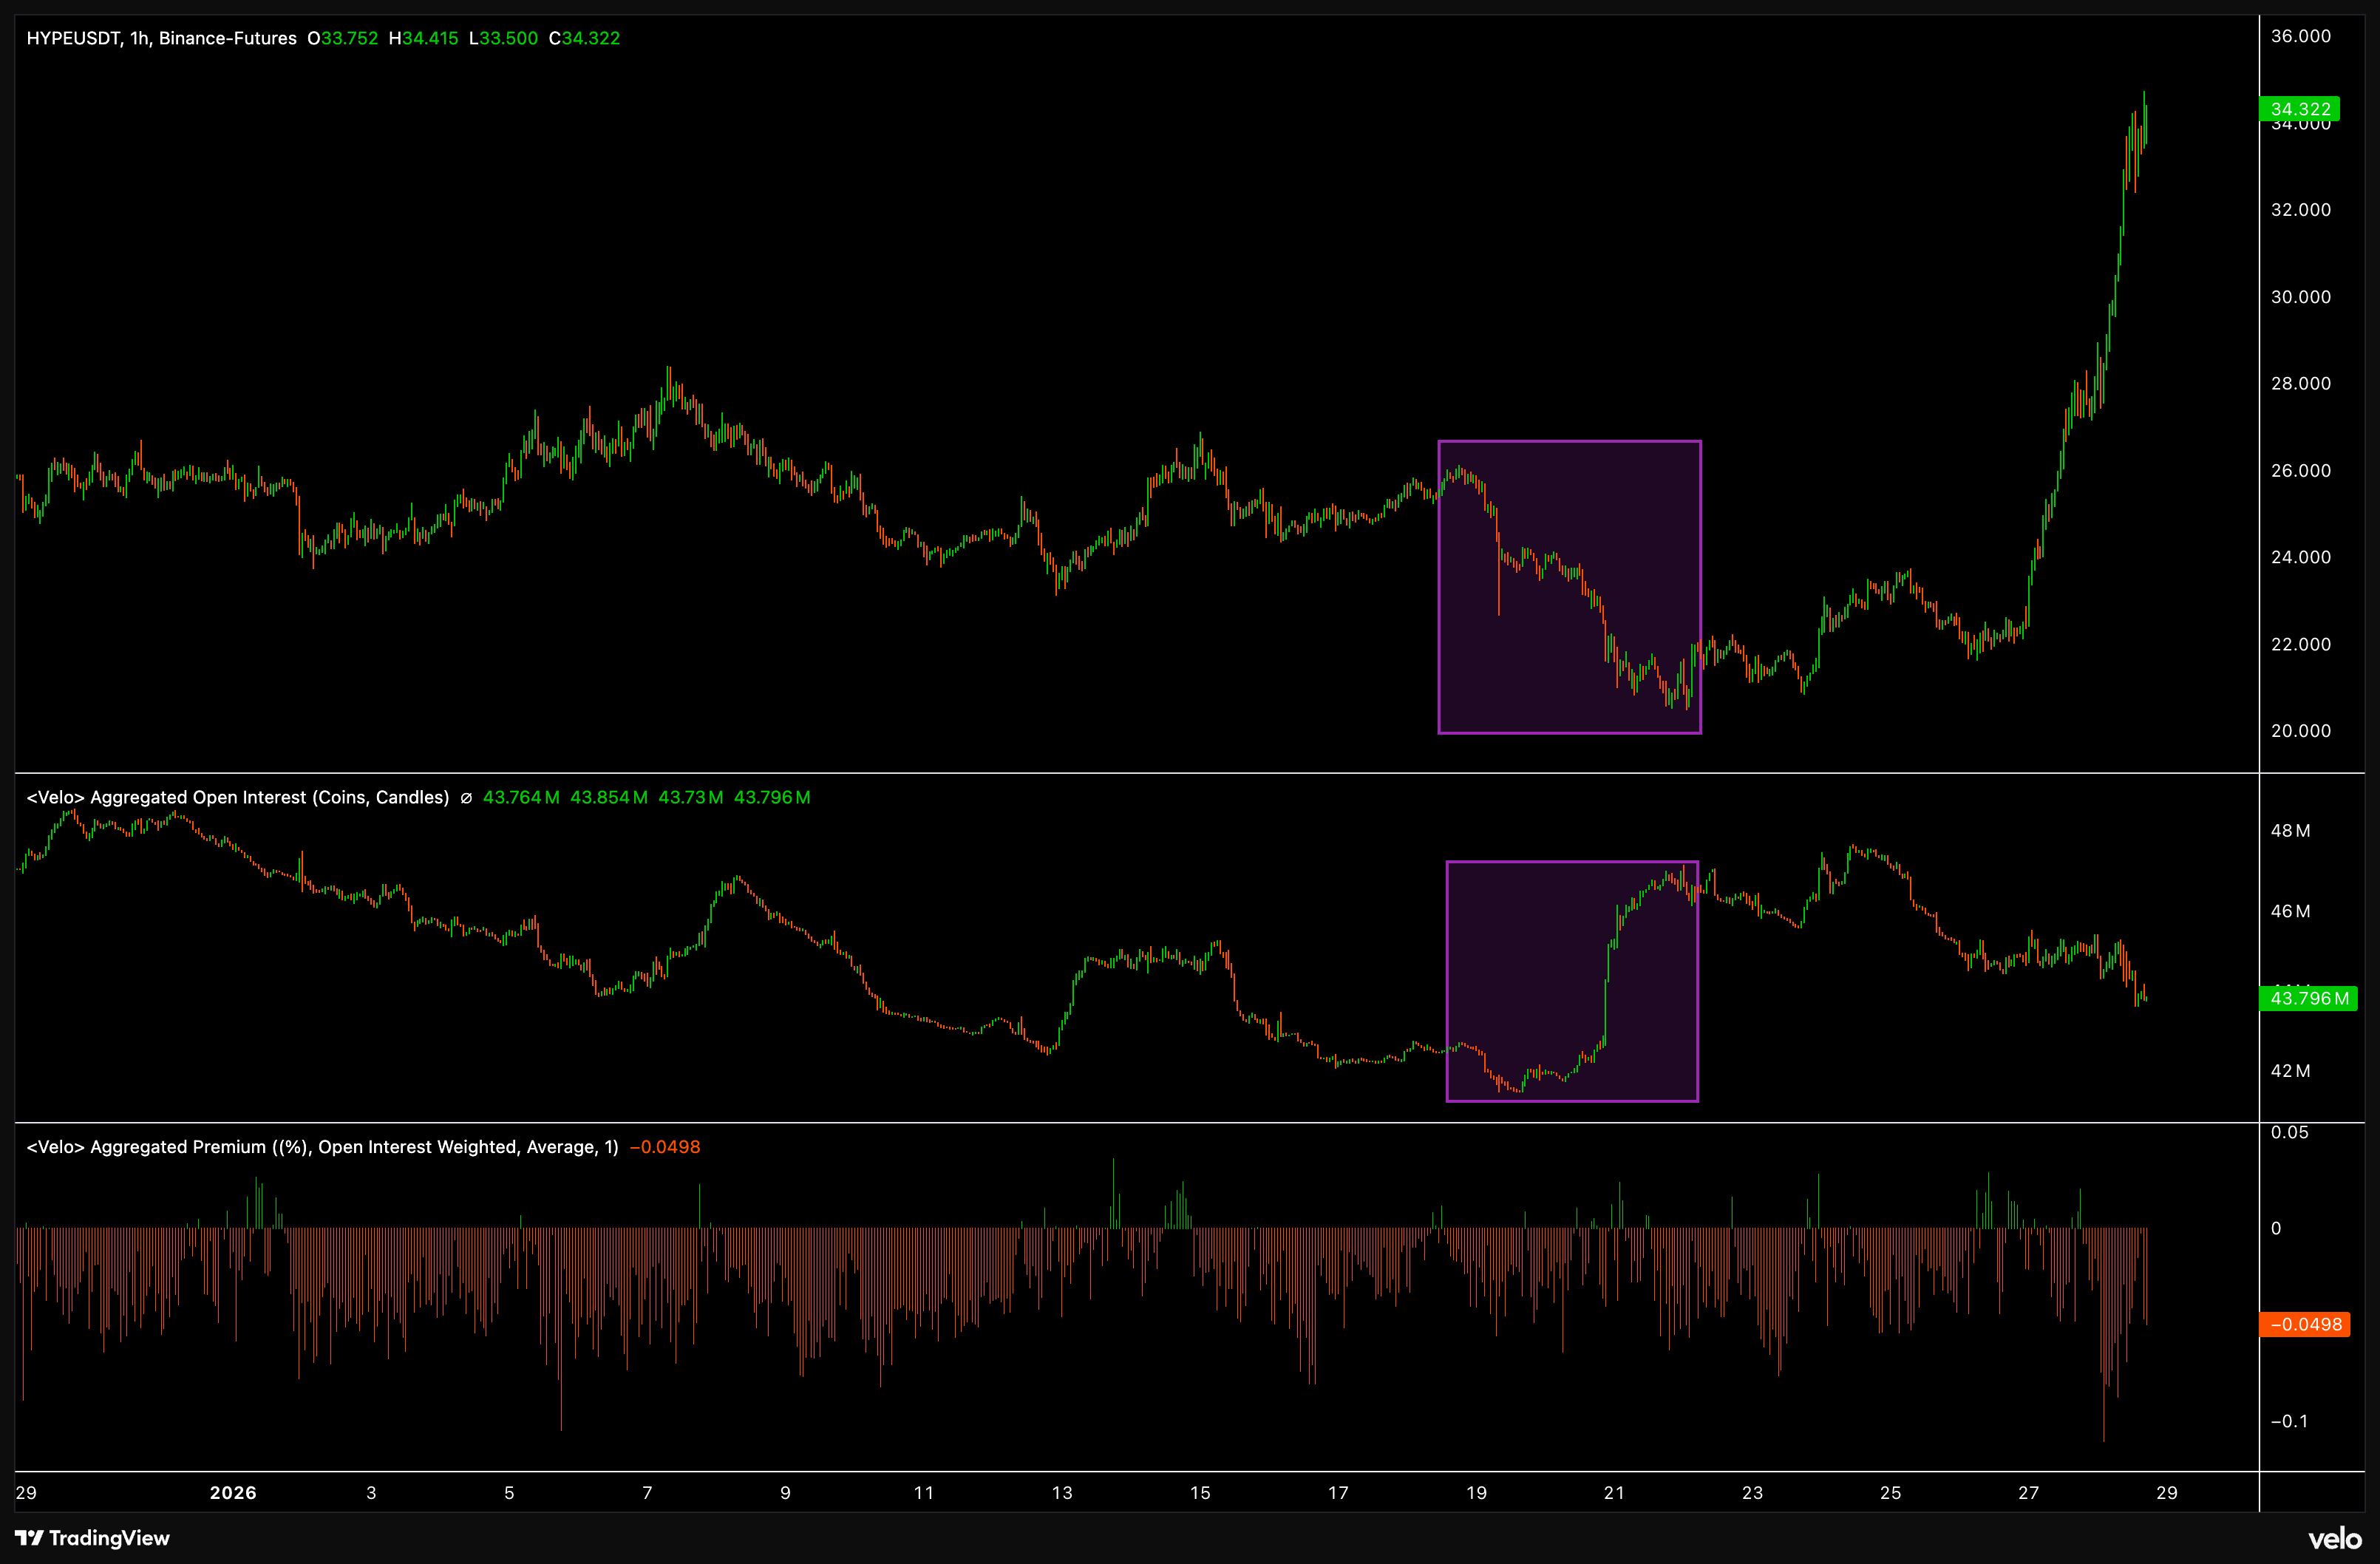
The chart above shows it on HYPE. Price ground lower while open interest kept climbing and the premium stayed negative, an aggressive short base building up, which then unwound in a textbook short squeeze.
On longer lookbacks open interest also works as a rough sentiment gauge, because most participants are structurally long and rarely short. That is why it tends to sit elevated at highs and depressed at lows. Turn it into a standard-deviation reading and those extremes become measurable, which is exactly what we do later in the article.
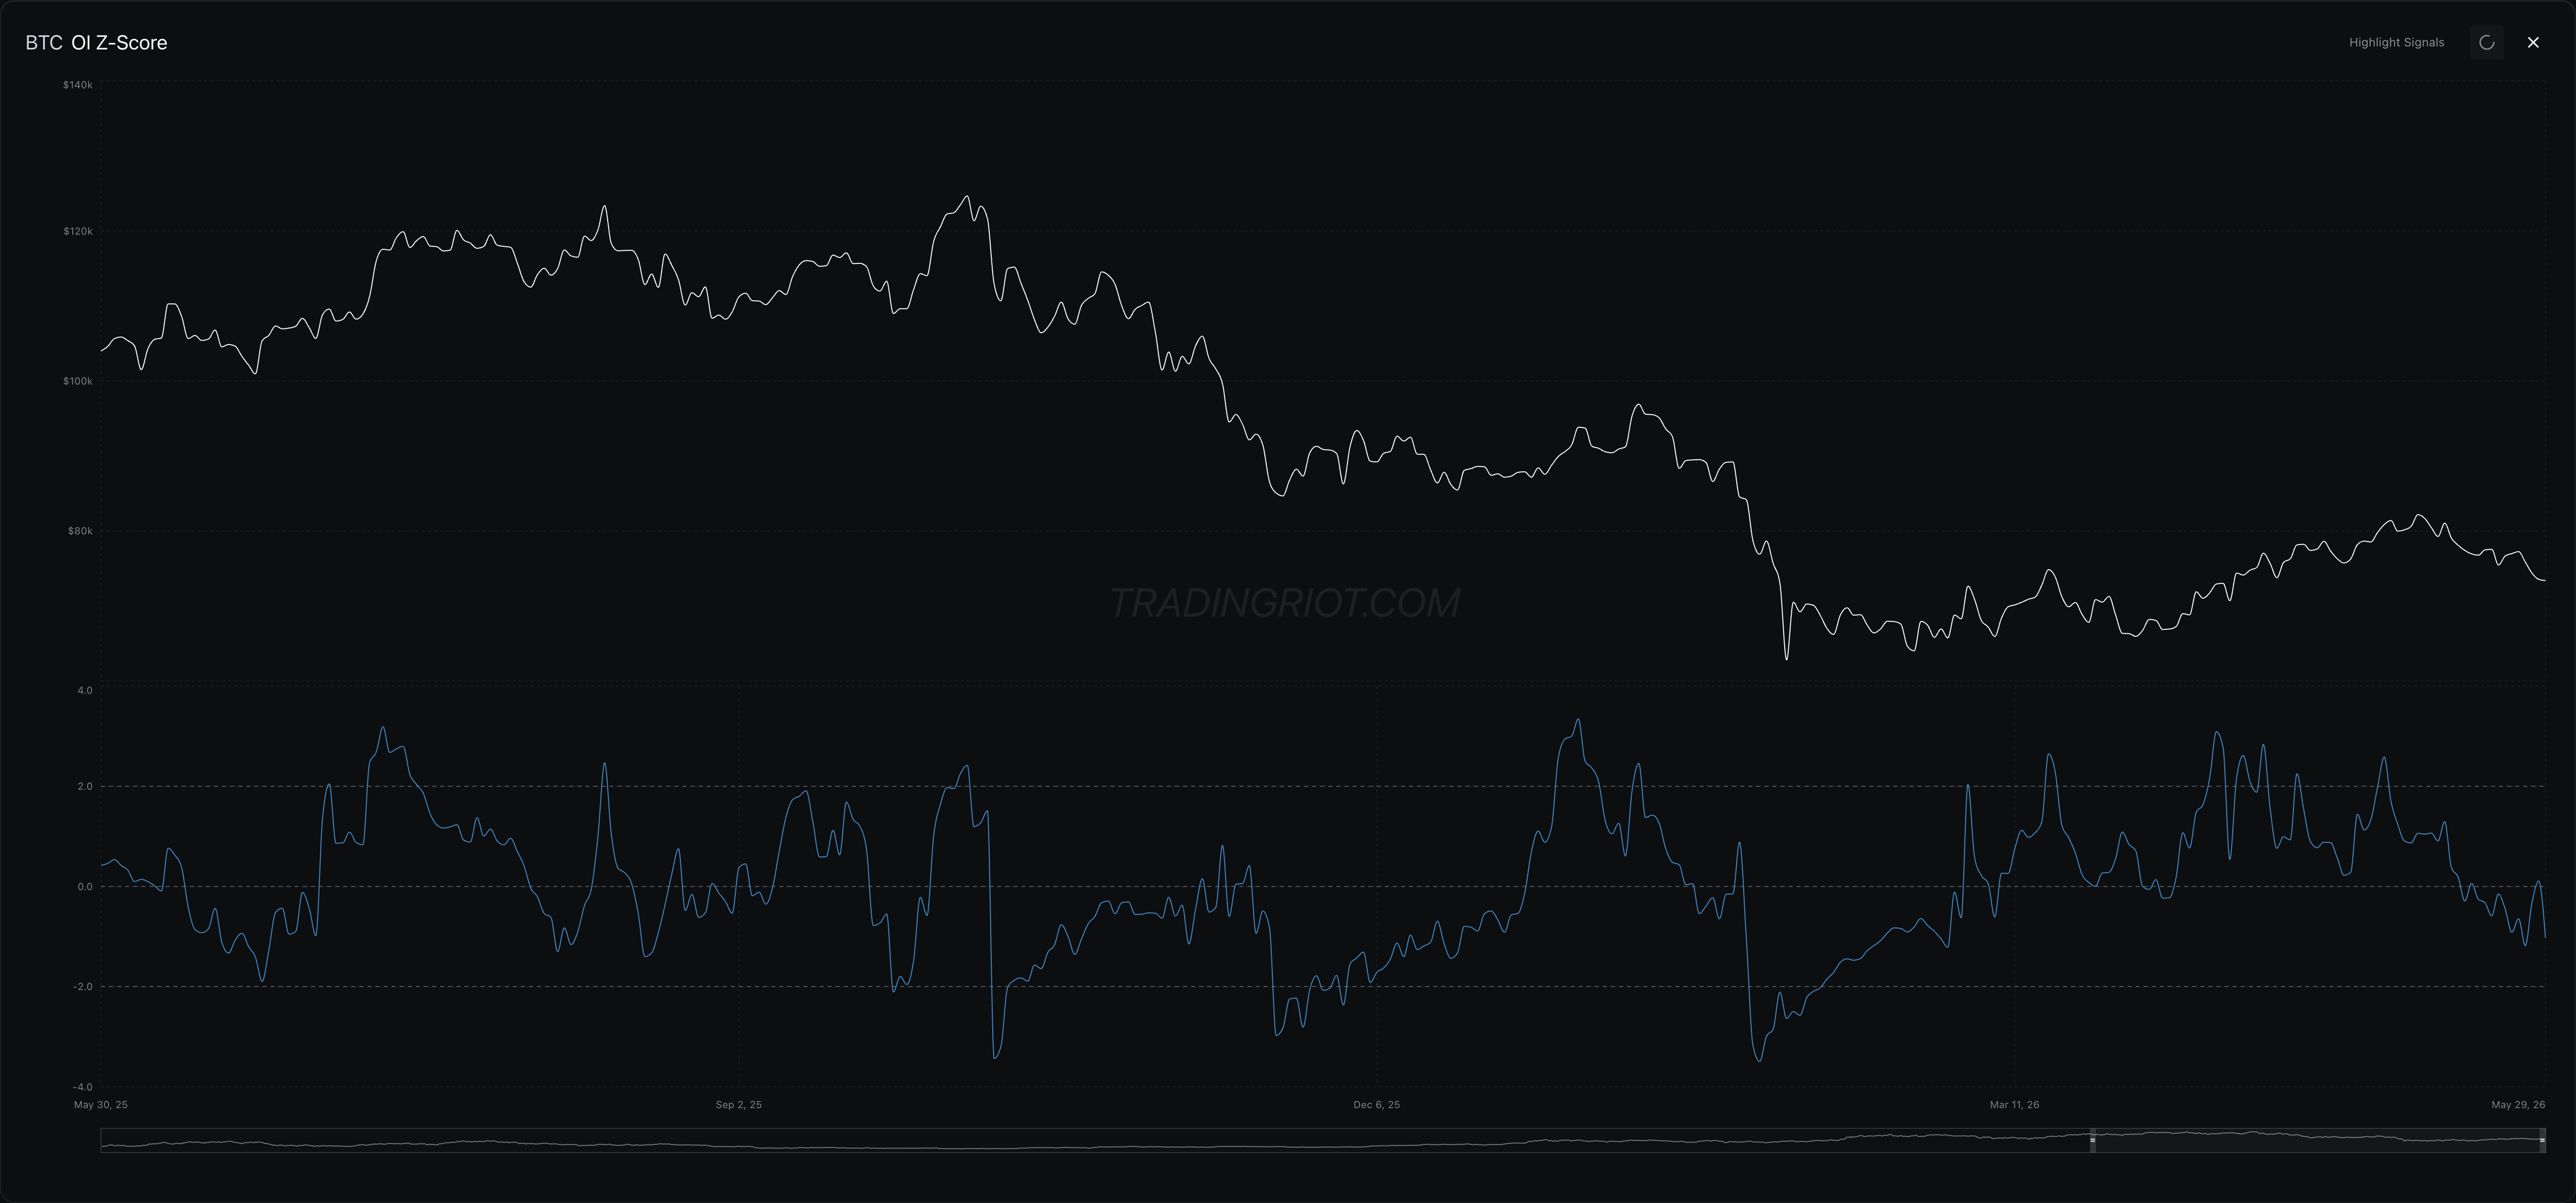
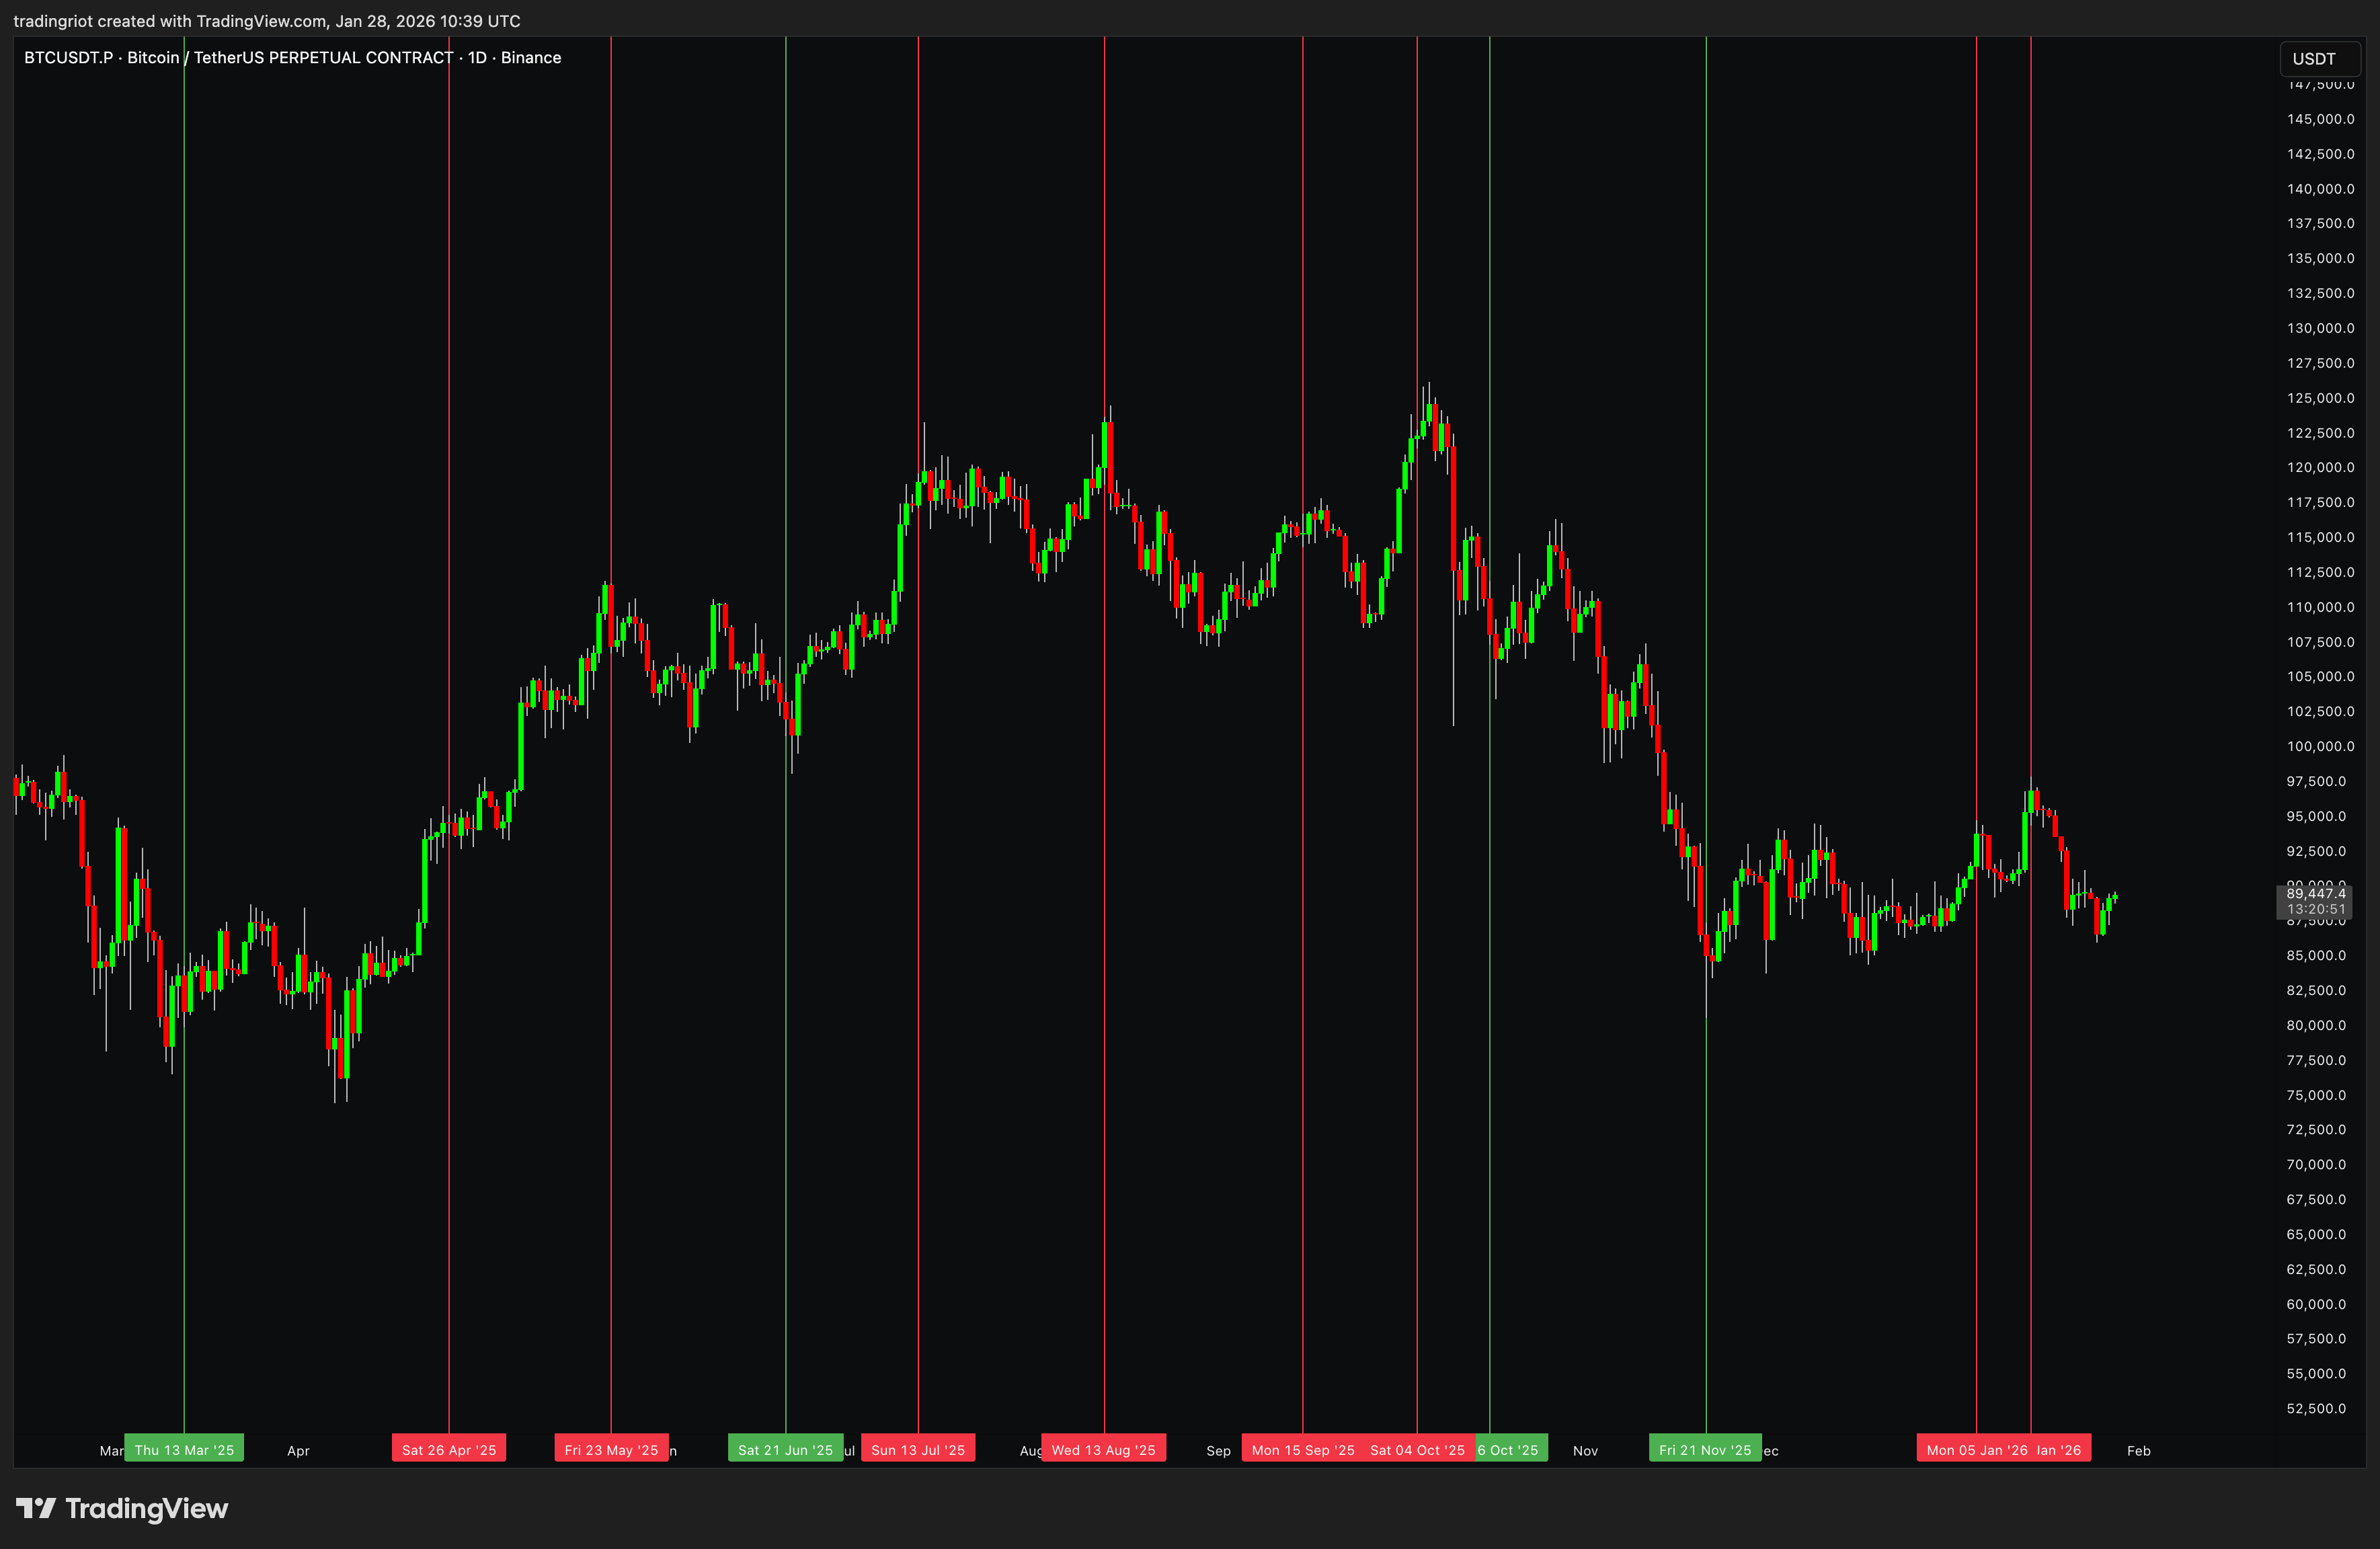
Here you can see a price overlap of every time open interest crossed above or below two standard deviations using a 30-day lookback.
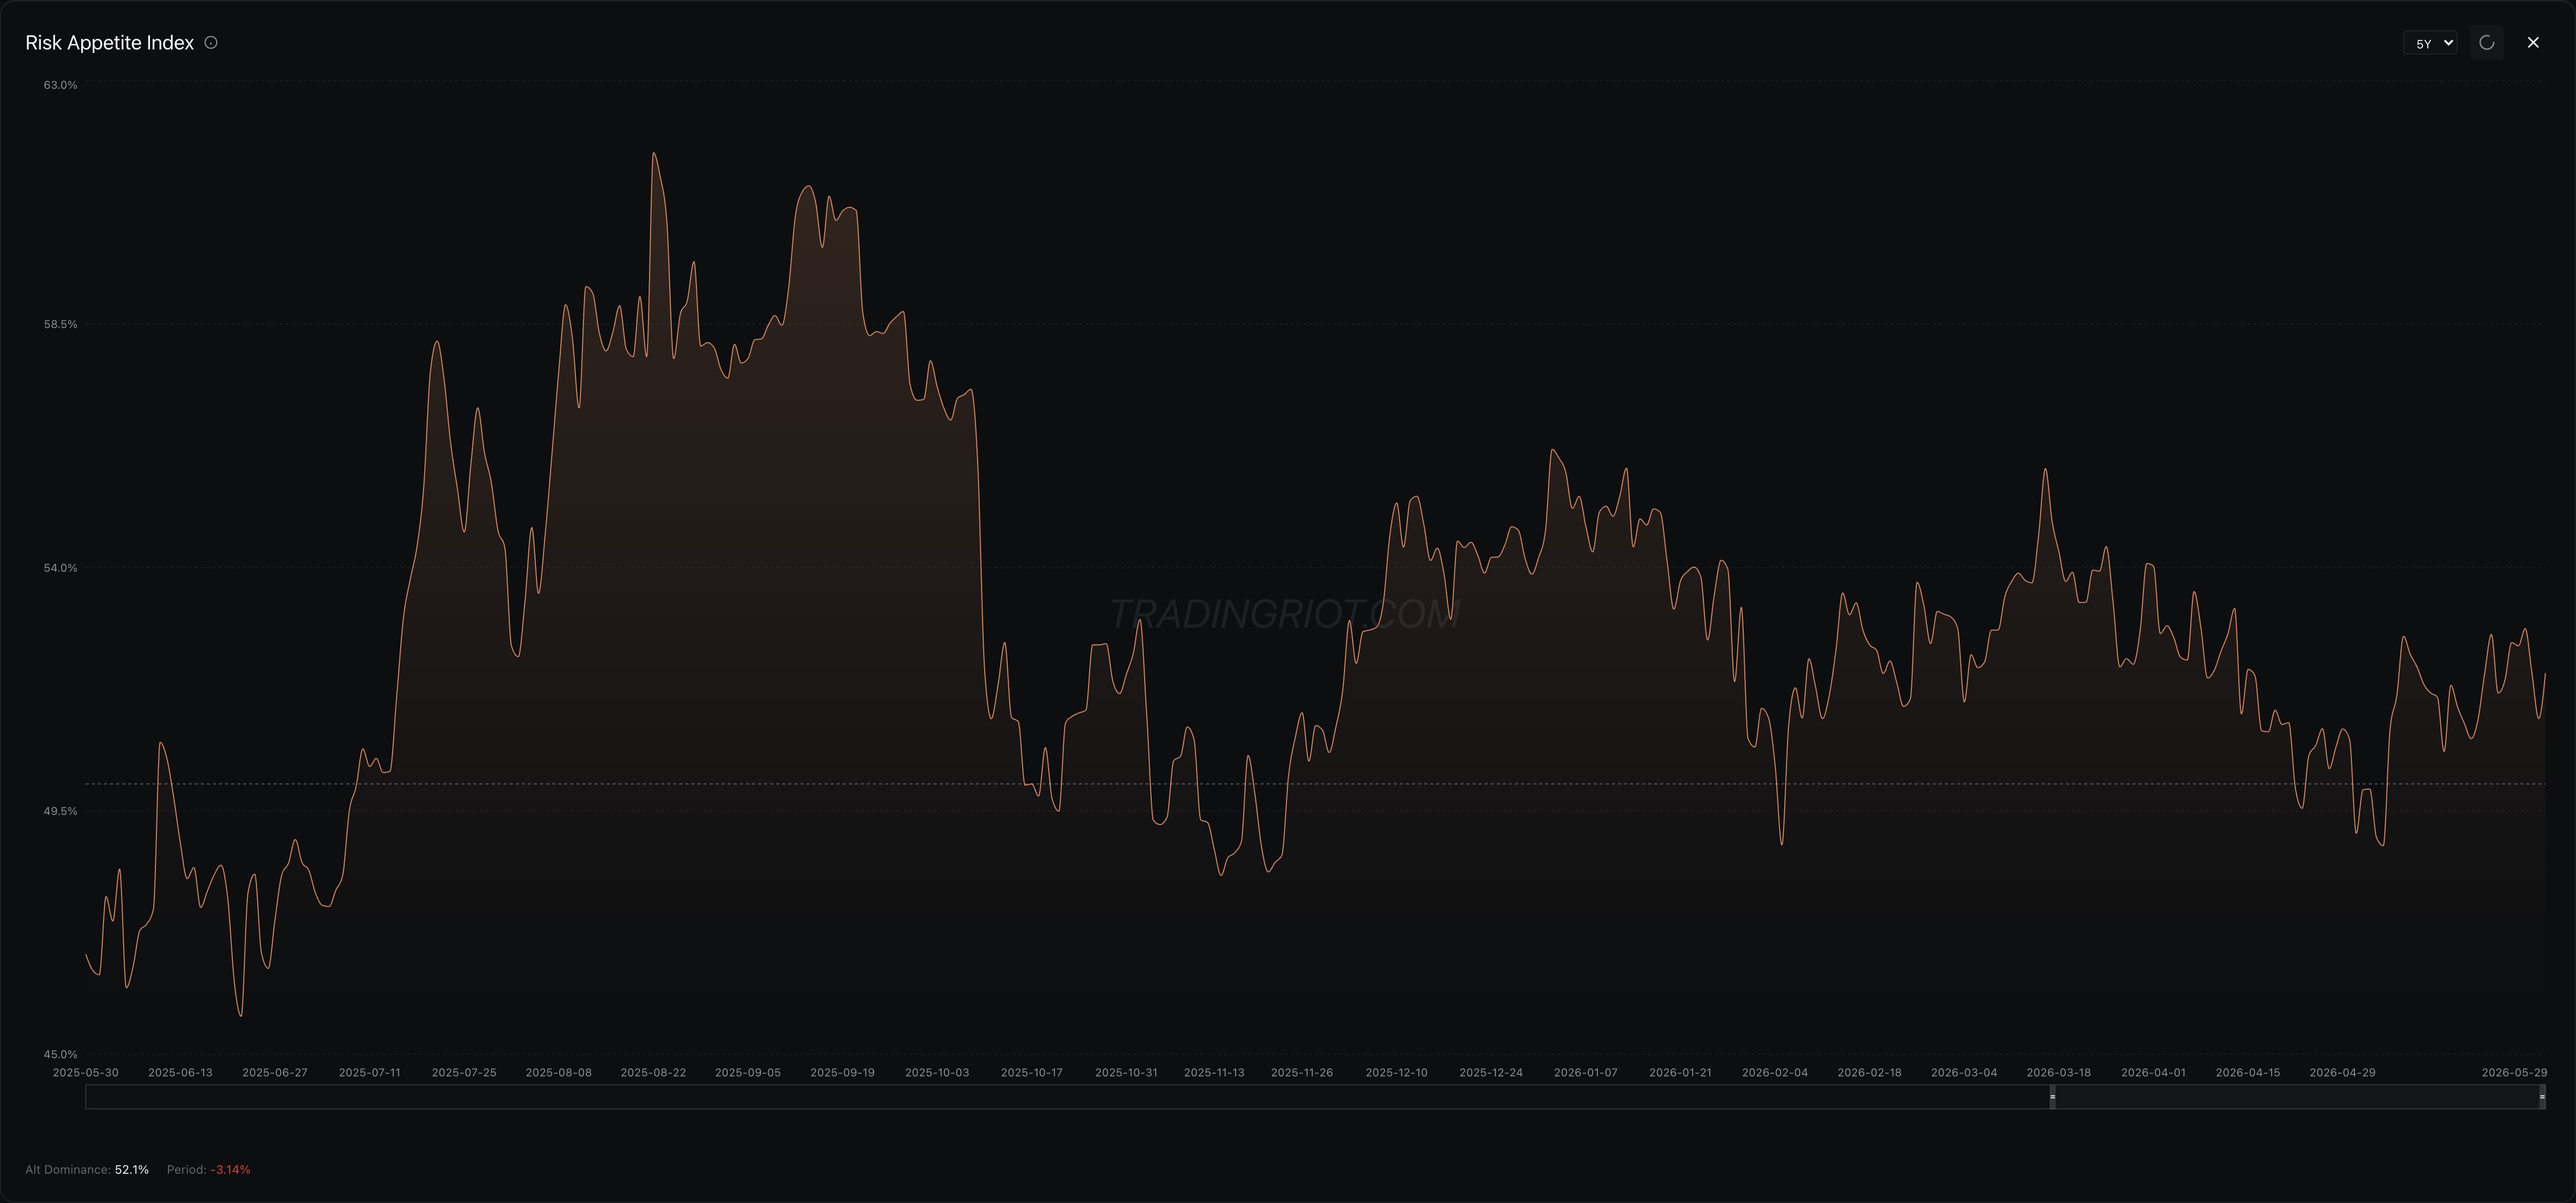
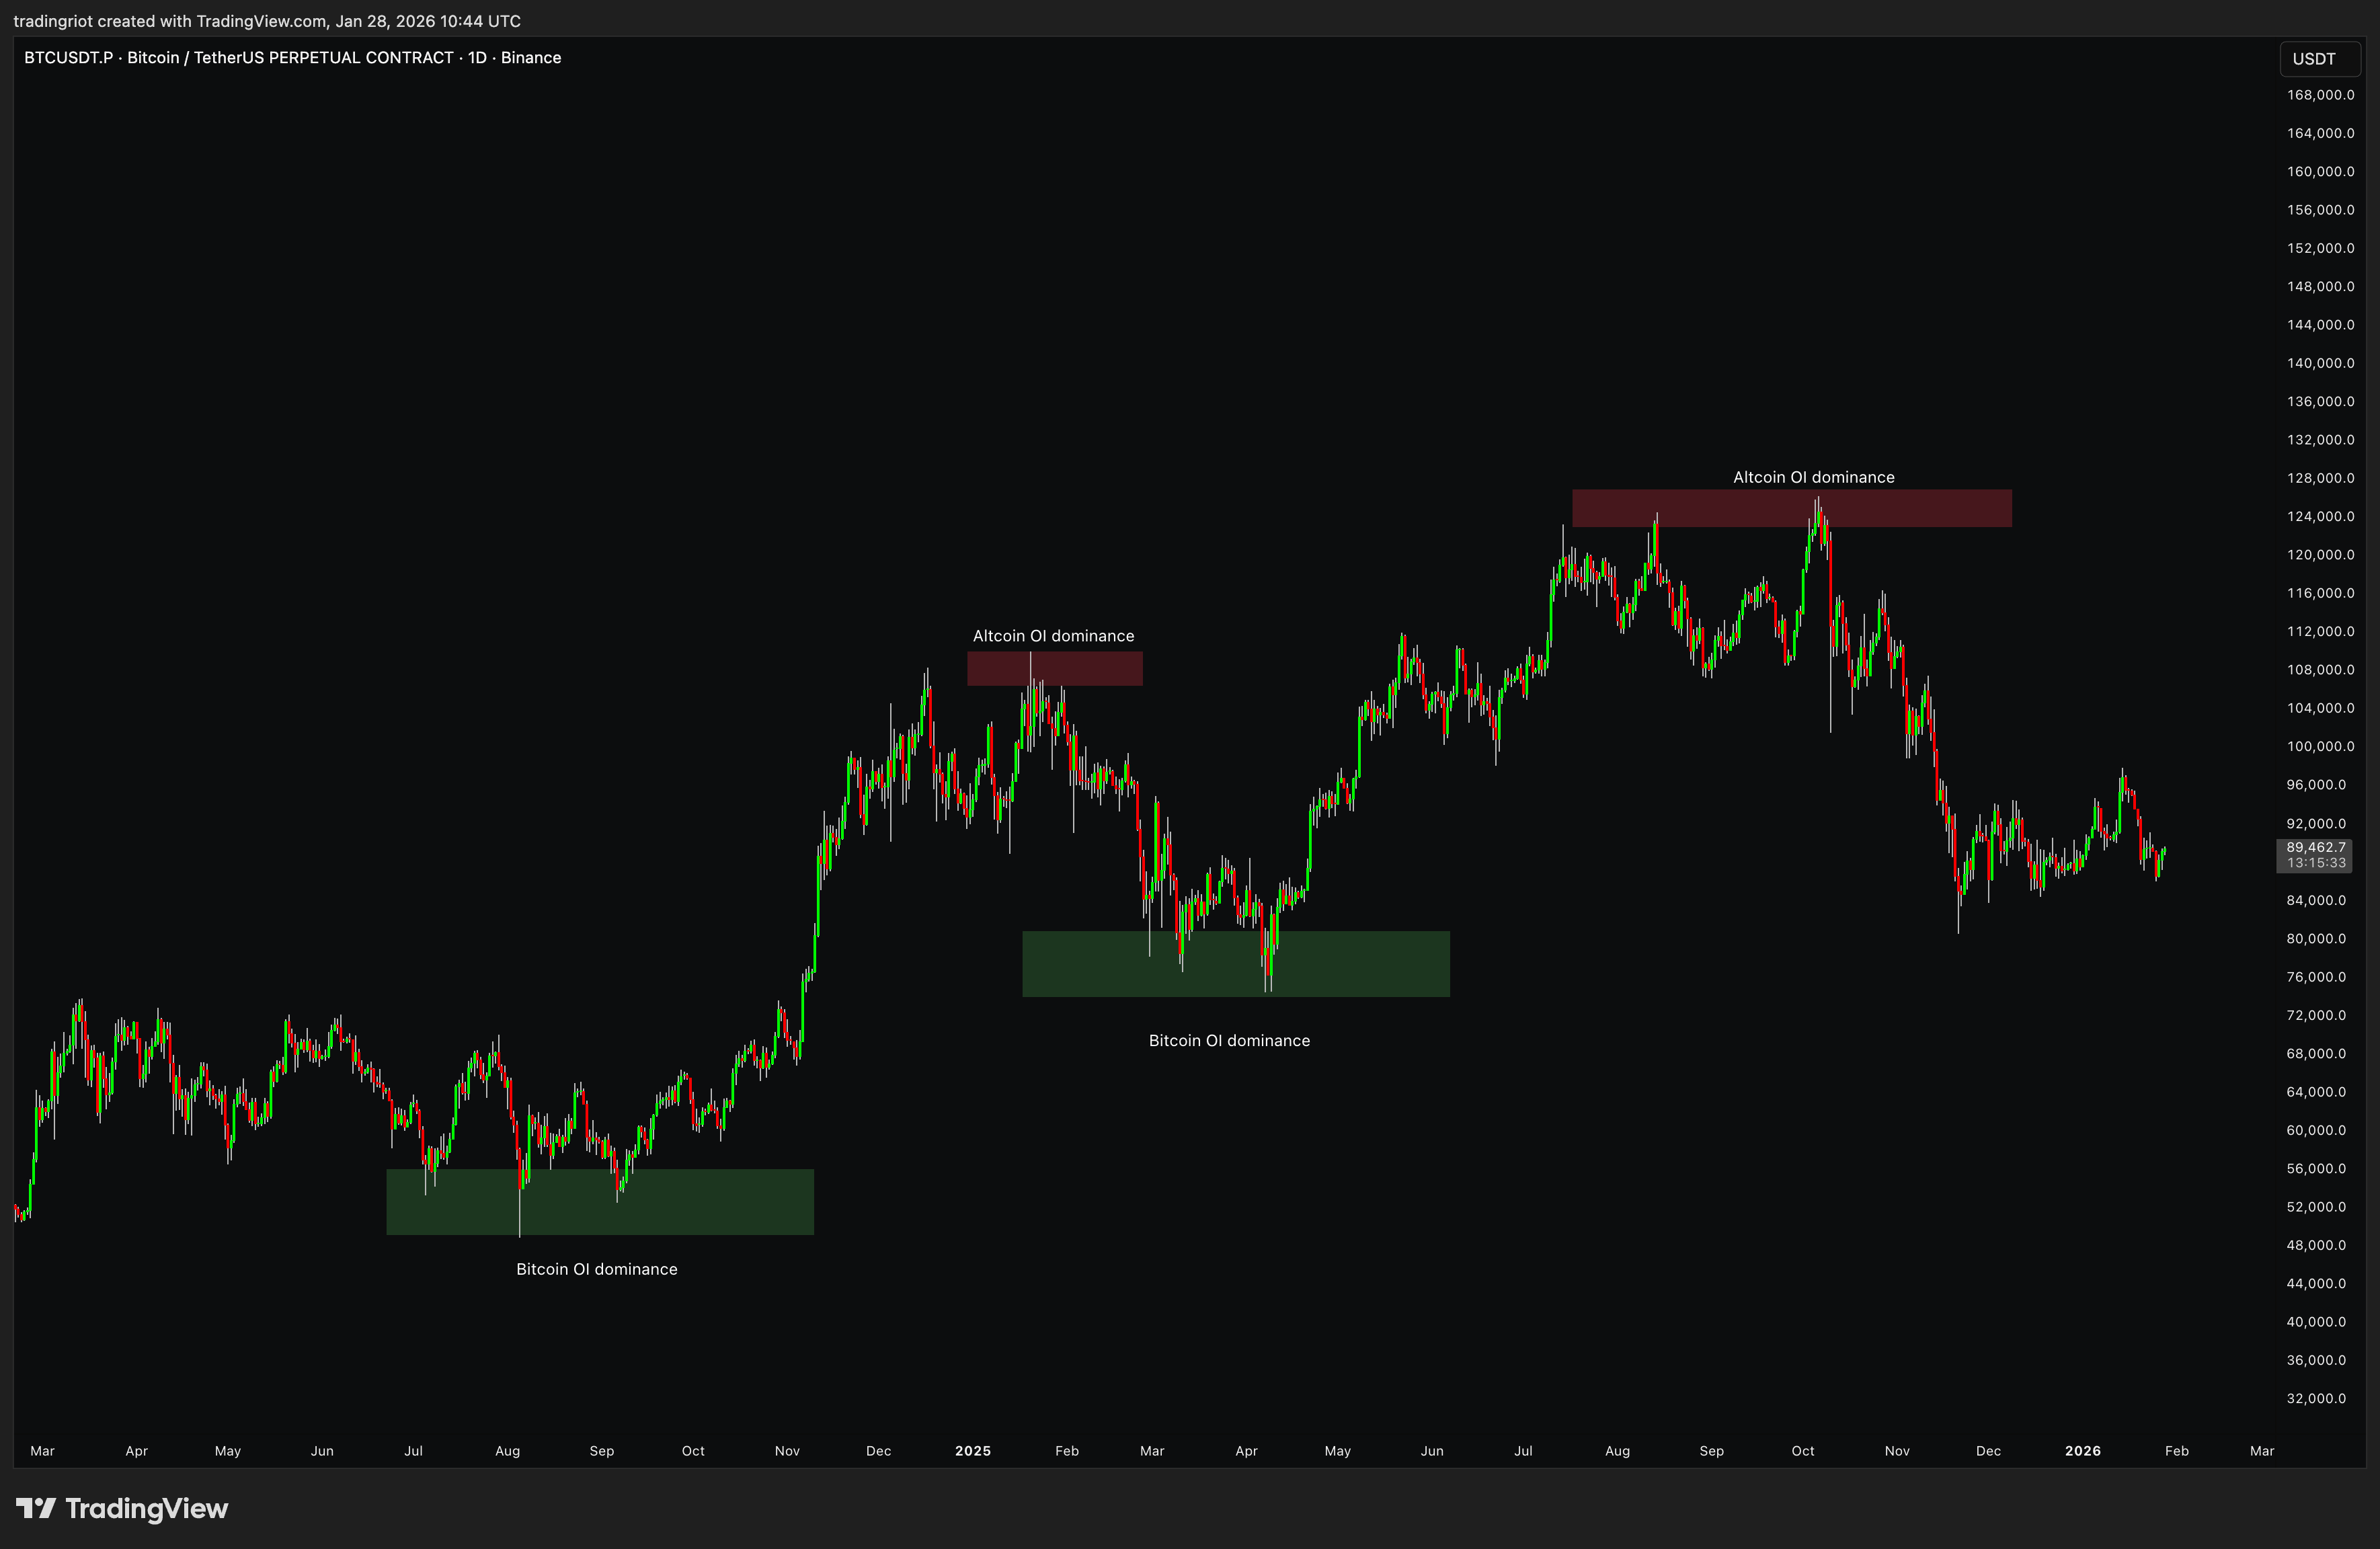
One last pattern worth filing away. Open interest rotates toward altcoins when the market is euphoric and concentrates back into Bitcoin when it is fearful. Plotted against Bitcoin's price, the recent highs line up with alt-dominated open interest and the recent lows with Bitcoin-dominated open interest.
How People Actually Trade Perps
You know what the instrument is. Now the question is what you do with it. Most of you are convinced you hold some hidden alpha, usually in the form of boxes drawn on a chart a five year old could manage, but in reality you will only ever take three kinds of trade: momentum, mean reversion, and delta neutral.
First thing about crypto: the market is brutally correlated. When Bitcoin moves, almost everything moves with it, and most altcoins are really just leveraged bets on the broader risk mood rather than independent stories.
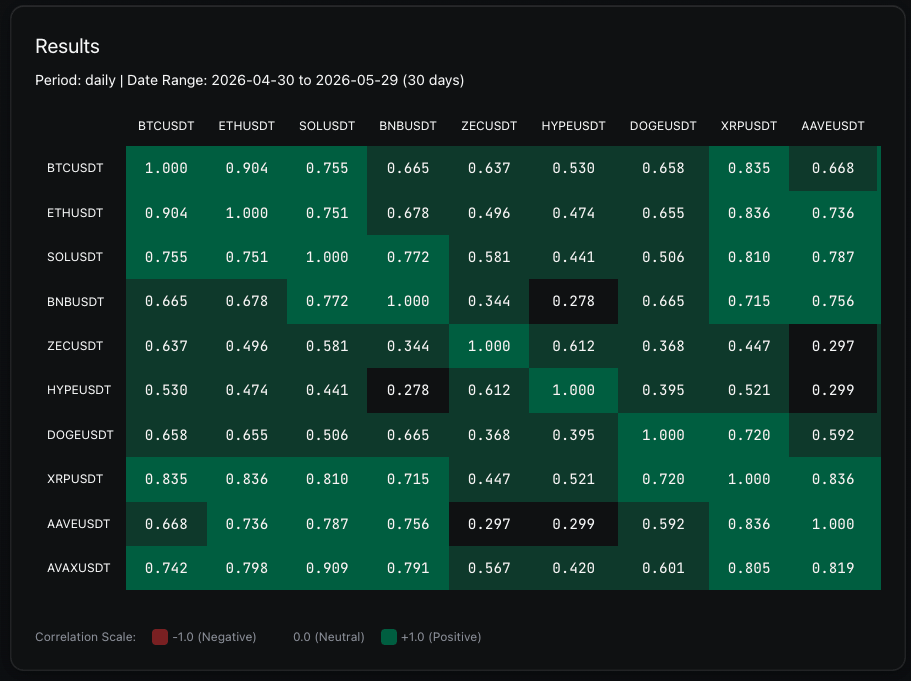
Outliers exist, but they are rare, and that correlation has a practical consequence. Drawing precise support and resistance on some random altcoin is usually pointless, because the coin is not trading on its own chart, it is trading on its beta to BTC and the overall tape. Technical analysis still has its place, but in crypto it is best kept simple and used as confluence, one input that lines up with the positioning data rather than a system you trade off blindly. The data gives you the bias, and it flags the moments when a single market is breaking away from the pack.
Momentum
Momentum, or trend following, is the simplest idea in trading. Something is moving, so you bet it keeps moving. You buy strength or sell weakness, you accept being wrong often, and you make your money on the handful of trades that actually run.
It works in crypto because moves here travel further than they have any right to. The hard part is not spotting a trend, it is telling a real one from a trap. That is where open interest and funding earn their keep.
There are plenty of ways to capture a trend, from indicators to cross-asset momentum where you go long the best-performing decile and short the weakest, but here we are focused on doing it with derivatives data.
The healthy version looks like this. Price rising, open interest rising with it, funding staying low. Rising open interest means new money is committing to the move rather than old positions rotating between hands. And when funding stays low, or even dips negative, during a rally, the buying is coming from spot rather than from crowded leveraged longs. A perp trading at or below spot means the spot buyers are out in front, dragging the perp up behind them. That is about as clean a “this trend has real demand” reading as you get.
PENGU through the back half of 2025 is a textbook case.
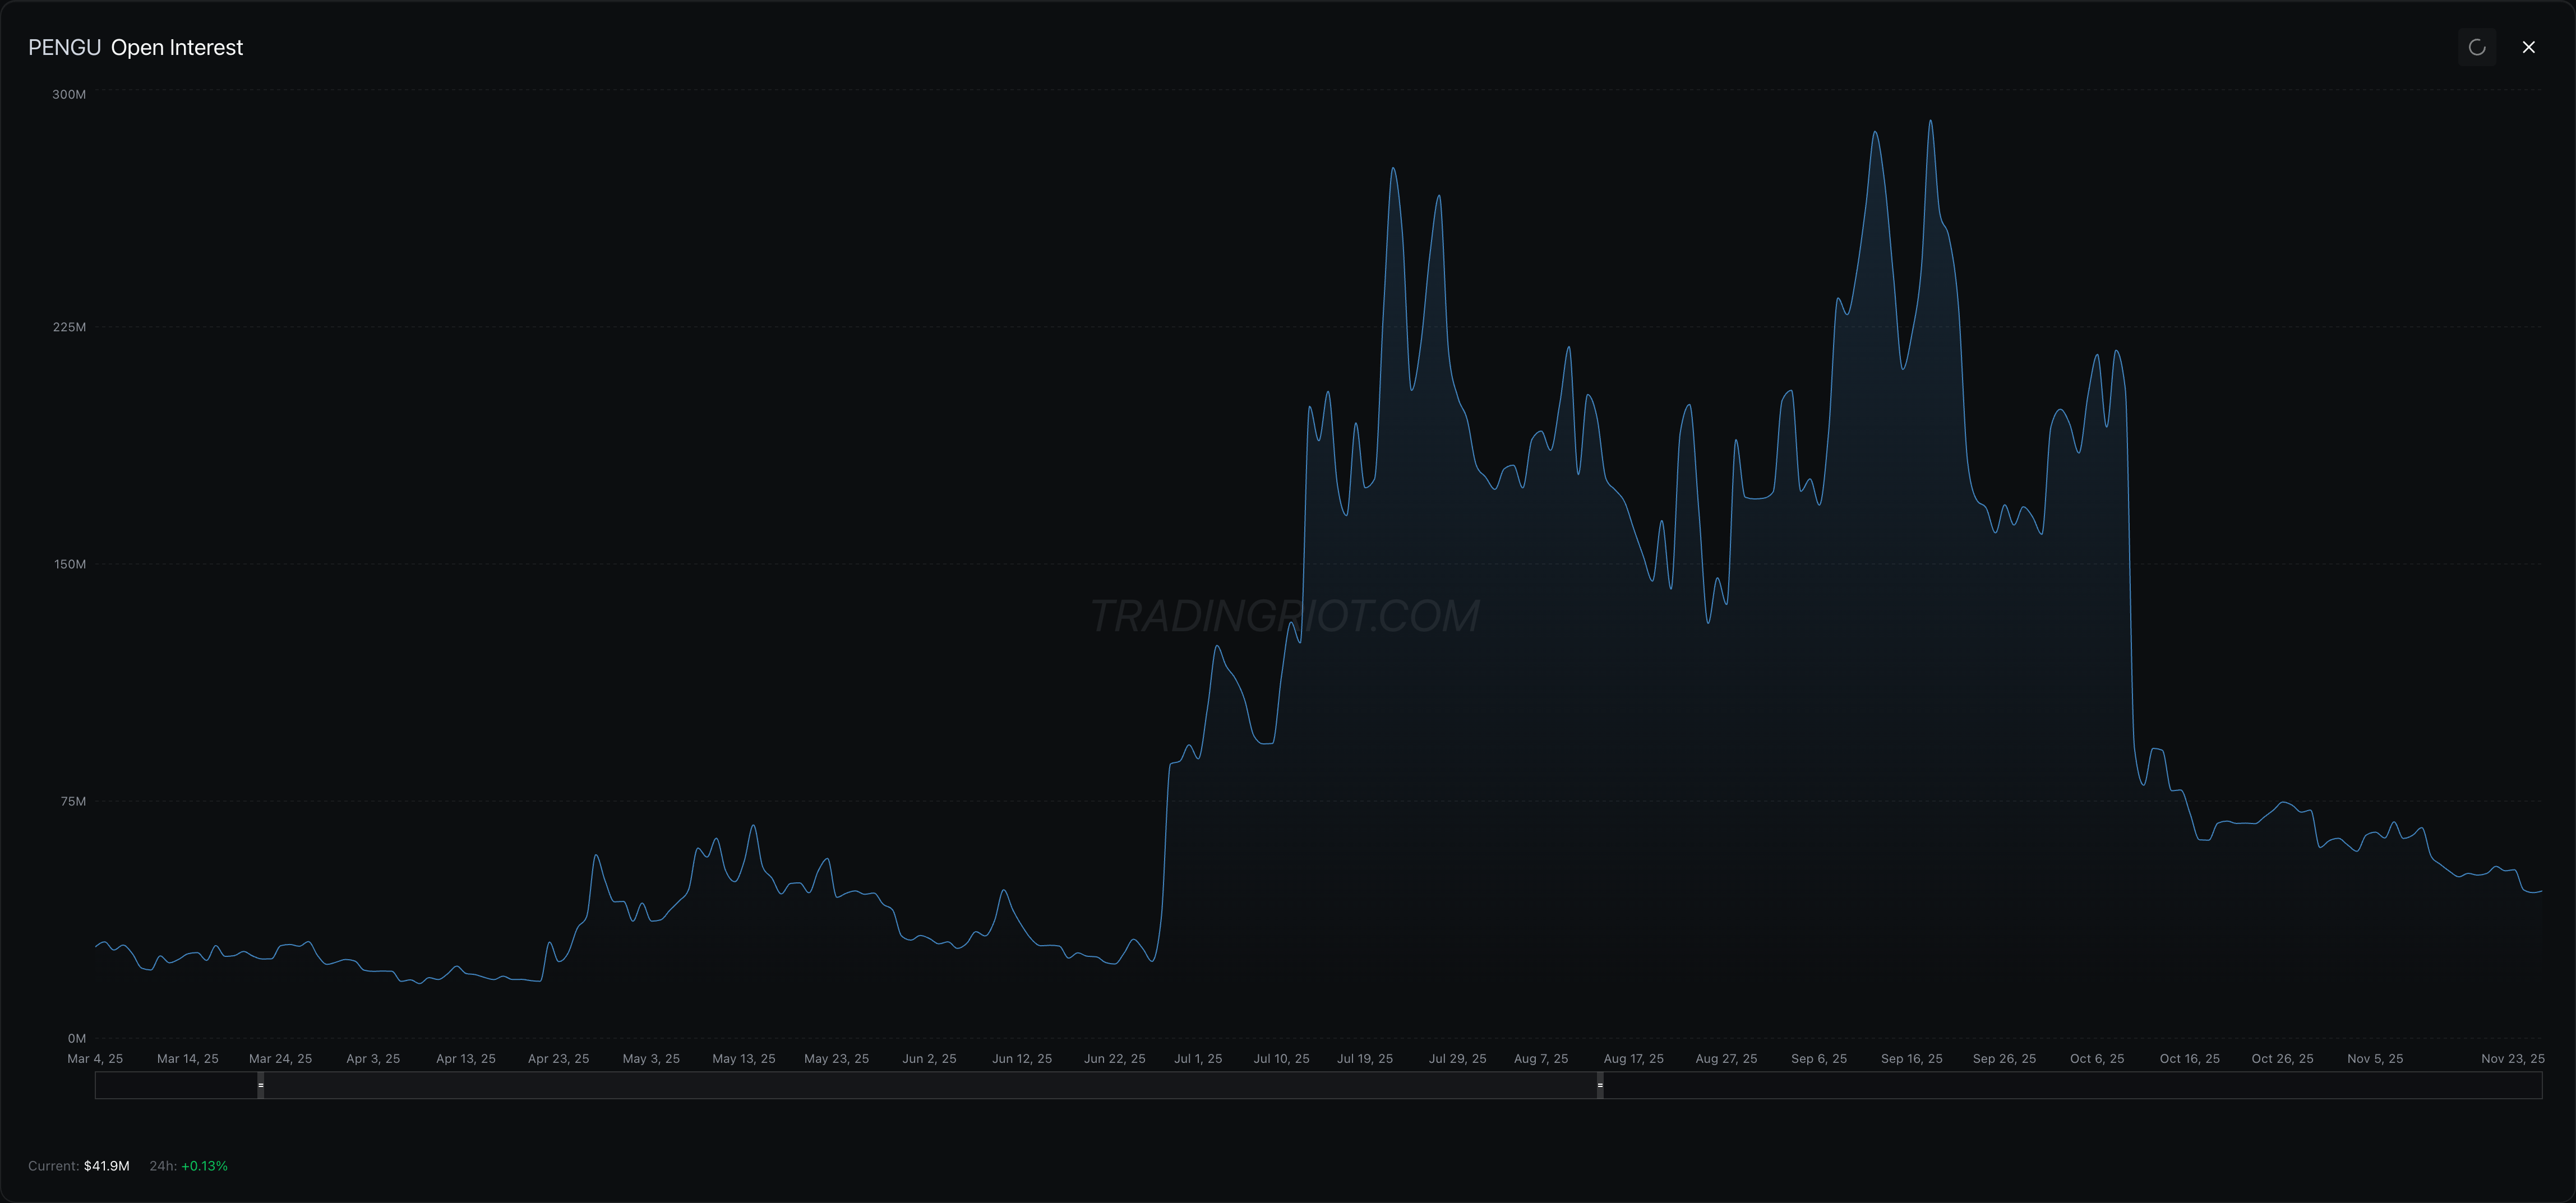
Open interest sat dead around 40 to 50 million for months. Then it exploded from late June, ripping past 150 million and on toward 290 million as the coin rallied. New money, pouring in.
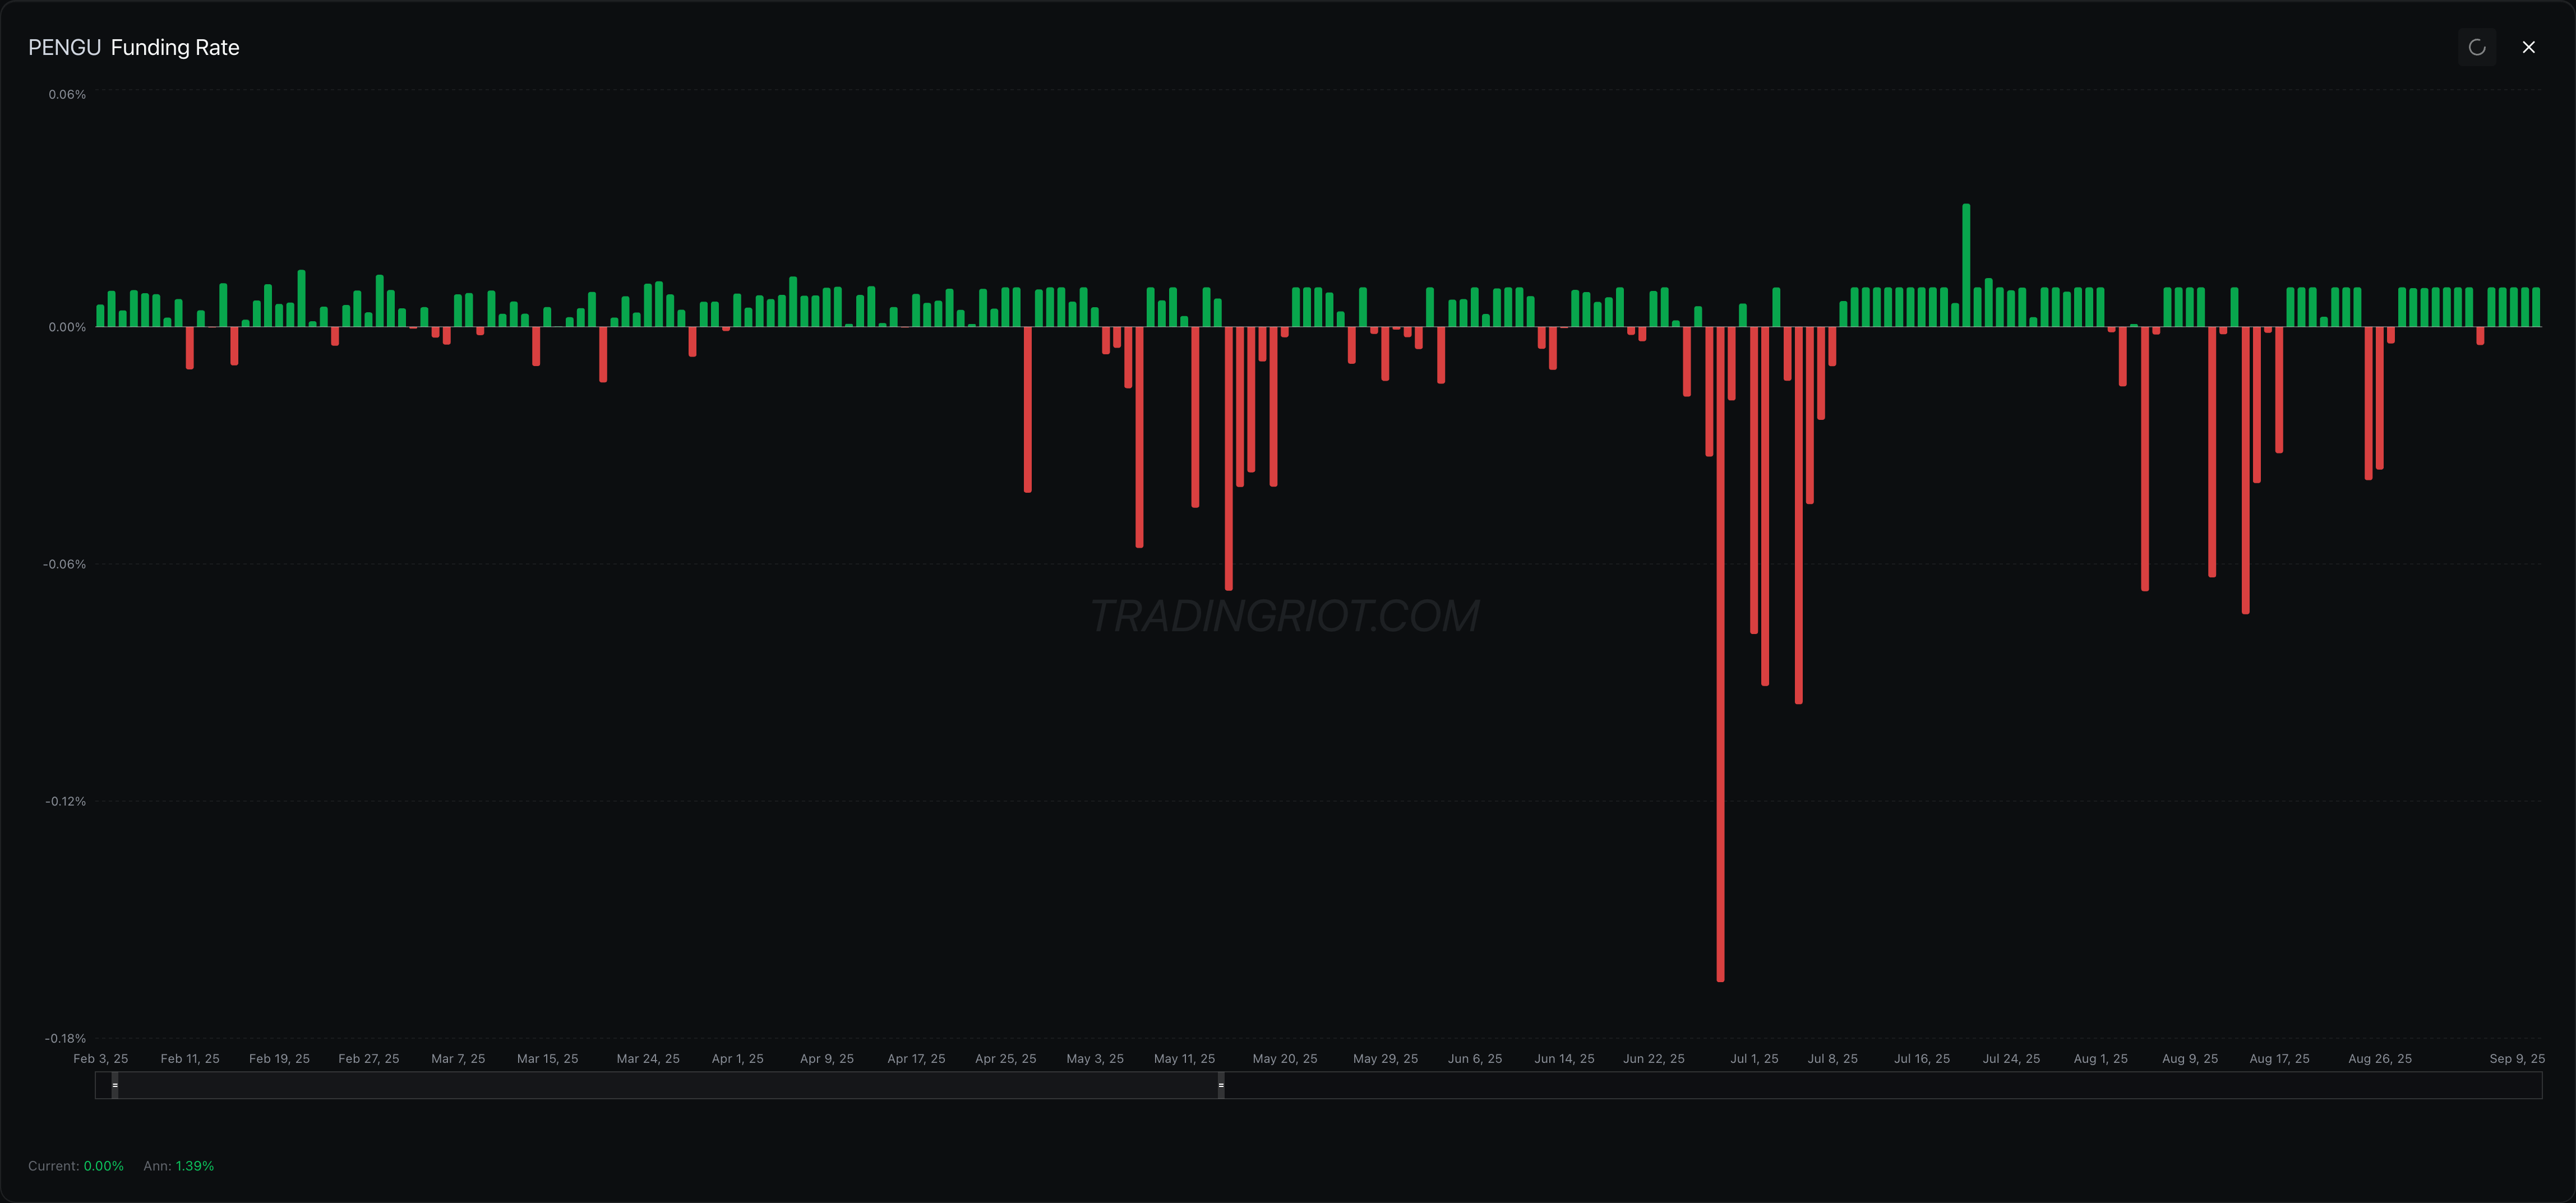
Now look at funding over the same stretch. It stayed muted the entire way up, and at the key moments it flushed negative, including a hard spike down near minus 0.17% in early July. Negative funding while price and open interest climb means shorts were paying longs and the perp was trading below spot. The rally was led by spot demand, not by leverage chasing it. Money committing, no long froth. This is where technical analysis and indicators earn their keep, giving the trade a structure and a clear invalidation point.
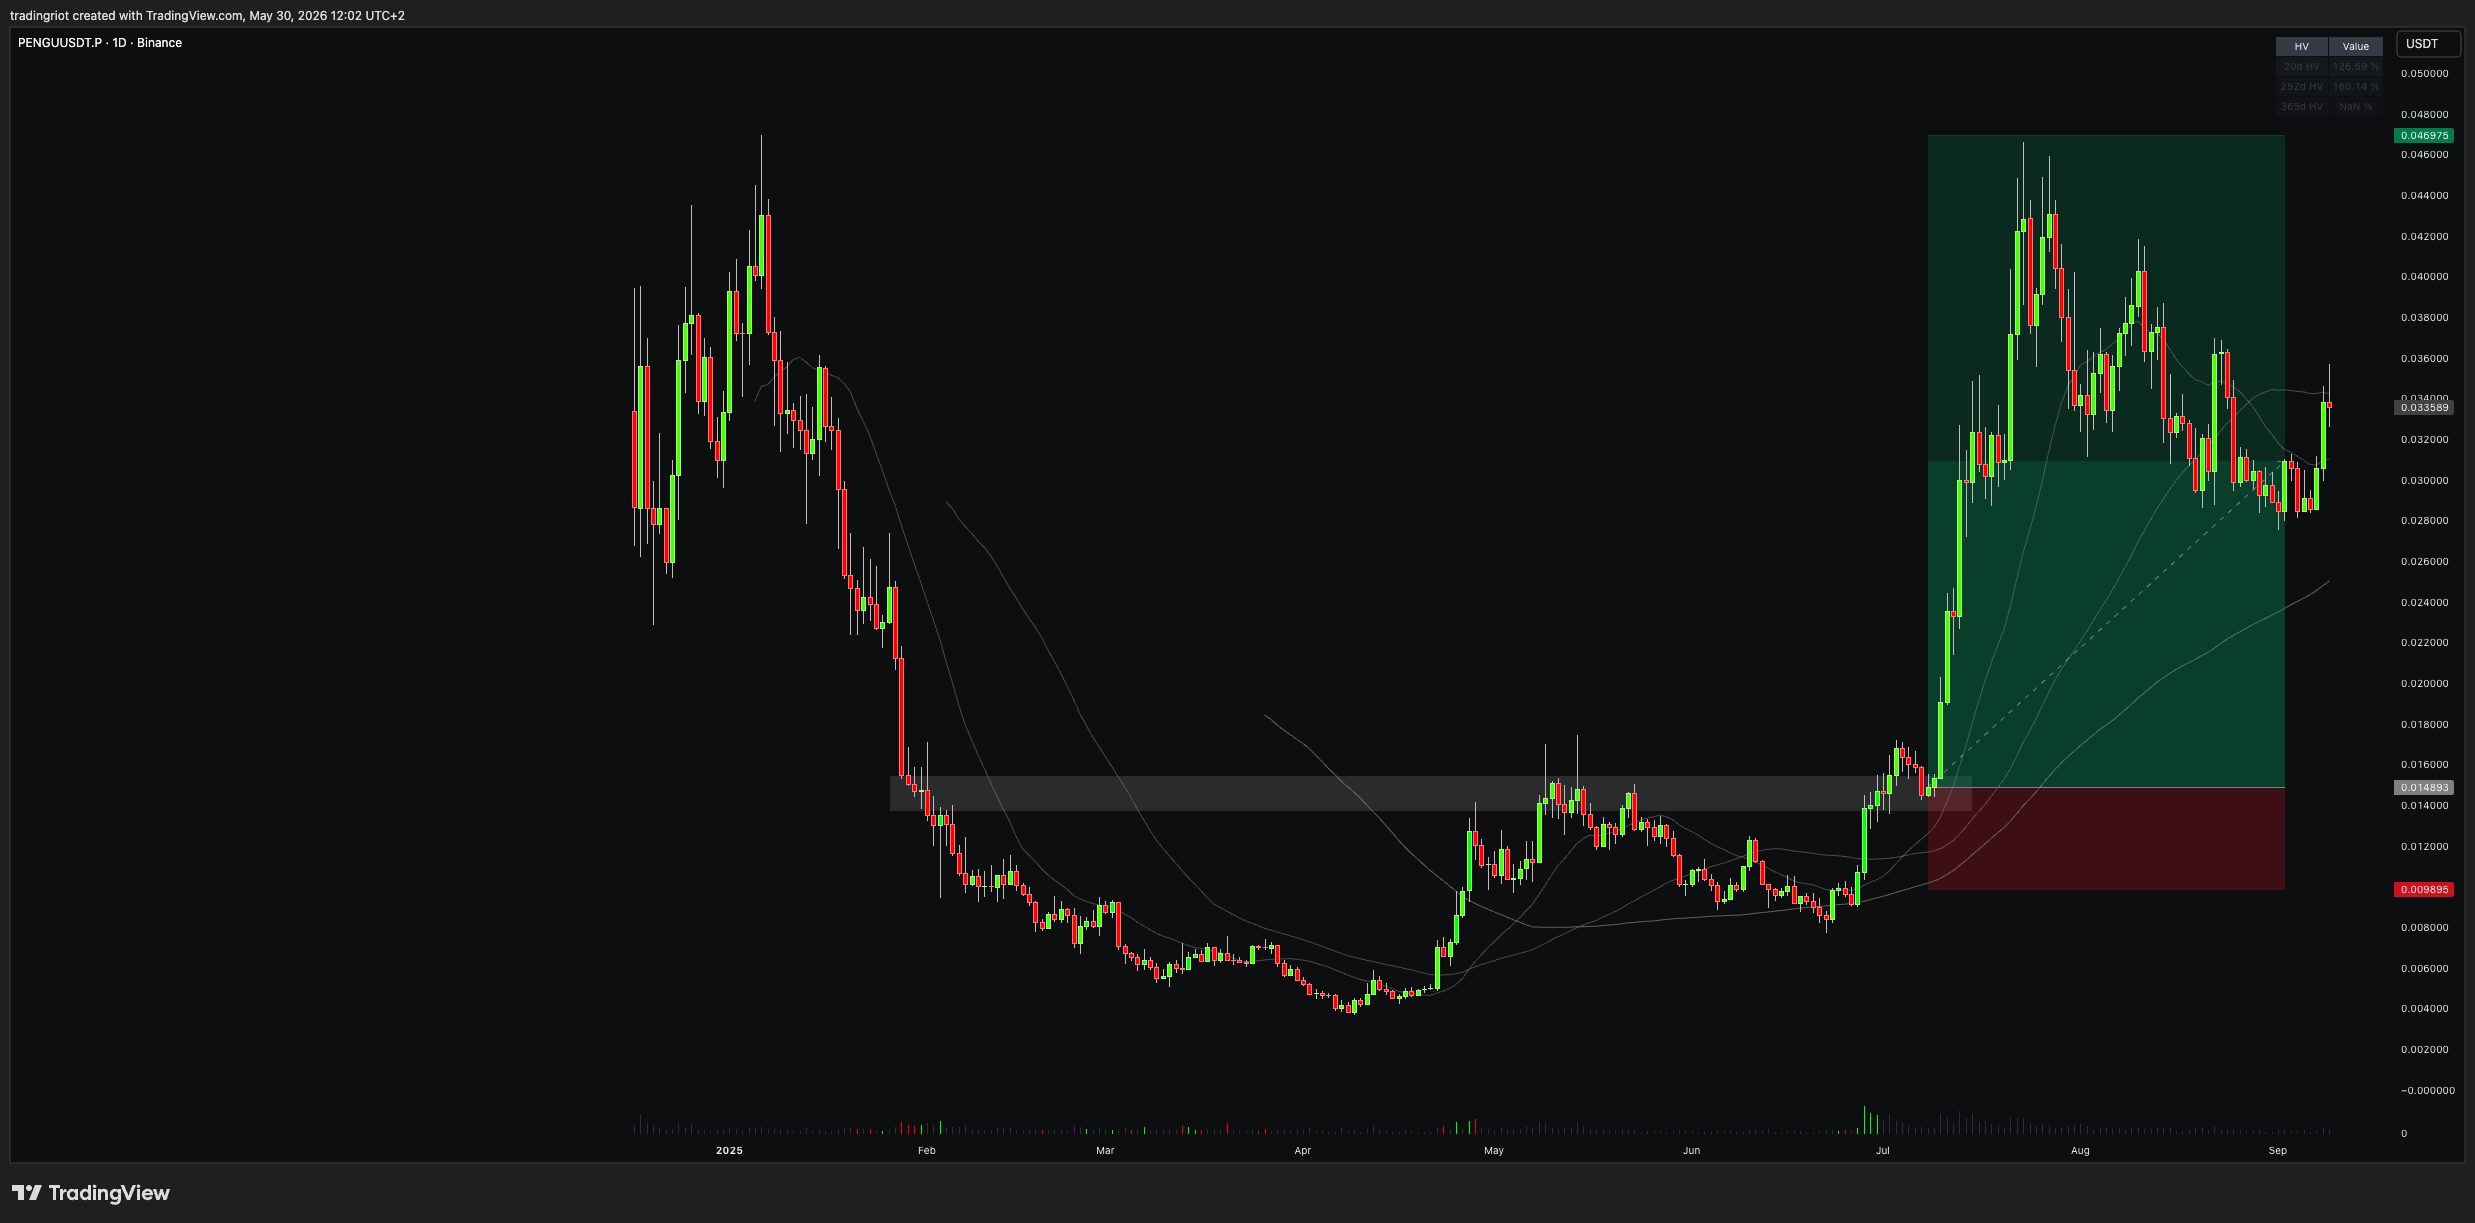
This is not an article on trade management, but momentum trades are built to be held. Look at the track record of any trend-following strategy and you see the same shape: a long string of small losses broken up by the occasional big win. Below is a very simple trend-following system I built for Bitcoin.
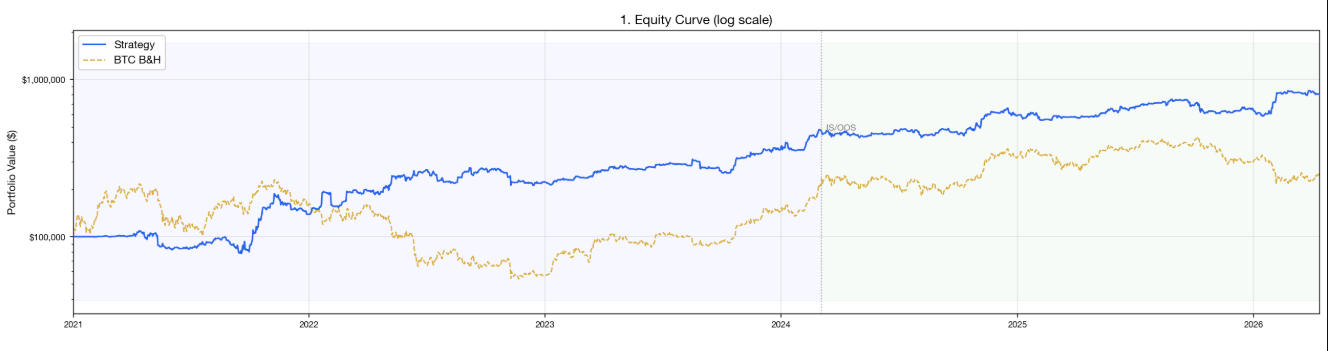
Momentum is great because while it has its good and bad years, I don't think it will ever go away, since it leans into how crowds behave. If you want to find strong momentum trades in crypto, look for markets with spiking open interest and muted funding, ideally breaking above or below a significant level in line with the moving averages. Those levels tend to trigger automated strategies and systems that pile in and fuel the move.
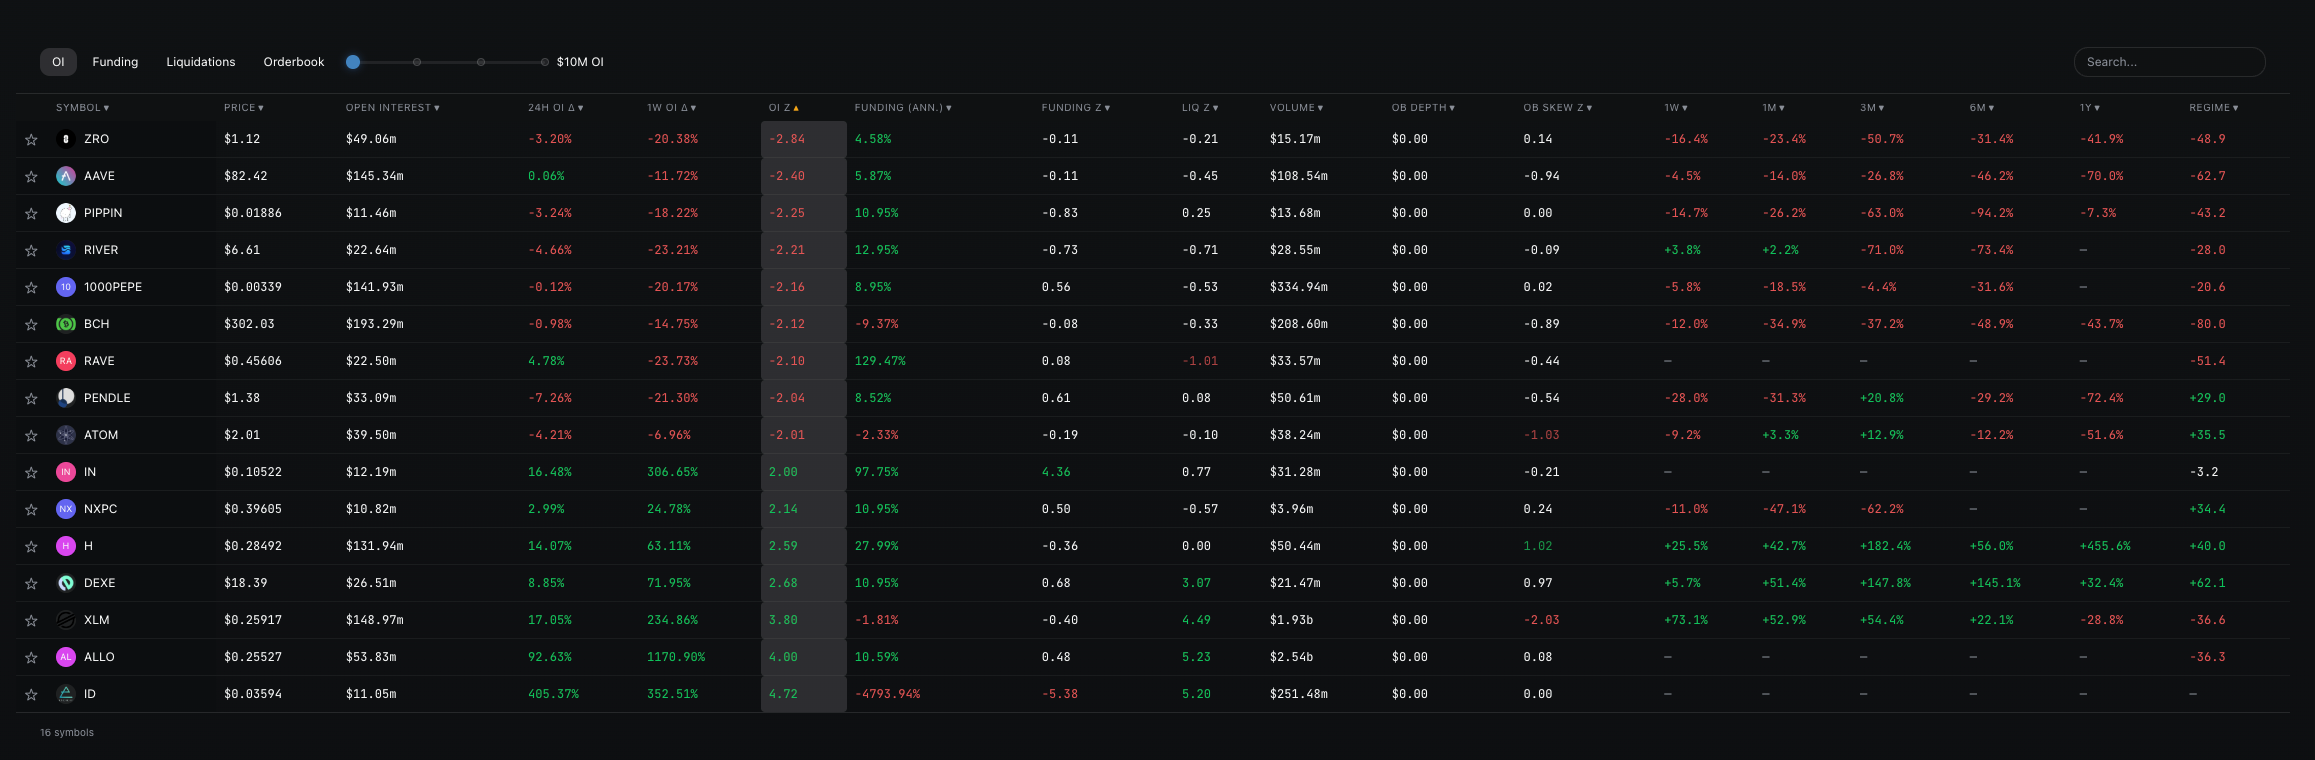
On tradingriot.com, you will find range of screeners and tools that will automatically find these for you.
Now flip the picture. The same two charts spiking together, open interest up and funding ripping hard positive at once, is the opposite of healthy demand. That is a crowded leveraged-long trade waiting to get flushed, and it sets up the next style instead of this one.
Mean Reversion
Markets range more often than they trend, so fading moves is tempting, and everyone loves calling tops and bottoms.
The problem is you are trading against the trend, and trends in crypto run longer and more violently than anyone expects. Most people who try to pick tops just get run over, again and again, until the one time they are right pays for none of the times they were early. Trade any real size and you learn another lesson fast: getting stopped out against a strong trend hurts, because the slippage is usually brutal.
Still, mean reversion works in every market, because trends do not run forever and they tend to get crowded before they break.
When you are fading a strong move, two rules keep you alive.
First, the move you are fading is usually short-lived. A trend can grind one direction for weeks. The reversion off a blow-off is quick, a sharp snap and then it is done. You are catching a rubber band, not a new trend, so get in, take the snap, and get out.
Second, the one people skip, you need somewhere for price to revert to. You are reverting to a mean, so define the mean: a prior level, a moving average, something real. You fade the extreme back toward that level and you cover there. Shorting just because price is “too high” with no target is how you donate money.
Your trade and money management have to differ between the two as well. In trend following you are holding on for dear life. In mean reversion you want to be in and out fast.
The derivatives data is just as useful here. Open interest spikes and funding rips hard positive at the same time, and that combination tells you the move is being driven by crowded leveraged longs paying through the nose to stay in. When the late longs are this stretched, there is little fuel left, and the snap back tends to be brutal.
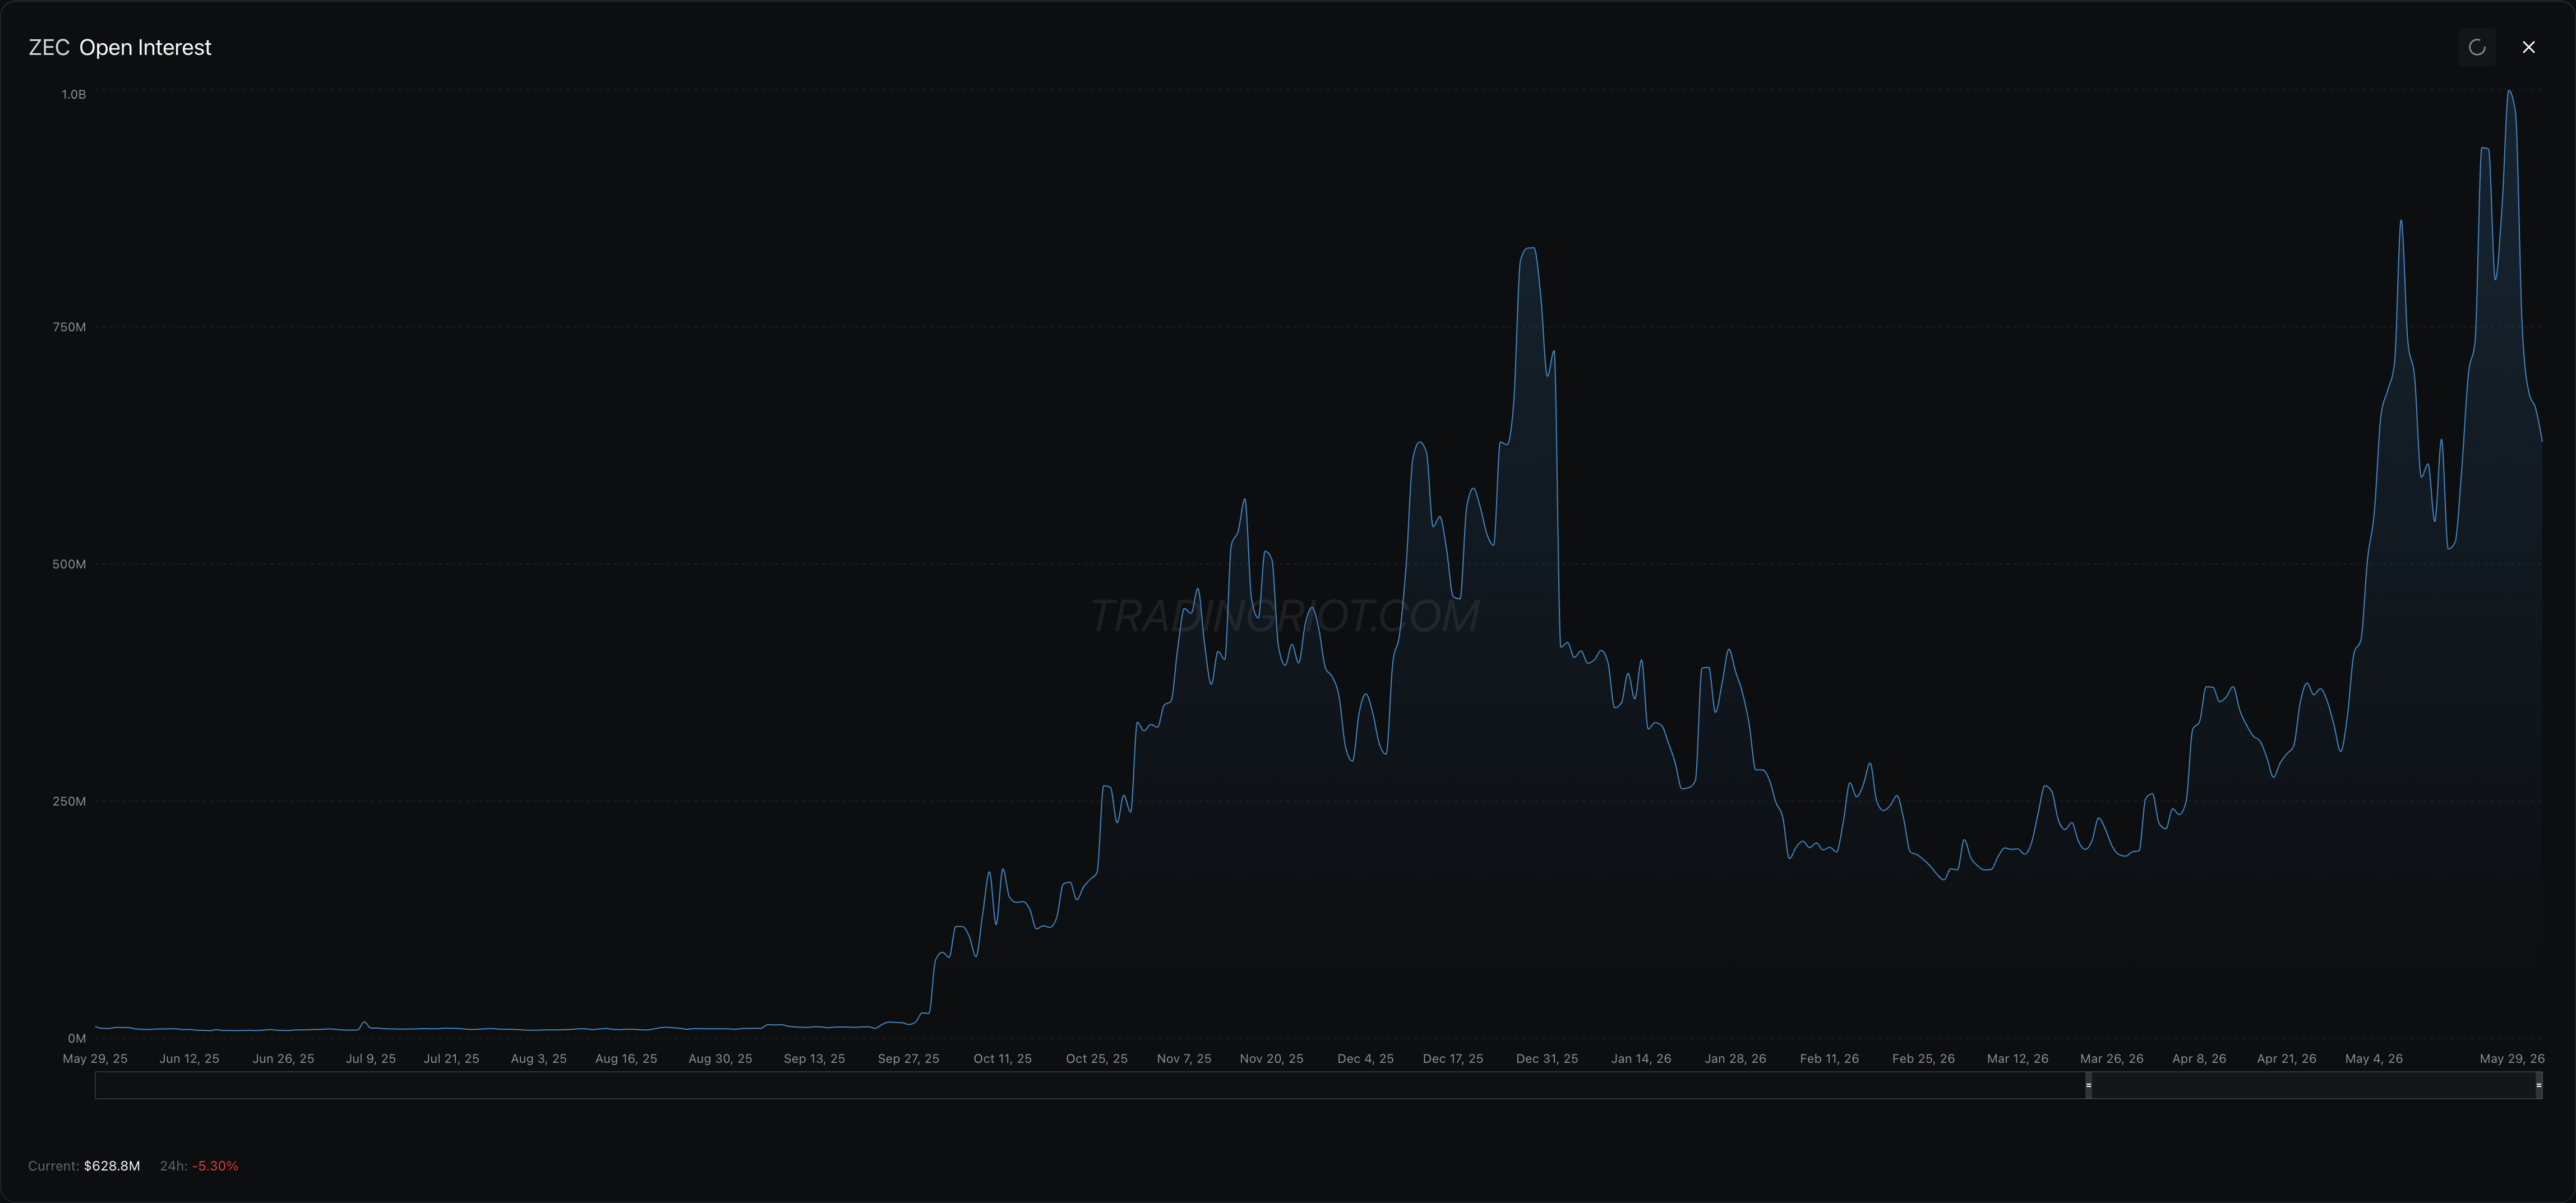
ZEC from early May 2026 is a clean example.
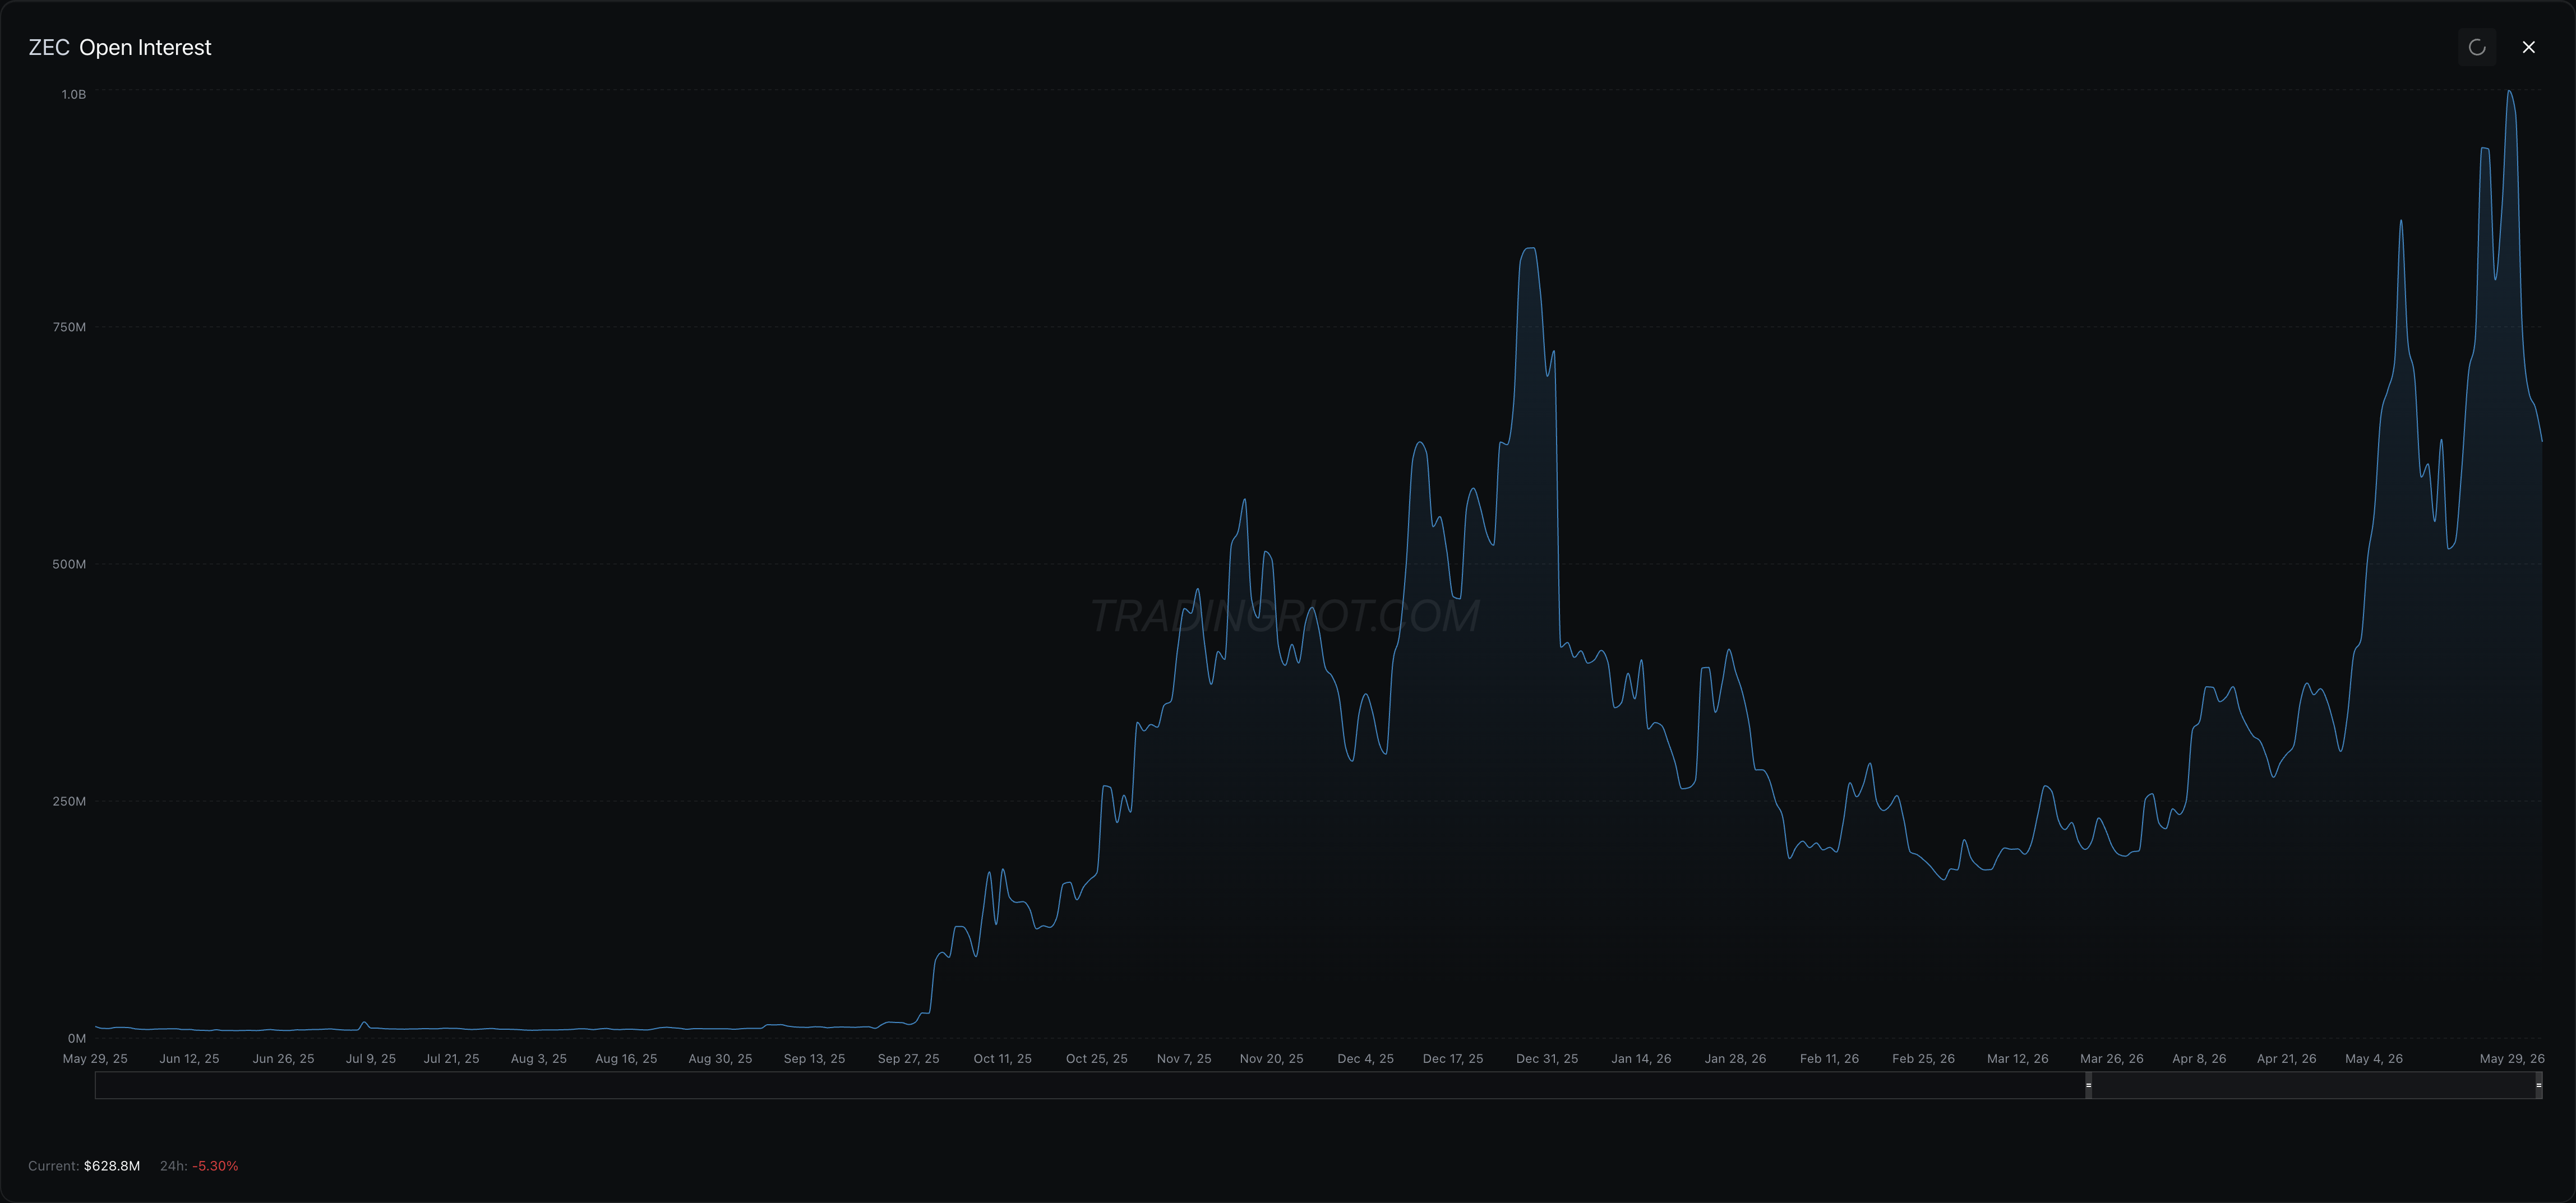
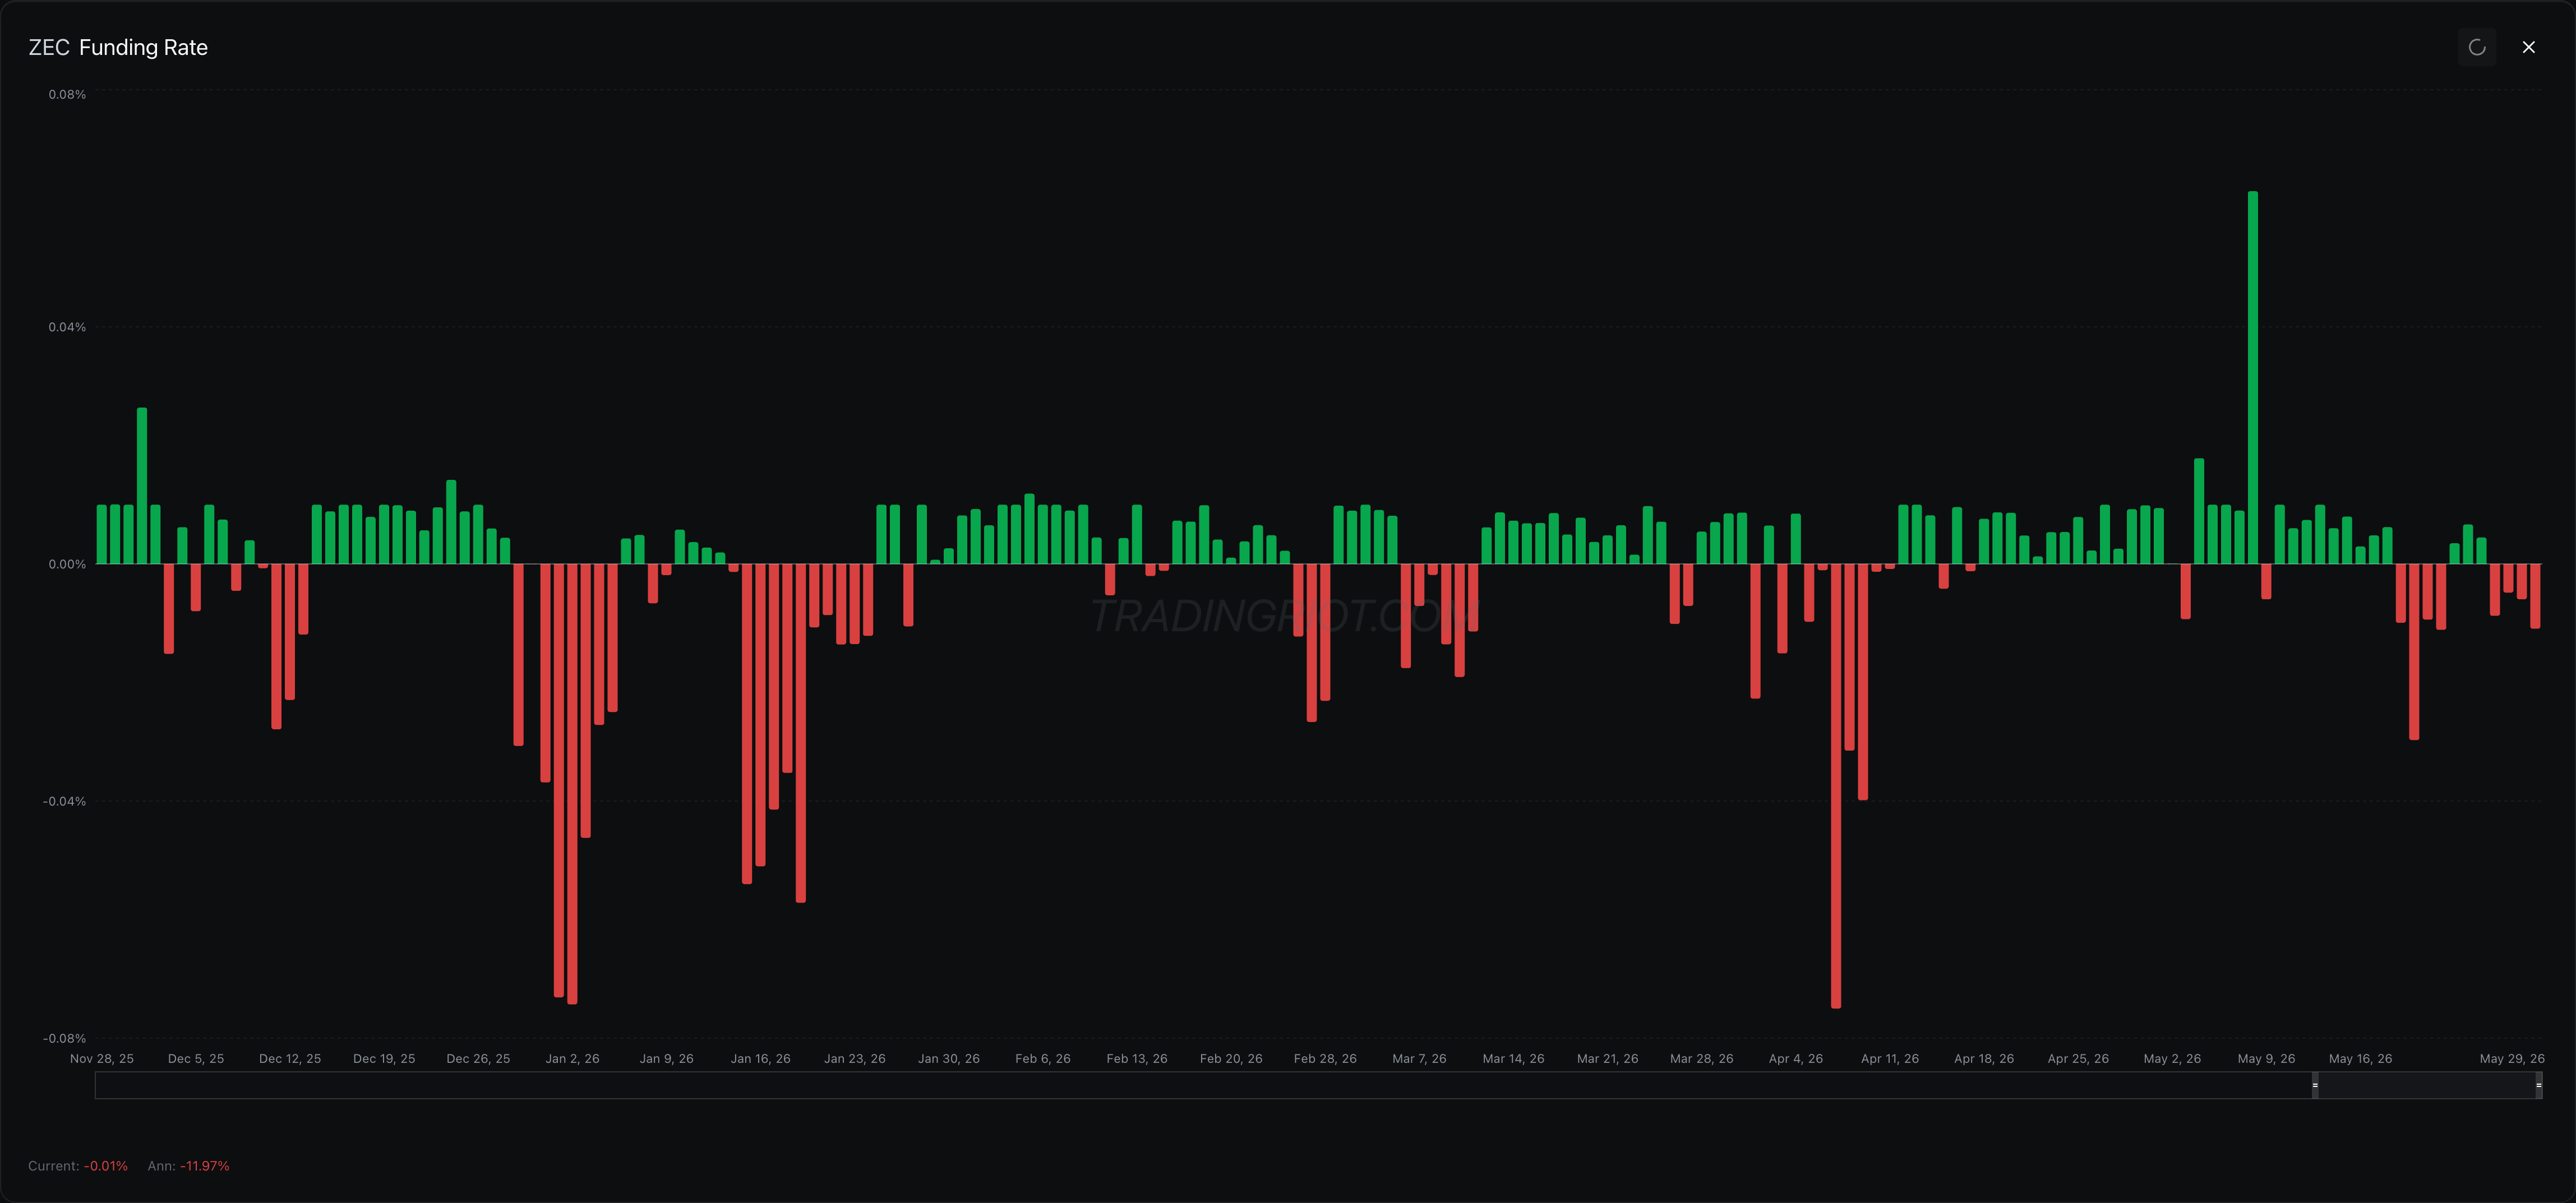
Through early May, ZEC's open interest exploded toward a billion dollars, several times its level from earlier in the year, and around May 8 funding spiked hard positive, a solid example of froth.
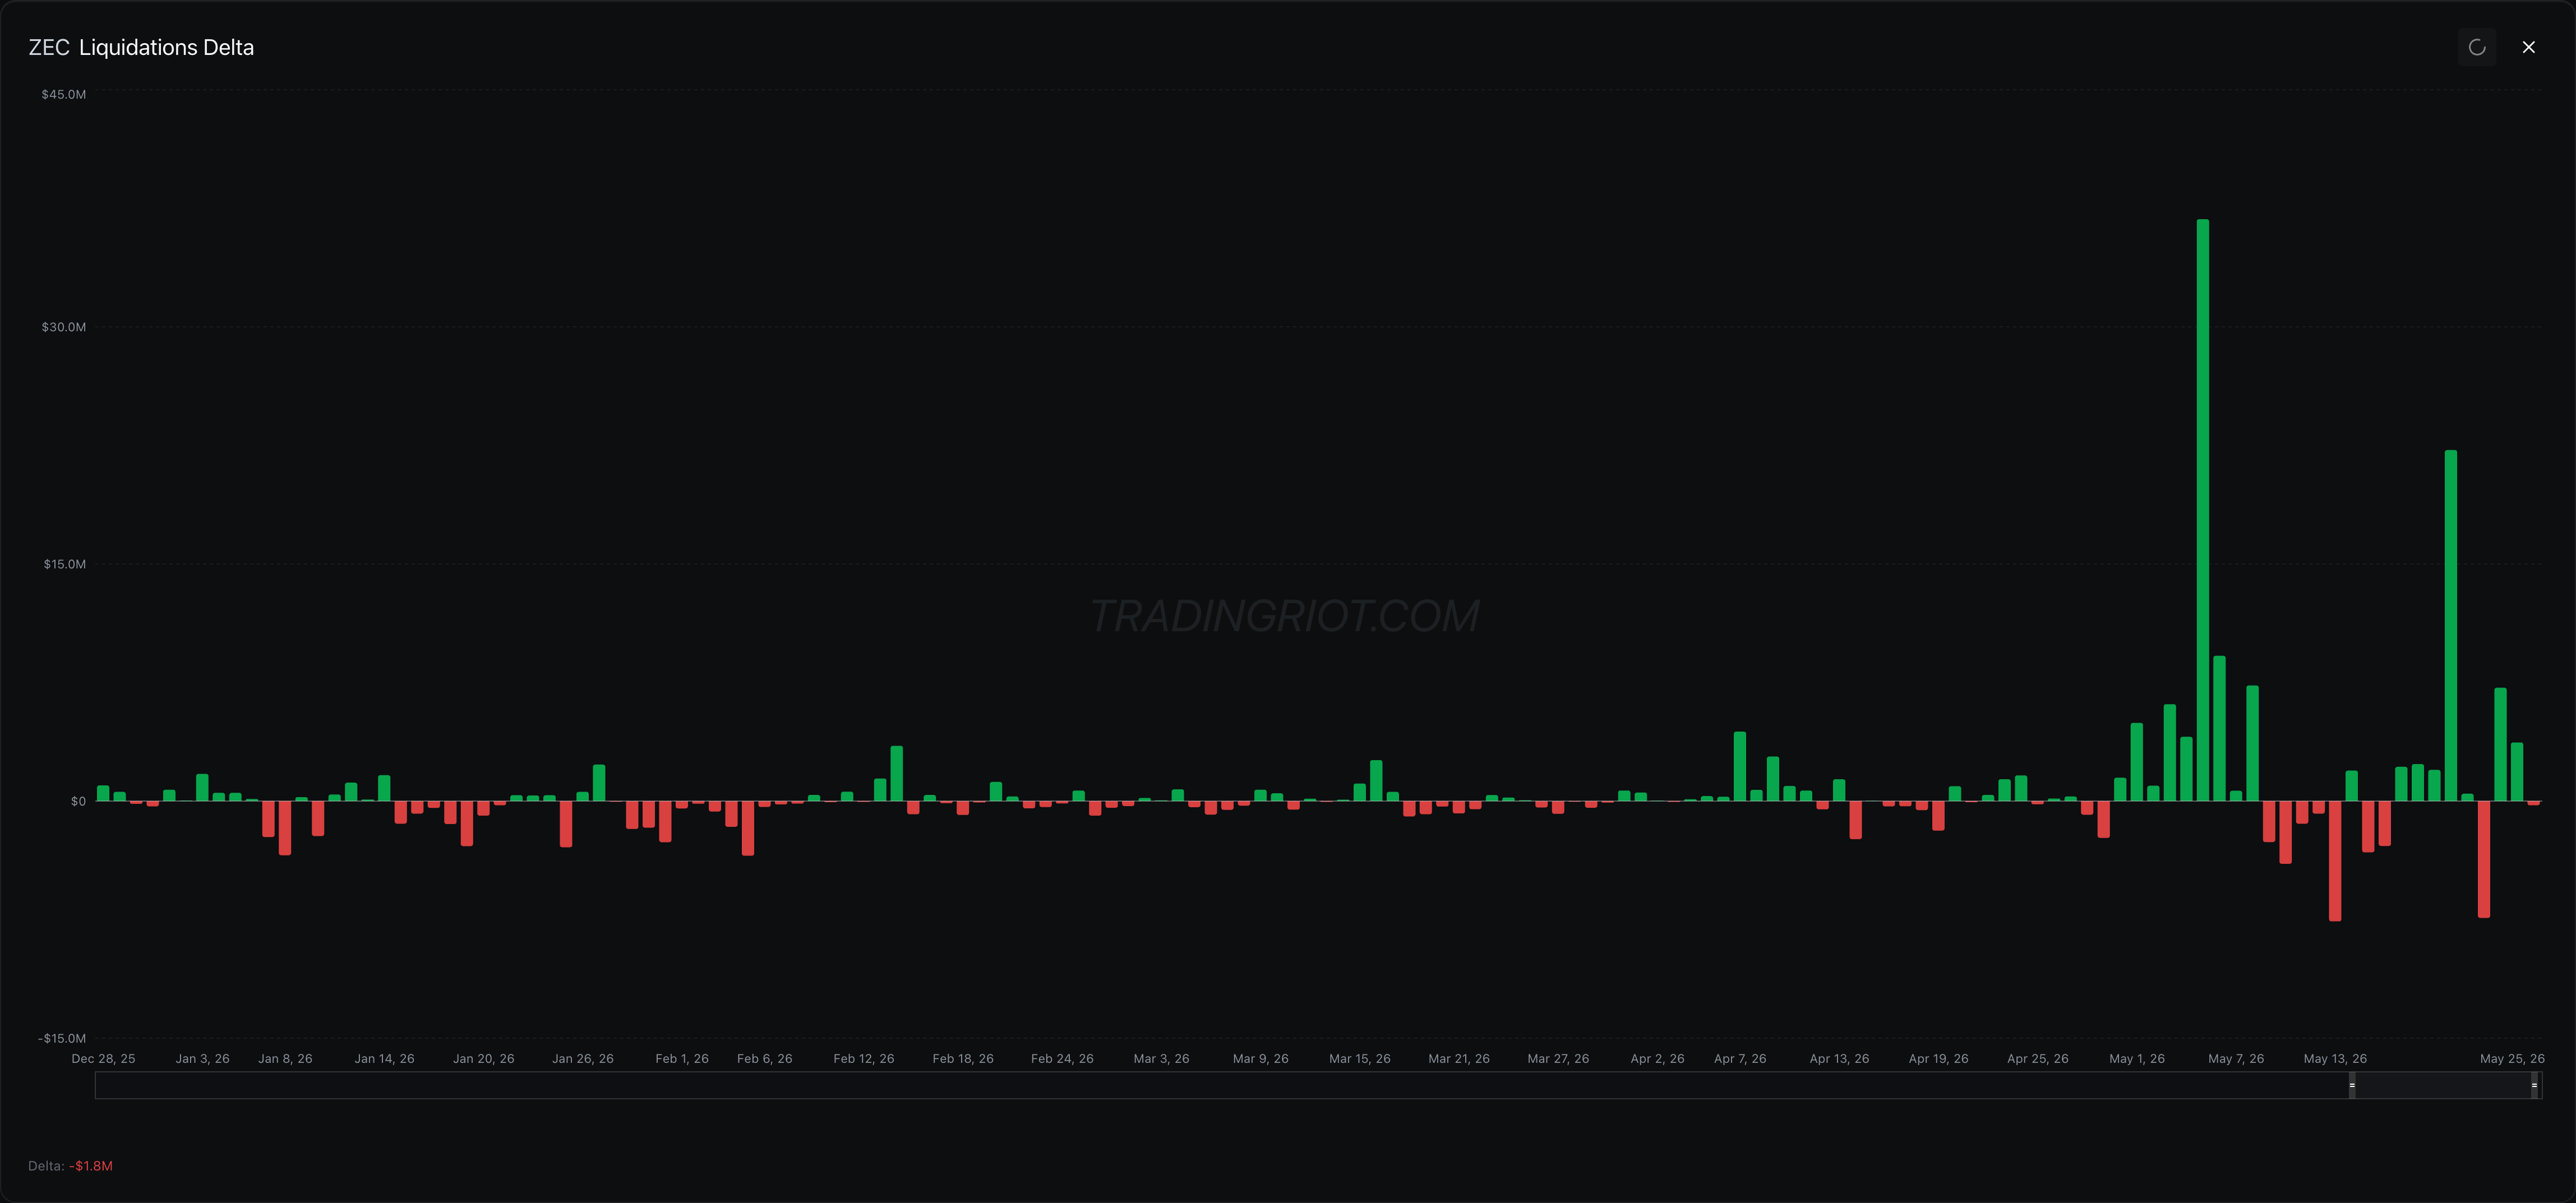
The confluence came from liquidations. Right into the highs, a huge spike of short liquidations hit, the biggest on the chart, as the last bears got squeezed and force-bought into the top. That is the part worth understanding. Once the shorts have all been flushed, there is nobody left to squeeze, and the buying that drove the final leg simply disappears. The blow-off marks itself.
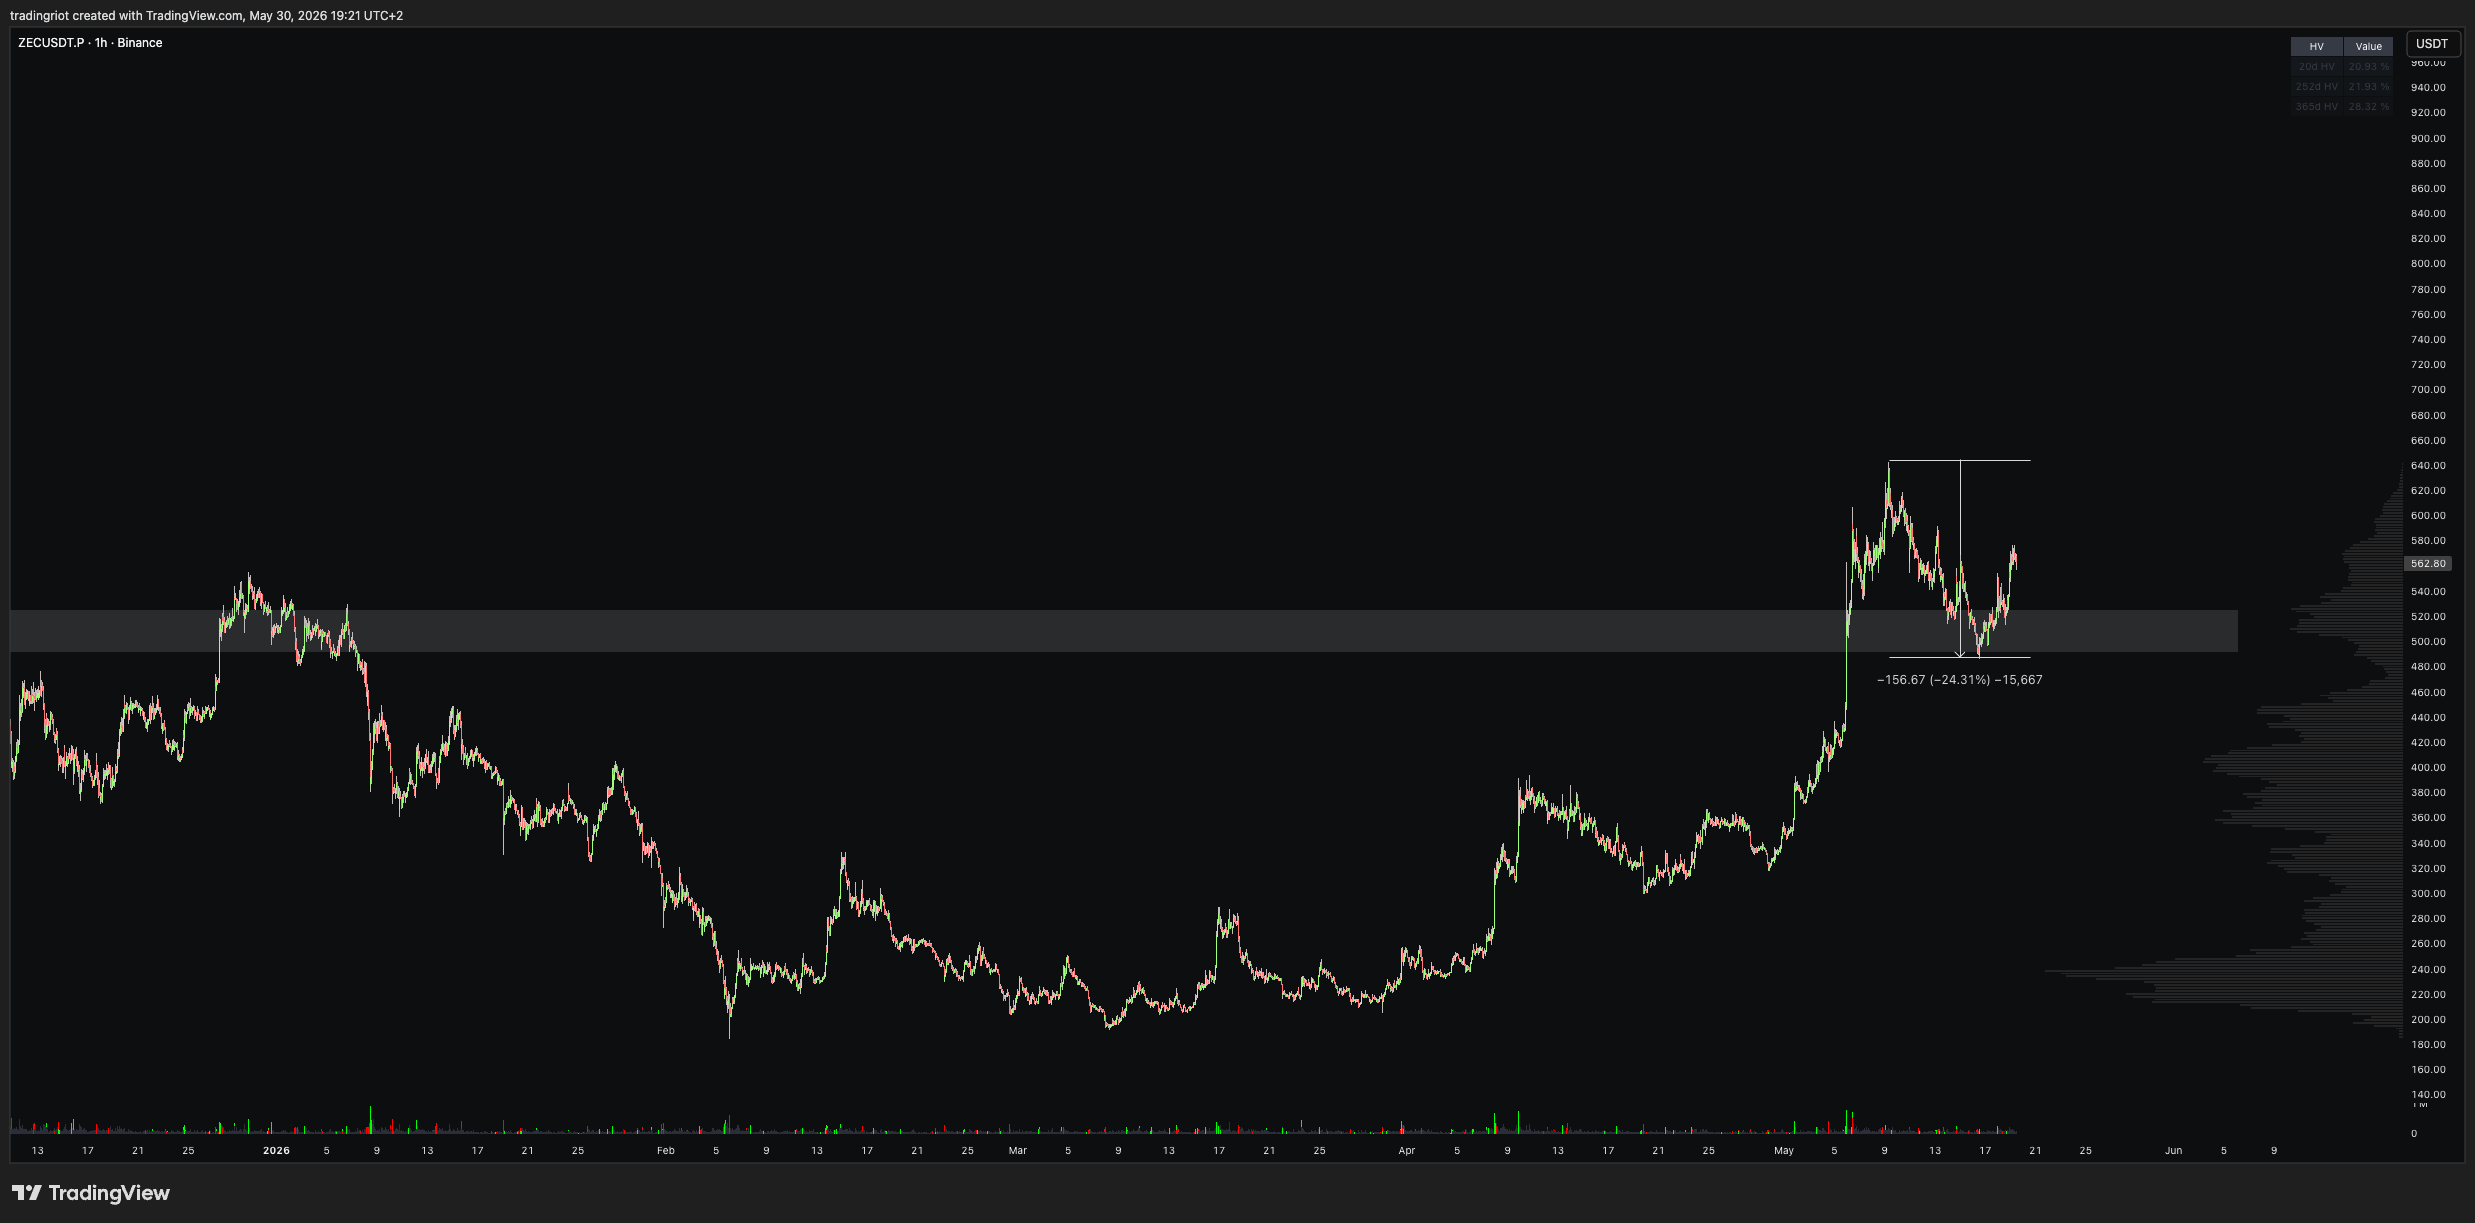
From there ZEC rolled over and gave back about 25%, snapping straight down into a prior level in the mid 500s where the higher-timeframe moving averages and old structure lined up. That was the mean. A trader fading the froth was not betting ZEC was finished, only that an overstretched move pays you to fade it back to where it came from.
So the discipline is narrow. Fade extremes only when the data confirms the froth, when one side has clearly been flushed, and when you have a level to aim at. Miss any of those and you are guessing.
Delta Neutral
When you take a directional trade, which both momentum and mean reversion are, you might sometime hear that you have a delta one position as you are betting on which way price goes. Delta neutral throws that out. You build a position with no net bet on direction and get paid for something else entirely.
From options greeks, delta is how much your position moves for a one dollar move in the underlying. A long has positive delta, a short has negative delta. Size them against each other so they cancel and you are delta neutral, roughly indifferent to whether the thing goes up or down. What you collect instead is a spread or a yield.
This is not a crypto invention. The classic version lives in traditional futures and goes by cash and carry. When a future trades above spot by more than the cost of carry, an arbitrageur buys the underlying and sells the future against it.
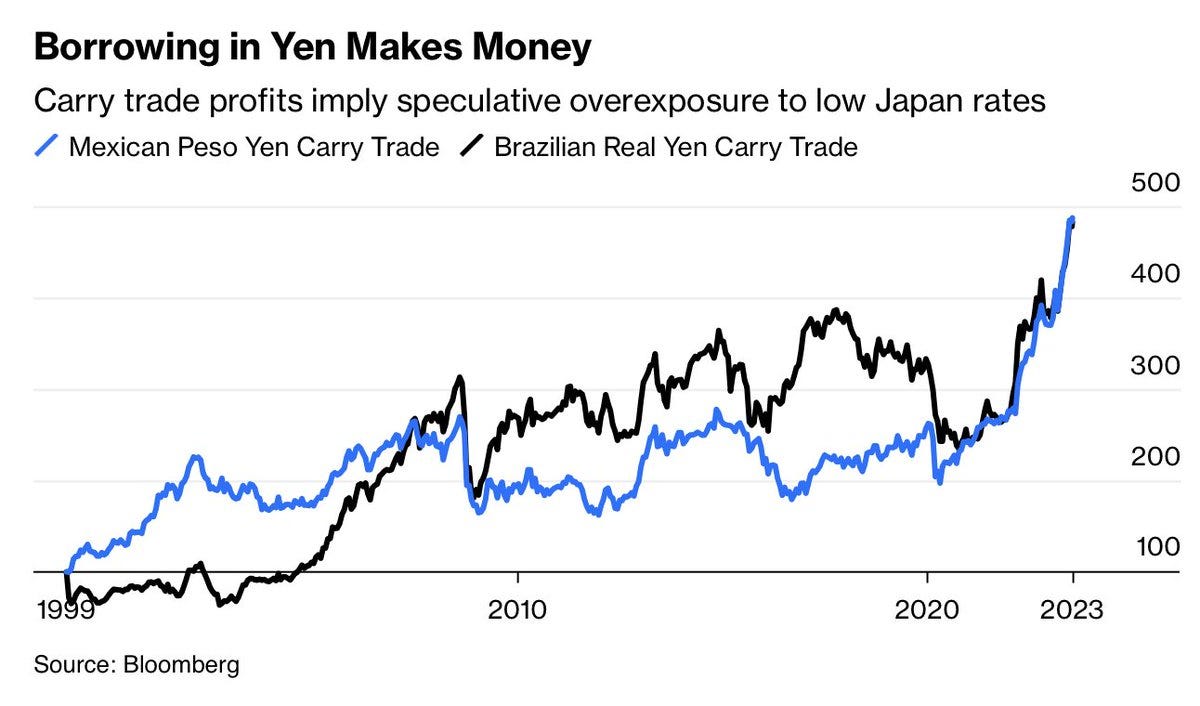
The legs cancel directionally, and as the future converges to spot at expiry, the trader keeps the gap. No opinion on price needed, just a view that the spread is too wide. Index arbitrage works the same way, and so does old-fashioned pairs trading, where you go long one name and short a correlated one and bet only on the spread between them.
Crypto gives you a few ways to run this. Start with the fact that it is not all perps. Exchanges list dated futures too, quarterly contracts on Binance, Deribit, and CME, and those behave like proper classical futures with a real expiry and a basis that has to converge. The textbook cash and carry works on them directly. Buy spot, short the quarterly while it trades at a premium, and collect the annualized basis as it grinds back to spot into expiry. It is finite, and it is delta neutral.
Then there are pairs. Crypto is so heavily correlated that relative value is often cleaner than an outright bet. If you think ETH outperforms BTC, you go long ETH and short BTC in equal dollar size. The shared market beta cancels and you are left holding only the spread between the two, so you make money if ETH beats BTC whether the market rips or dumps. The same logic runs through baskets, stat arb, and market making.
The delta neutral trade most tied to perps, though, is funding rate arbitrage, and it deserves a proper walk-through.
Funding Rate Arbitrage
This is the perp version of cash and carry. When funding is positive, longs are paying shorts, so you buy spot and short the perpetual against it in equal size. Your net exposure to price is roughly zero, and every funding interval you collect what the longs are bleeding.
Say ETH funding is running at 0.05% per eight hours, around 55% annualized. You buy 10 ETH of spot and short 10 ETH of perpetual. Net delta is zero. Three times a day you collect 0.05% on the short, paid by the longs, so a week at that rate is roughly 1.05% on a position that does not care where ETH goes. Scale it up and it turns into real money. That is most of why the giant funding blowoffs from a few years back barely happen now. Too much capital is sitting there ready to harvest them.
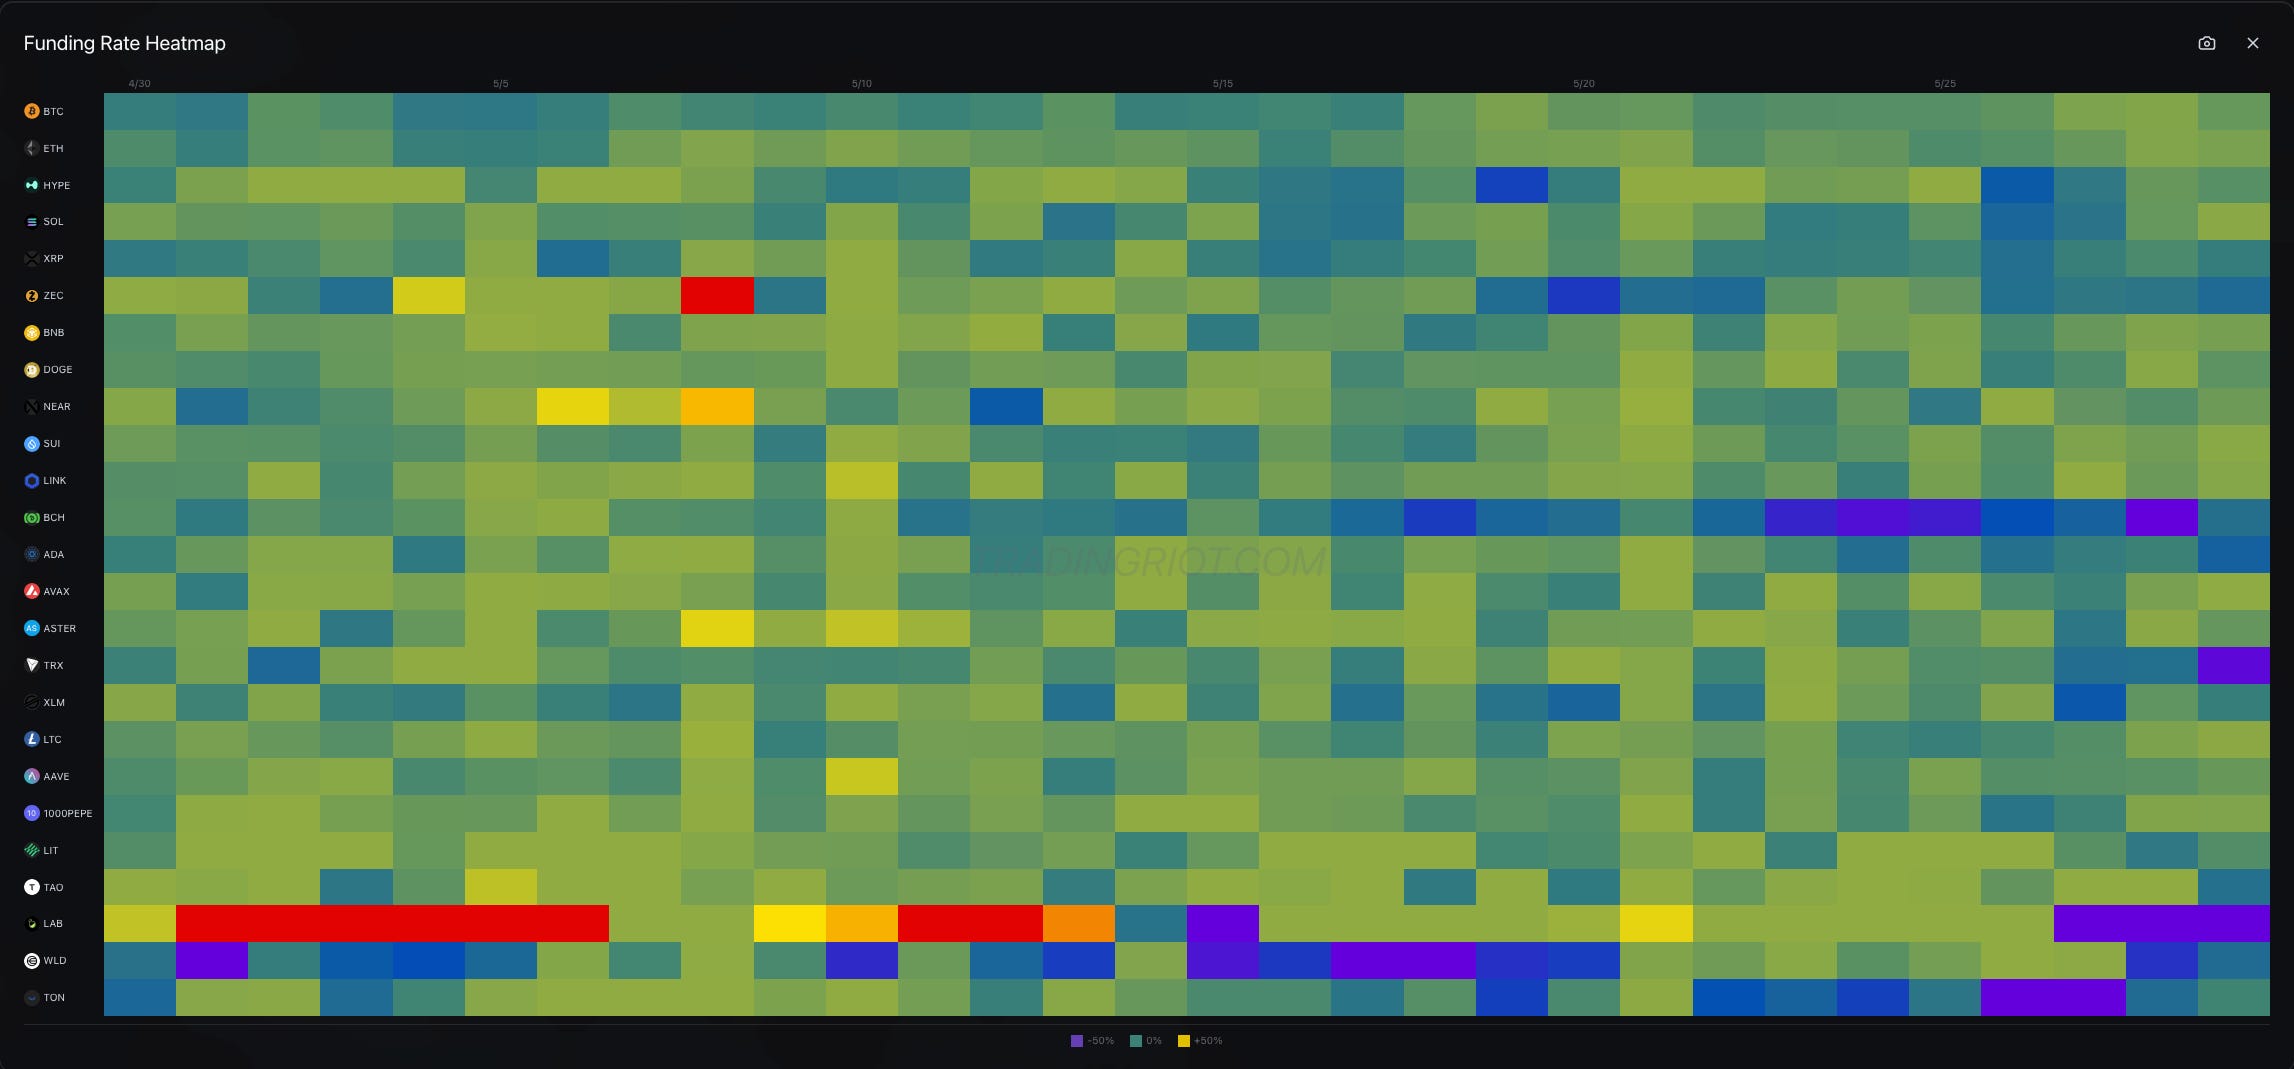
Across venues it gets more interesting. The same coin can carry wildly different funding on different exchanges, because funding only reflects supply and demand on that one venue. You might see single-digit annualized funding on one exchange and hundreds, even thousands, of percent on some illiquid one. When that gap opens you long the cheap perp, short the rich one, stay delta neutral, and keep the difference. The gaps are widest on thin alts, exactly because nobody can move enough size between venues to close them.
The opposite case is deeply negative funding, where shorts pay longs. It shows up often in alts, driven by market makers hedging spot they offloaded to retail, traders front-running unlocks, no demand for leveraged longs or spot-driven rallies. During persistent downtrends funding can also remain negative as directional shorts are dominant.
None of this is free money. Funding can flip mid-trade and put you on the paying side. Your short leg still needs margin, so a fast spike up can liquidate it even though your spot leg gained the same amount, and that risk is worse when the legs sit on different venues. Going cross-exchange piles counterparty risk onto every platform you touch, splits your capital so it works less efficiently, and chains you to transfer delays if one side needs topping up in a hurry. The exit is where these usually break, because unwinding size on a thin venue mid-move can cost more in slippage than weeks of collected funding. Funding arbitrage is a risk premium. It works right up until it does not.
What Drives Extreme Funding Rates
Through out the article I have mentioned funding rates in double digits, but if you have been trading crypto for a while I am sure you have seen funding rates in hundreds or thousands.
Extreme positive funding happens during euphoric rallies when everyone wants to be long. The demand for long exposure exceeds the available supply of shorts, so longs pay a premium to maintain their positions.
Extreme negative funding is more interesting and happens frequently in altcoins.
A few dynamics drive this:
When market makers sell tokens to retail buyers in spot markets (during token unlocks, airdrops, or just normal selling), they often hedge by shorting perpetuals. This creates selling pressure on the perpetual side, pushing funding negative.
If a large token unlock is approaching, traders front-run the expected selling by shorting perpetuals. This drives funding deeply negative even before the actual selling happens.
Many altcoins simply do not have enough buyers who want leveraged long exposure. The short side is dominated by hedgers and speculators betting on the project failing, while the long side is thin. This structural imbalance keeps funding persistently negative.
Sometimes altcoins trade at a premium on spot markets (due to low float, exchange listing differences, or withdrawal issues) while perpetuals trade closer to fair value. This creates persistent negative funding.
You will often see altcoins with funding rates of -0.1% to -0.5% per 8 hours (that is -100% to -500% annualized).
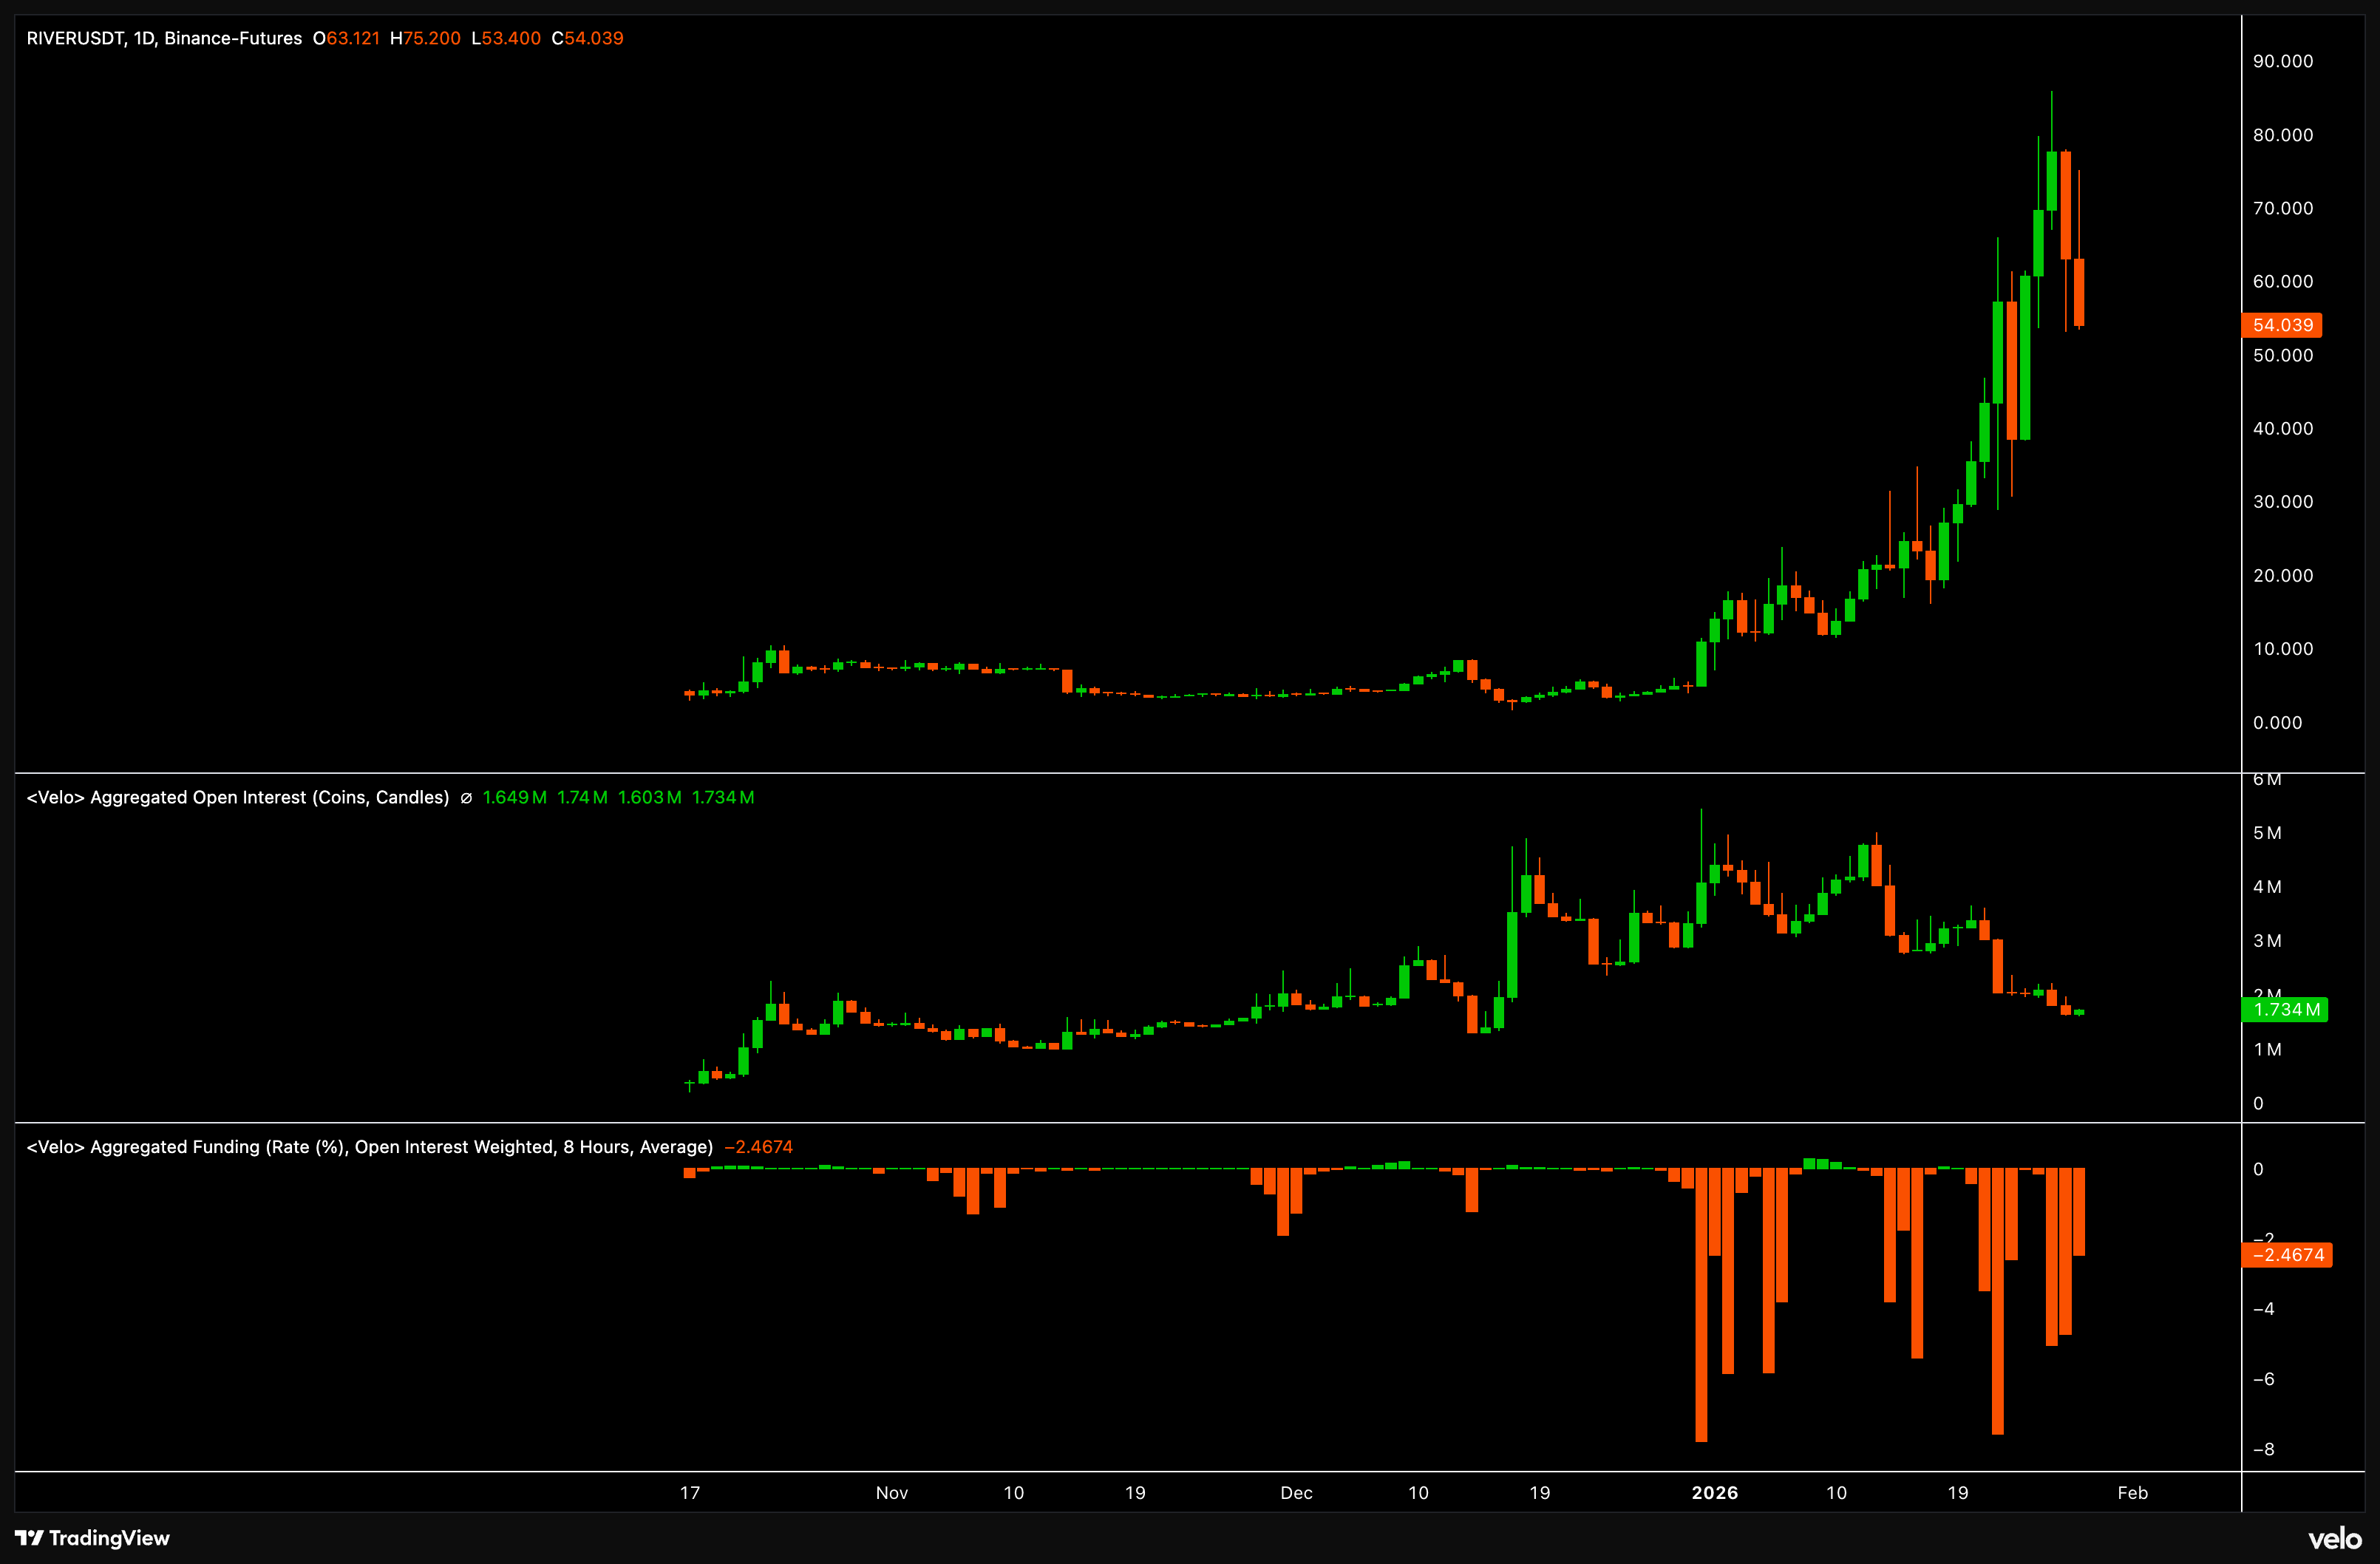
This is the market paying you to be long, which sounds attractive until you realize the token might drop 80% anyway. The funding income rarely compensates for the directional risk, but these trades are still worth exploring. If I am being honest, I do not really trade low market cap altcoins that much anymore.
But what I used to do a lot was look at these extremely negative funding rate flips very early on to try to find the next “scam pump”. At the end of the day, it does not really matter what causes funding to go extremely negative. What matters is seeing large open interest rise alongside negative funding.
This tells you that while perpetual traders are opening positions, the discount against spot persists. Someone is aggressively shorting perpetuals while spot buying happens elsewhere, often market makers hedging spot accumulation or insiders positioning before a move. You will often see this at the very early stages of these pumps, with price action still looking muted.
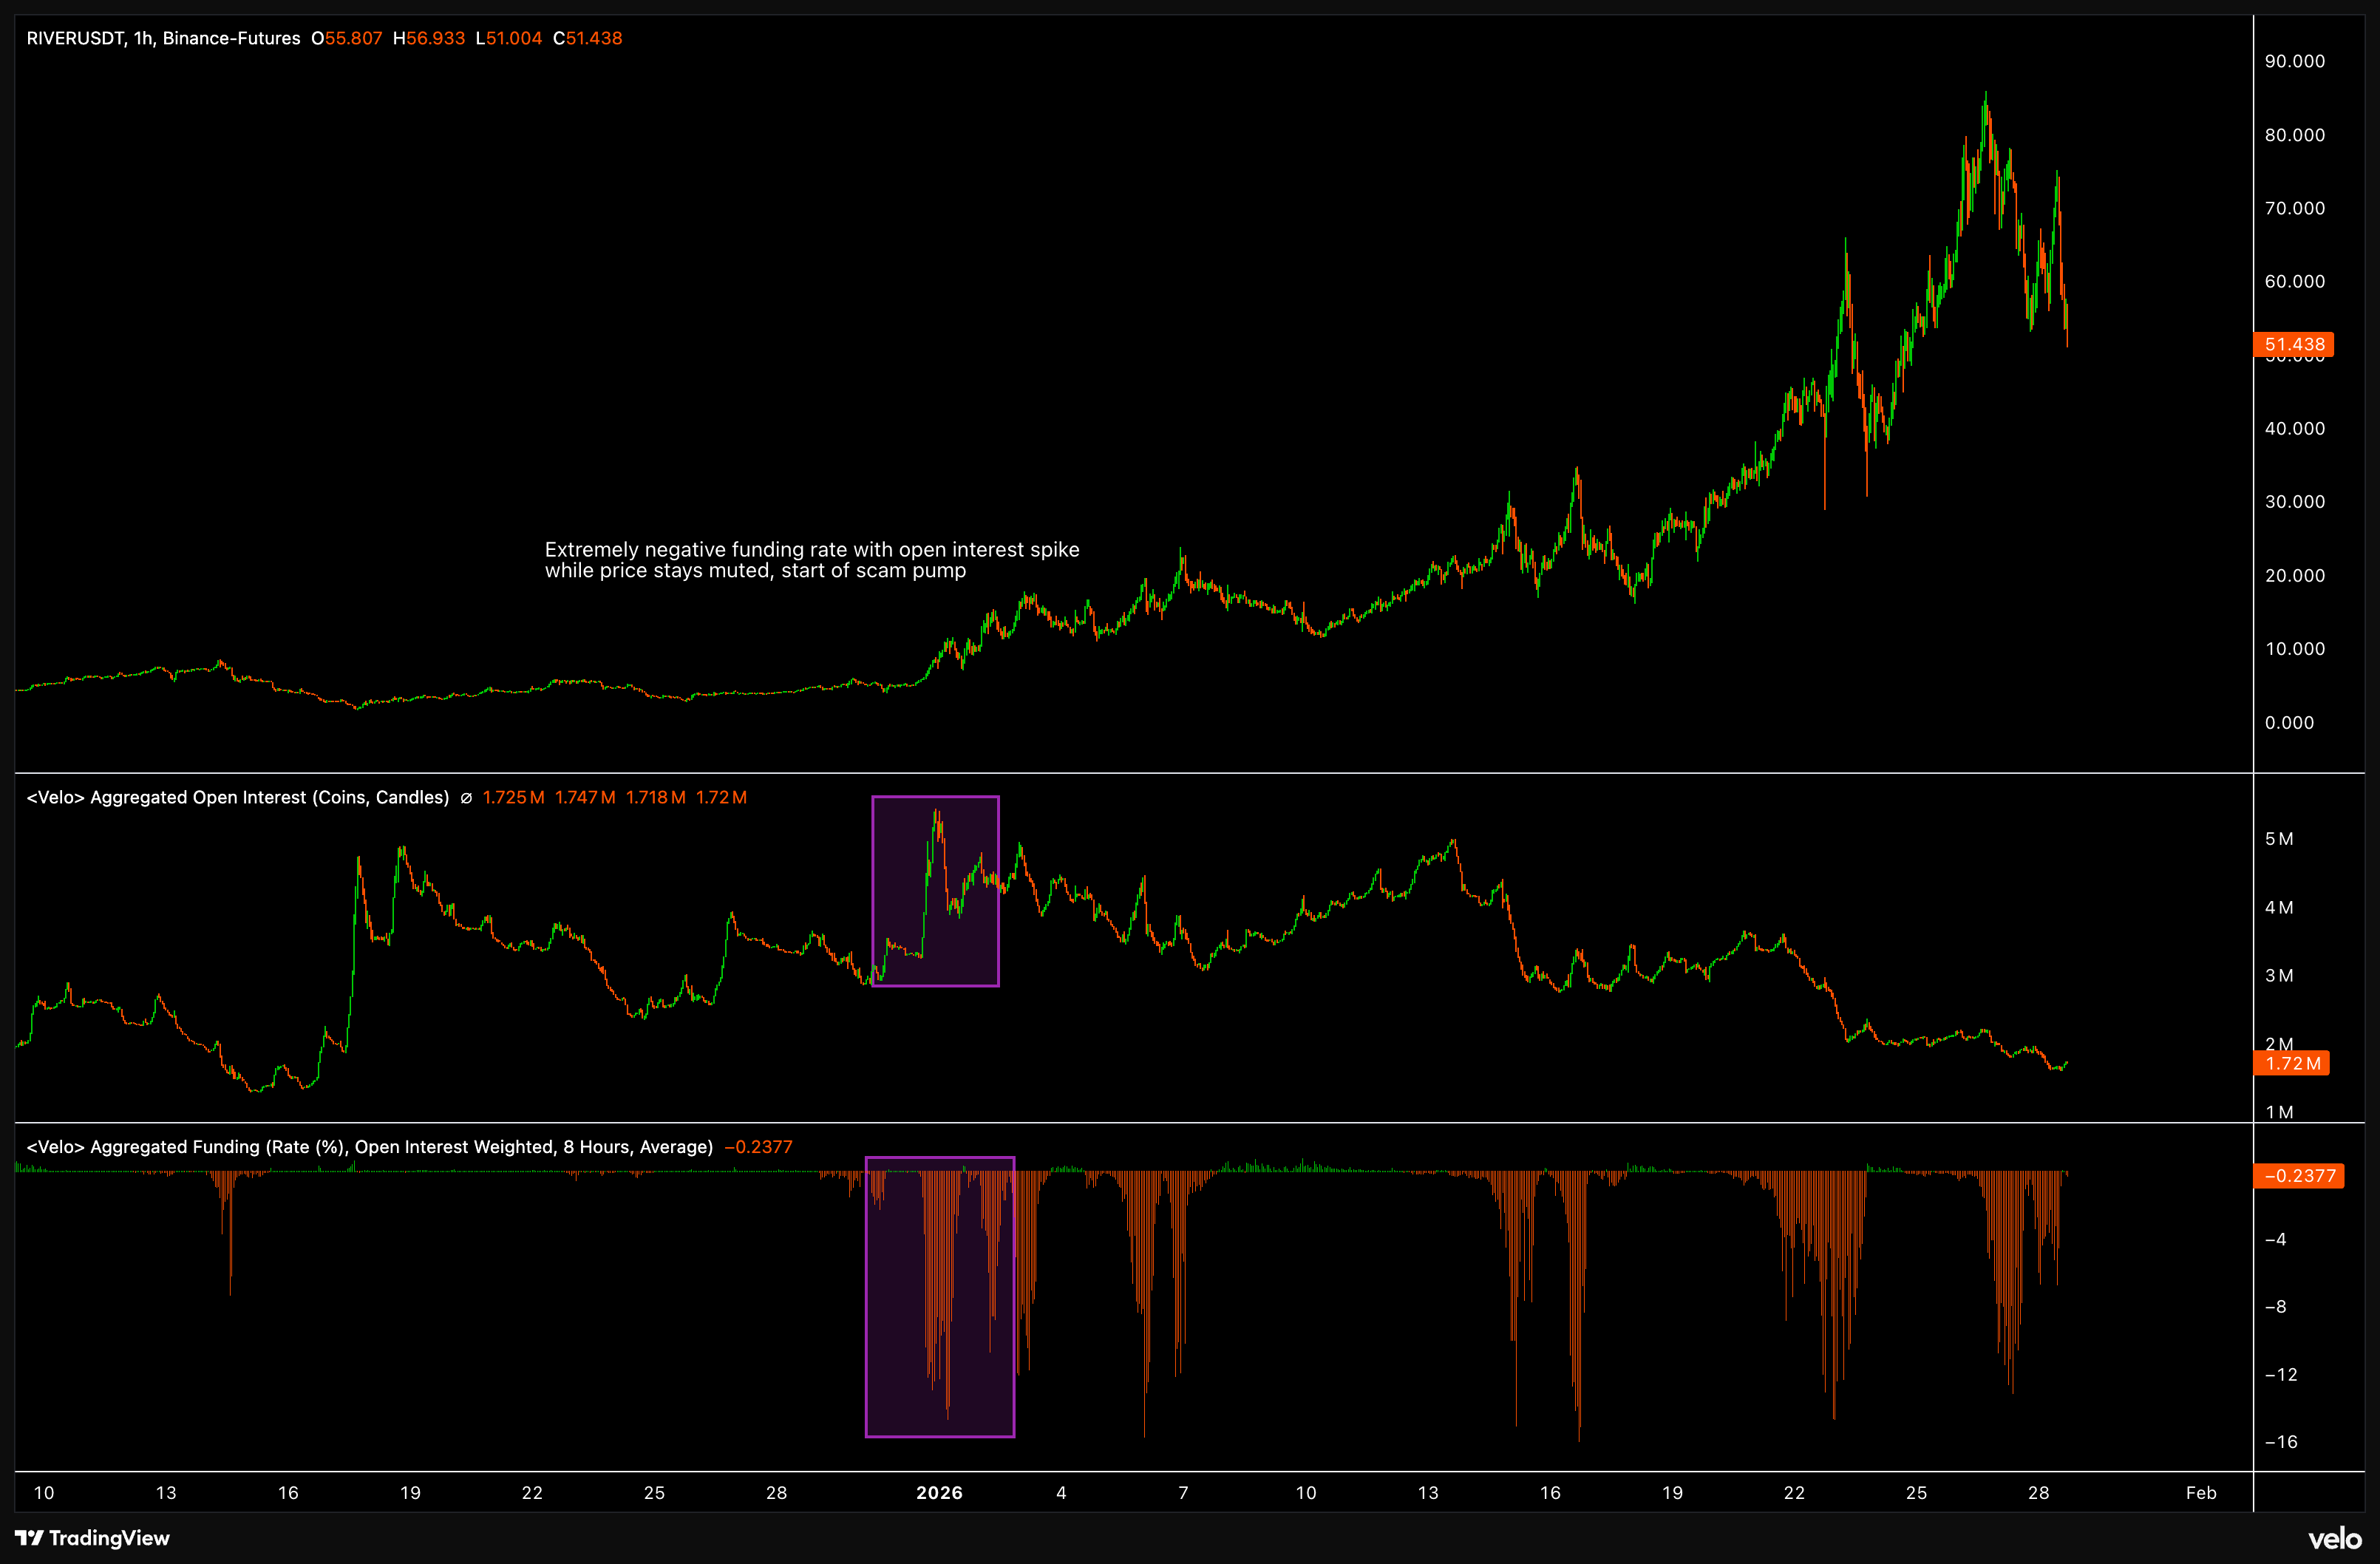
The chart of RIVER shows this pattern clearly: open interest spiked while funding went deeply negative, all while price barely moved. What followed was a multi-hundred percent rally.
While funding often stays negative even at the top, by the time prices are trading at several multiples of their daily ATR, you are already too late to enter. The edge is in spotting the setup early, when the data looks unusual but the price chart looks boring.
You can obviously also try to short the top, as these almost always dump back down. But I would argue that trade is extremely hard to time. At the highs the trade is already very crowded, you are paying funding on the short side, and the market can stay silly longer than you can stay solvent.
Order Book Data
Everything so far has been about perpetuals. While perpetuals obviously also have a order book data, the spot market is arguably the more important one, because the people moving real size in spot are the ones who can actually push price, while perps are where the leverage and the noise live.
Here crypto hands you another big advantage. Trade traditional futures like the ES or NQ and you see only a few levels of the book unless you pay up for full depth. Trade spot forex or a CFD and there is no visible book at all, since it is dealt over the counter. In crypto, the full depth of the book is standard and public on every major venue.
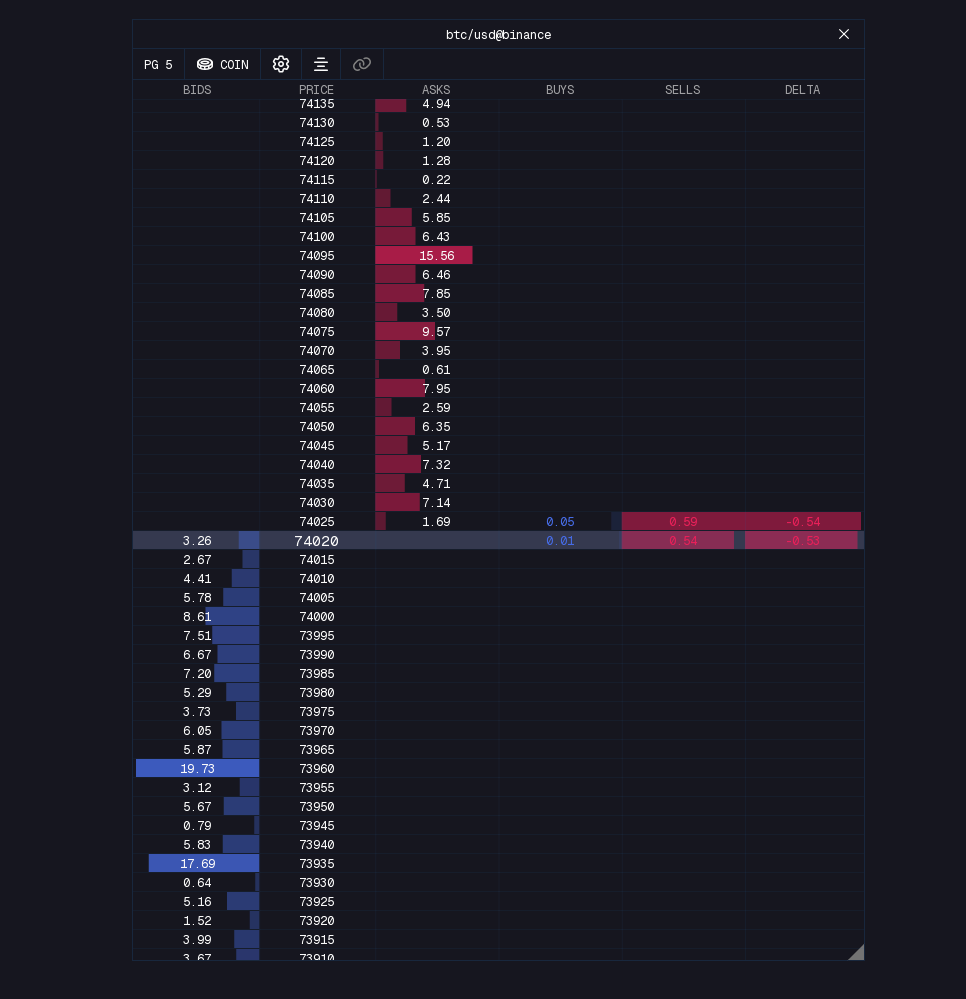
The order book, also called market depth or the DOM, is just the stack of resting limit orders, the passive liquidity sitting there waiting to be filled. Bids are orders to buy below the price, asks are orders to sell above it. Plot the same data on a chart with colour for size and you get a heatmap.
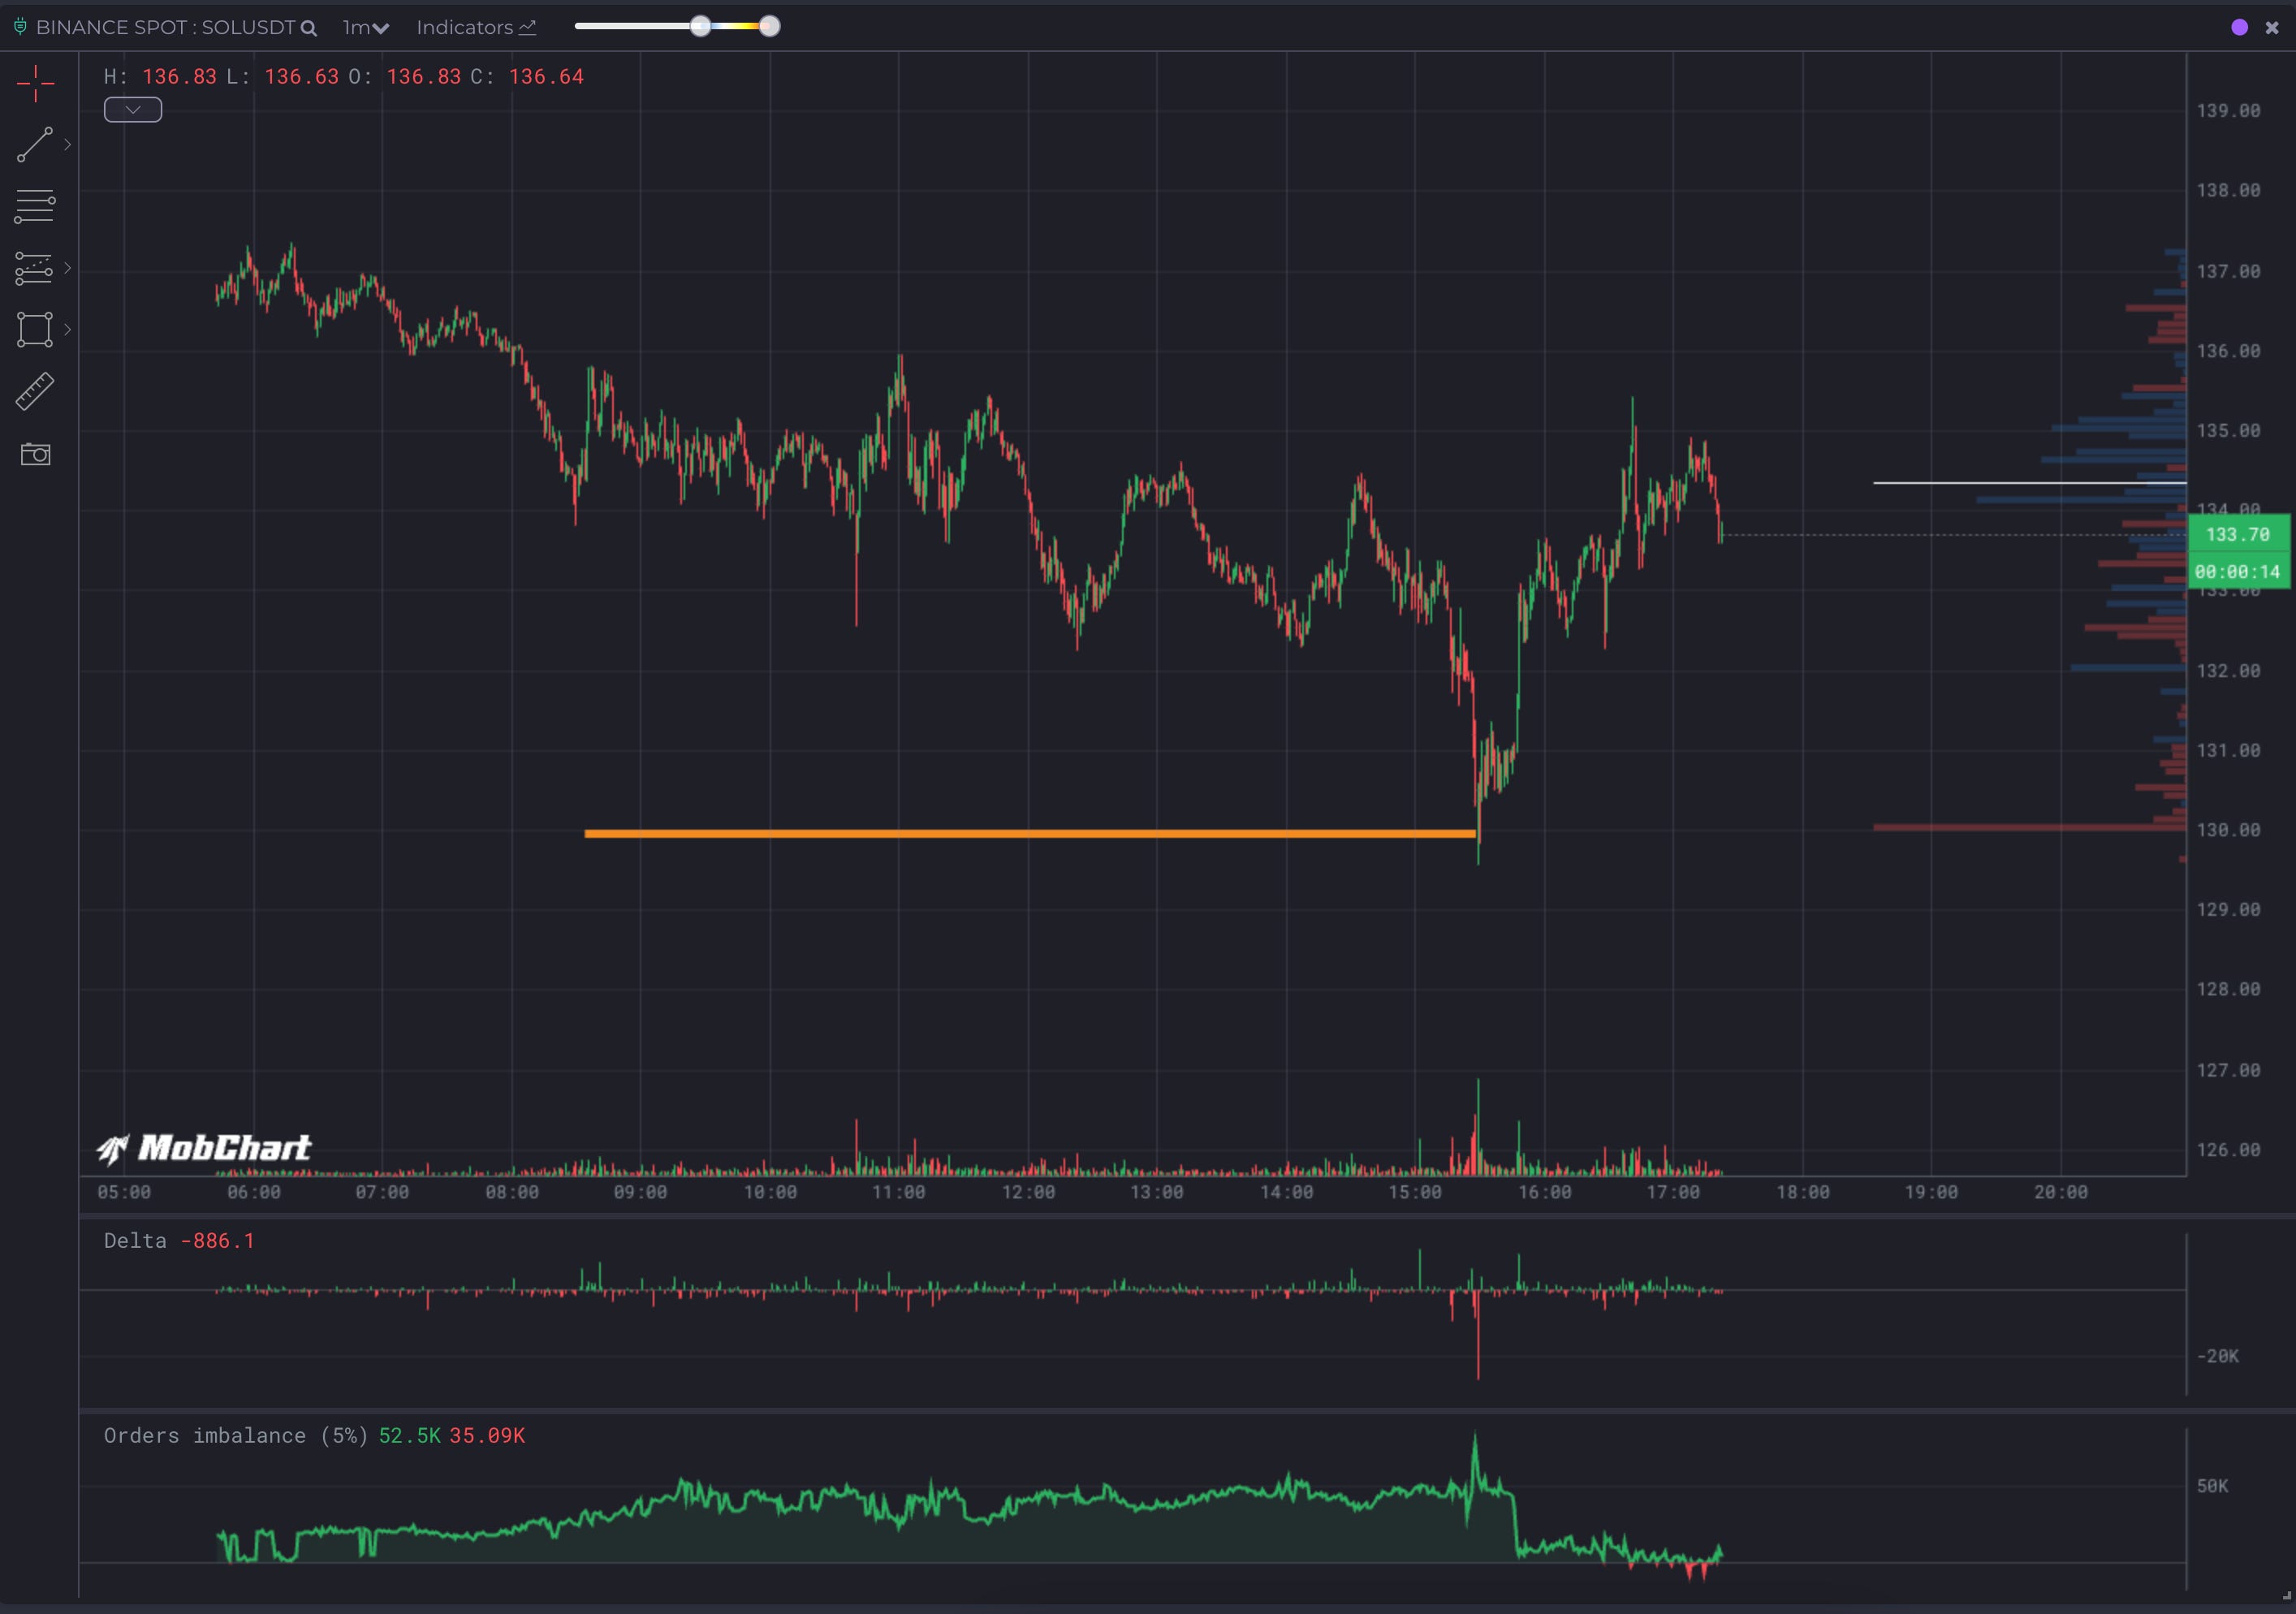
The catch is spoofing, placing orders you never intend to fill just to bait or scare other traders. It is rampant in crypto, and it is why reading single price levels off the book is a good way to get fooled. It is also where spot beats futures. Futures books are dominated by market makers quoting both sides to earn the spread, with no directional view, and the cheap leverage makes spoofing easy. To leave a large resting bid in the spot book you need the actual coins or cash behind it, so spot orders carry far more information about what real capital wants.
So you do not read individual orders. You read the shape. The number that matters is the skew, the imbalance between total bids and total asks within a band around price. A book with far more bids below than asks above is hard to push down, and the reverse is hard to push up. Heavy skew tends to mark range-bound conditions, or the early innings of a new trend where one side is quietly absorbing everything thrown at it.
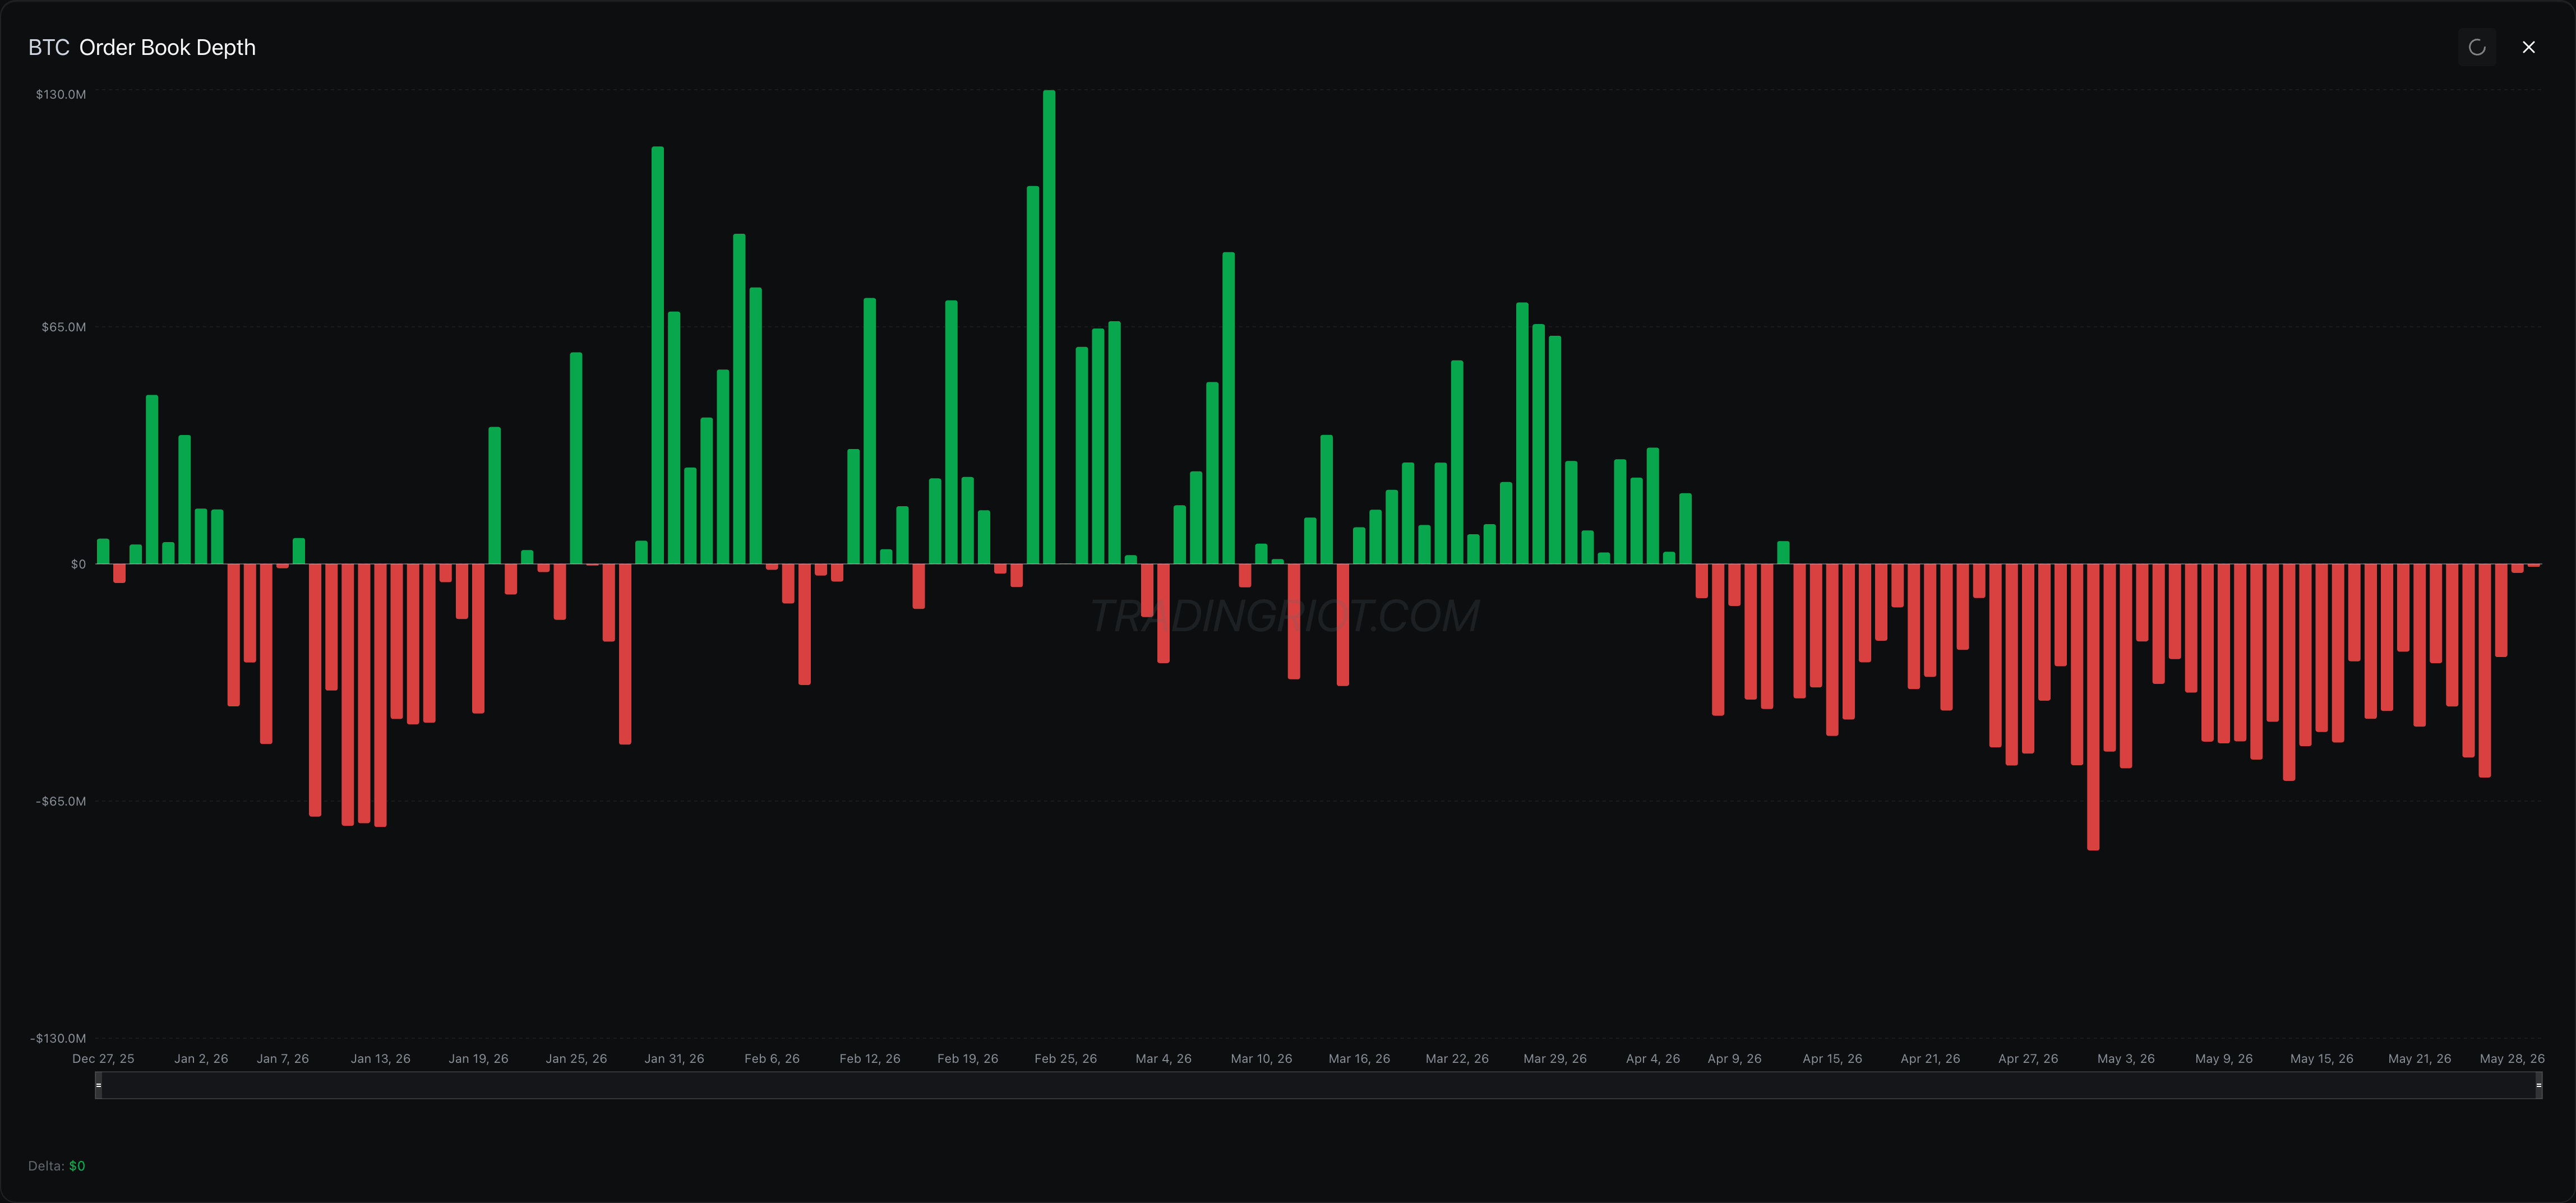
One honest limitation. Spot skew works best in ranges. In a strong trend, price chews straight through bids and asks and the skew tells you little. Spot players are also patient, so a book can stay lopsided far longer than a leveraged trader would ever expect before the mean-reverting move shows up. Treat it as confluence. It keeps you on the same side as the large spot participants and raises your conviction. It does not hand you an entry on its own.
Options Skew
Options finish the positioning picture. At the moment the options skew is only worth monitoring on Bitcoin and ETH as other markets dont have liquid options, but this might change in the future. Deribit is the crypto-native home for both and still clears more than 90% of ETH options flow. Bitcoin options are more contested now that listed and ETF products pulled real volume in through 2025, but Deribit is still the reference for the skew data we care about here. Everything else is too thin to bother with.
The single most useful read is the 25-delta risk reversal. Two terms first. Implied volatility is the market’s forward estimate of how much the asset will move, baked into the option’s price. Delta is how much an option’s price moves per one dollar move in the underlying, running from 0 to 1 for calls and 0 to -1 for puts. A 25-delta option sits moderately out of the money, far enough out to reflect real positioning, close enough to stay liquid. If you are scratching your head now, I wrote pretty long options primer here.
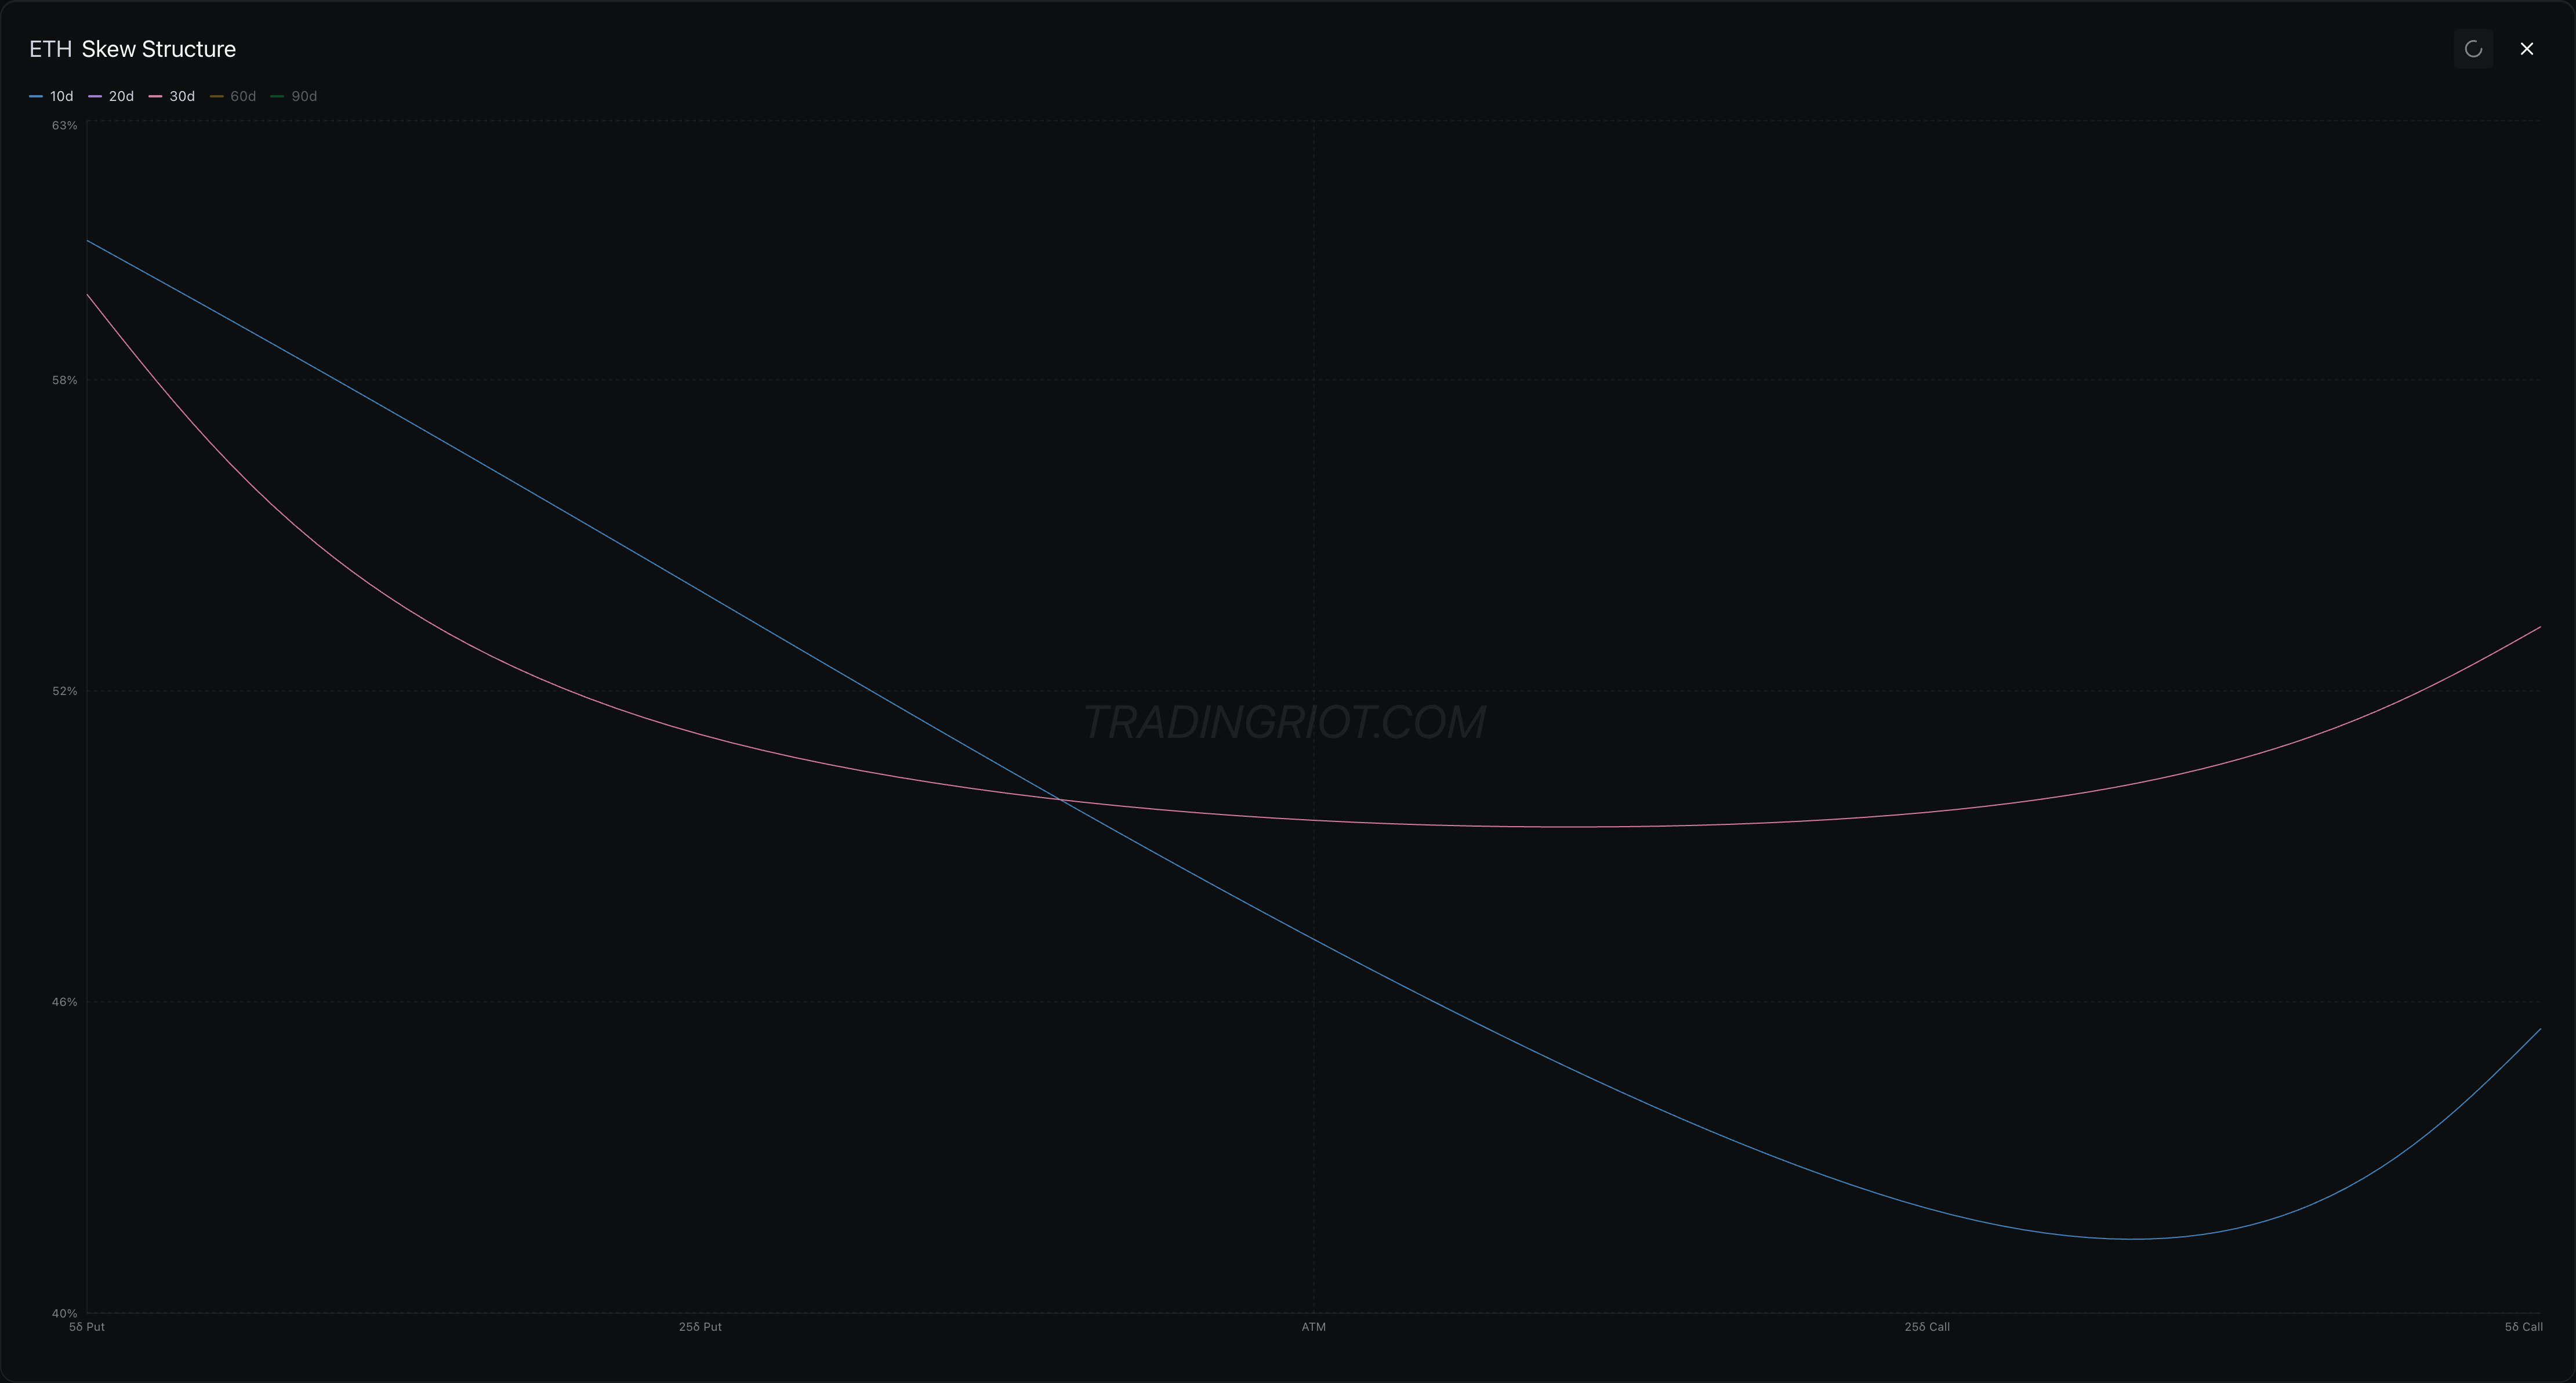
The risk reversal is the gap in implied volatility between the 25-delta call and the 25-delta put:
25Δ Risk Reversal = IV(25Δ Call) − IV(25Δ Put)When calls are bid up relative to puts, the risk reversal is positive and the market is paying up for upside. When puts are bid, it turns negative and the market is paying up for protection. You do not have to trade options to use this. The skew is one of the cleanest sentiment gauges available, a direct read on whether the market is more worried about missing the upside or getting hit on the downside.
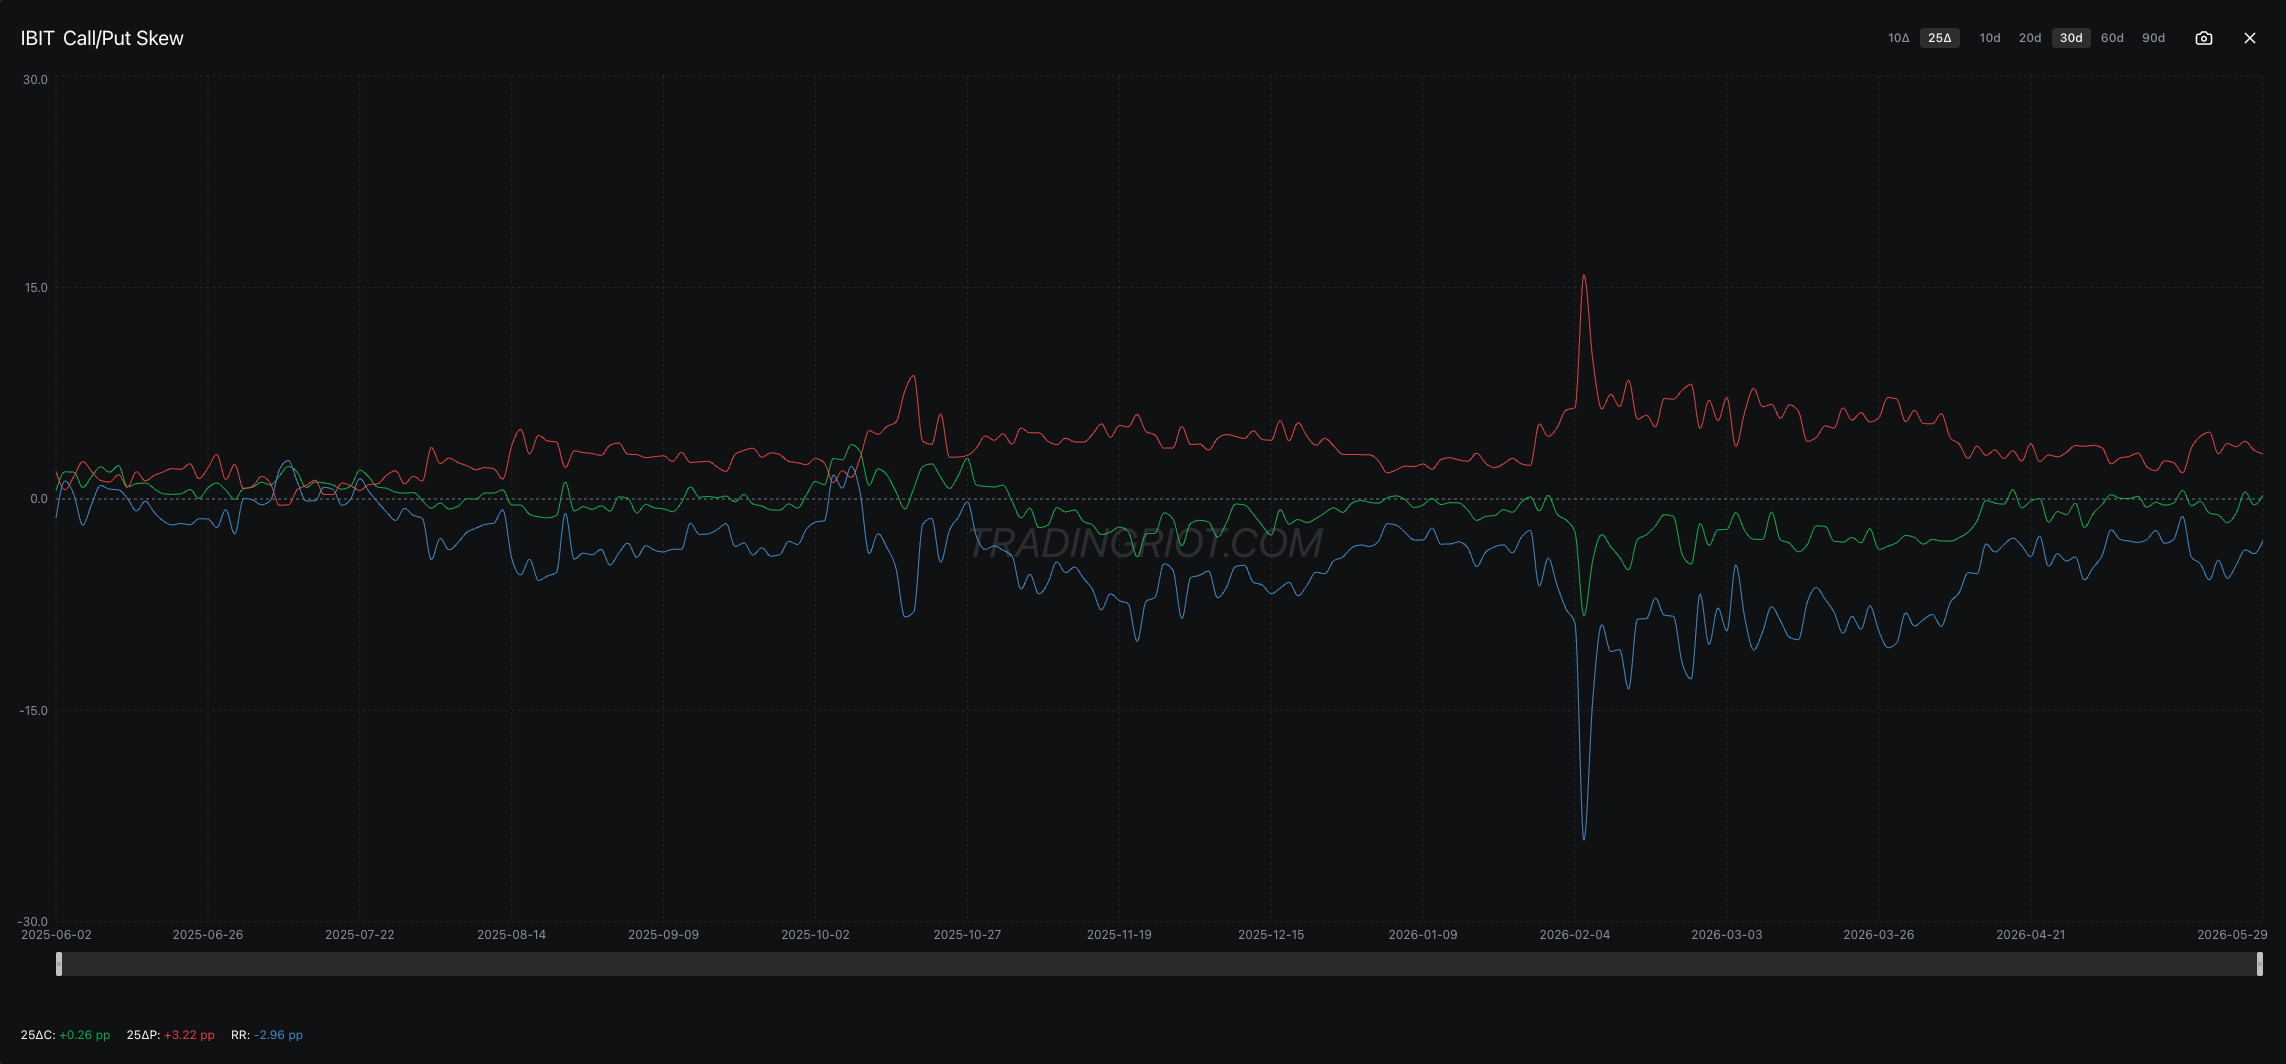
In crypto the edge has generally been in fading the extremes. When everyone is crammed into calls, the upside is already priced and the reward for chasing it is thin. When everyone is paying for puts, the fear is already in, and that tends to sit closer to reversal.
Finding Data-Driven Trades
Every tool in this guide shares one problem. The raw number is hard to judge. Is a 50 million dollar jump in open interest big? Is funding at minus 0.05% extreme? Is this skew reading stretched or normal? It depends entirely on the coin and on what normal The fix is to standardize, and the tool for that is the z-score. A z-score measures how far a current reading sits from its own recent average, counted in standard deviations:
Z-Score = (Current Value − Average) / Standard DeviationA z-score of 0 is an average. A z-score of +2 is two standard deviations above average, which on a normal distribution is roughly the top 2.5% of all readings. The bigger the number, in either direction, the more unusual the reading.
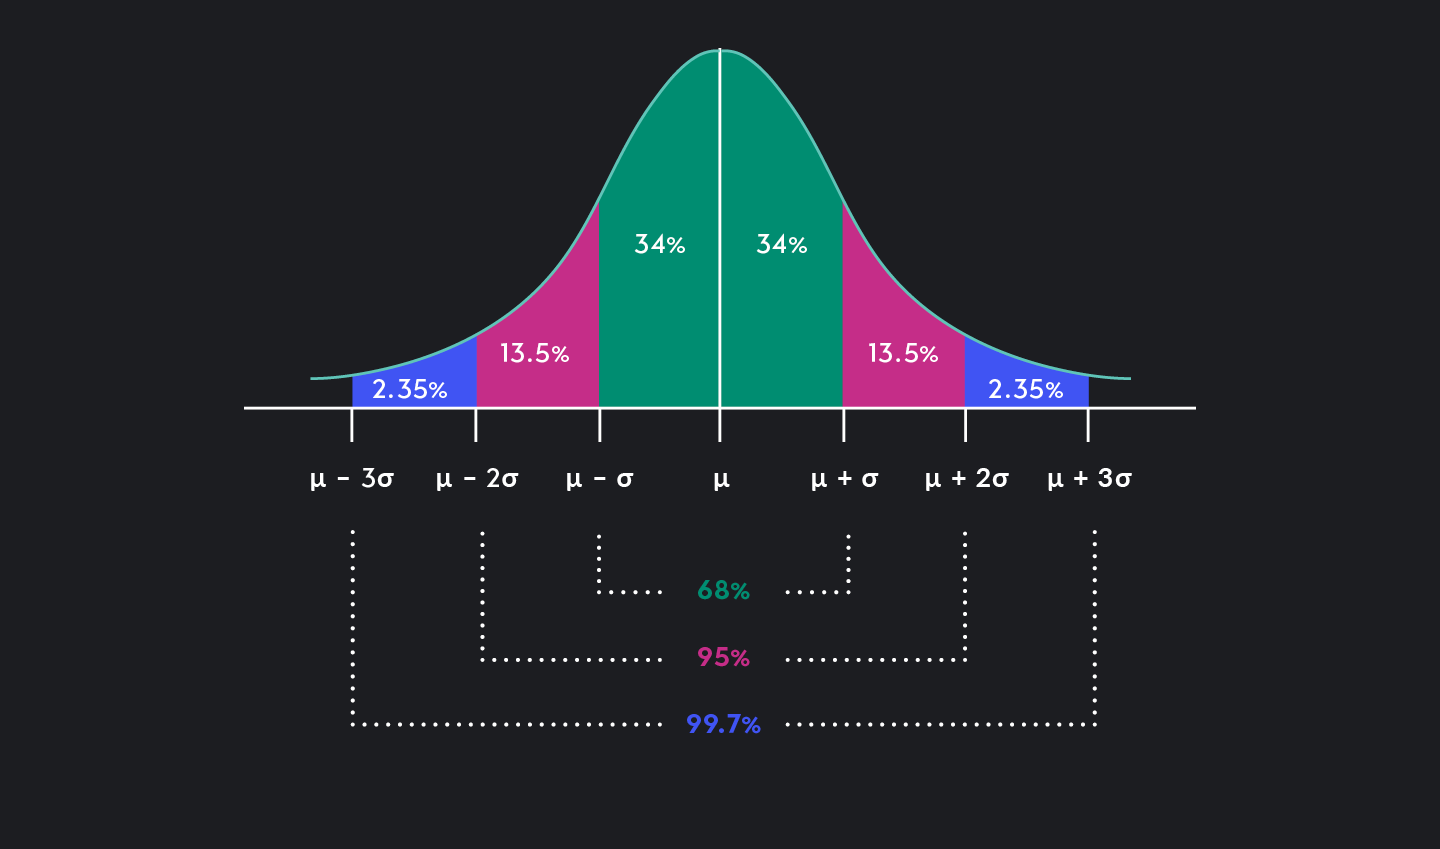
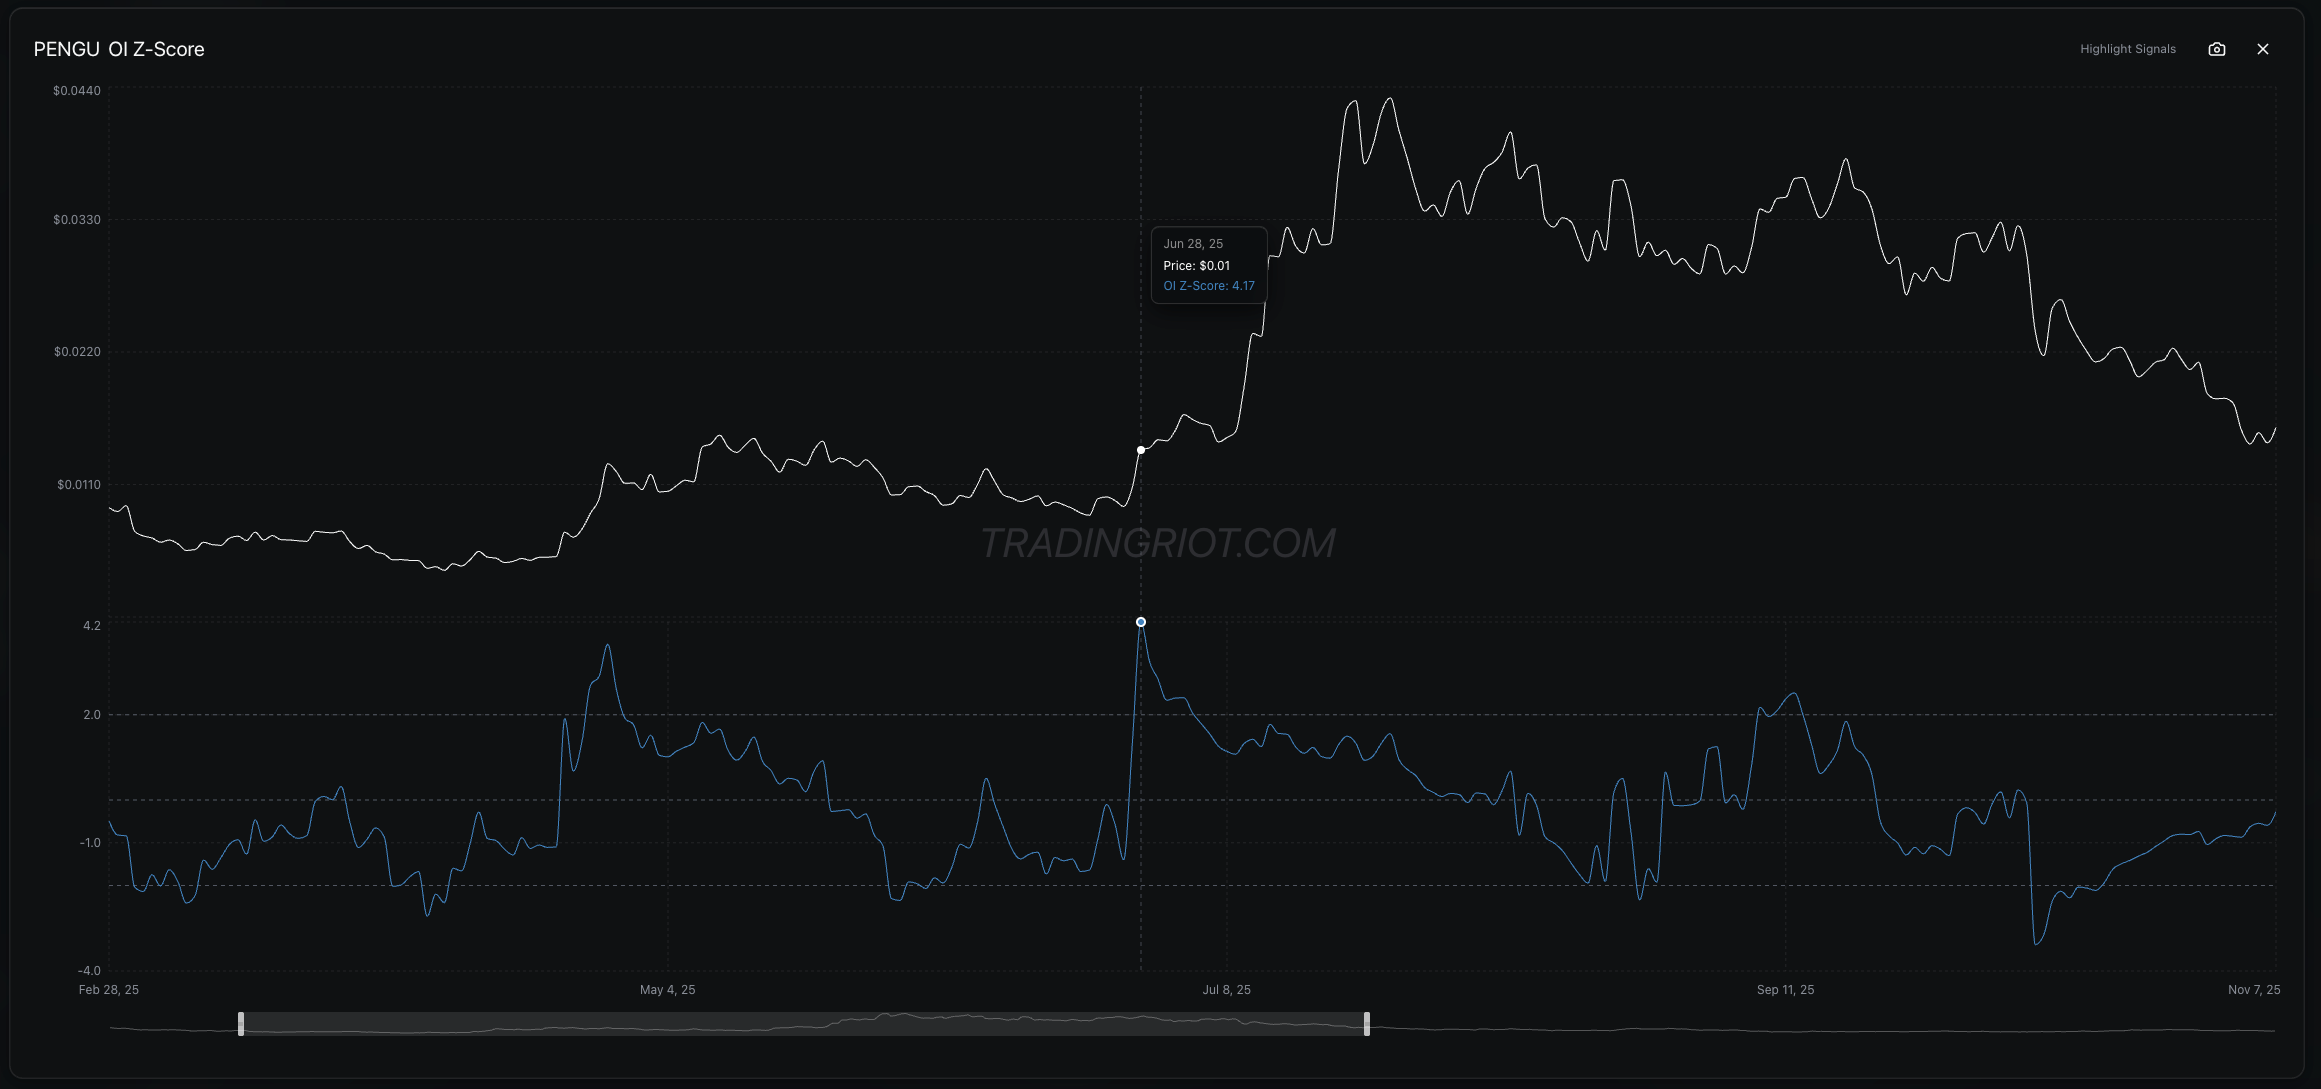
Why that matters is it makes everything comparable. A +2 on PENGU open interest and a +2 on Bitcoin open interest mean the same thing, positioning stretched two standard deviations past normal for that coin, even though the raw dollar figures are worlds apart. It turns "that looks like a lot" into something you can measure and rank, across coins and across metrics, on one scale.
The score is calculated over a rolling window, so it always judges the current reading against the coin's recent behaviour rather than ancient history. That keeps it useful as a market's character changes.
If you remember the PENGU example from earlier, this is exactly how you could get notified about the trade opportunity by looking for statistical extremes.
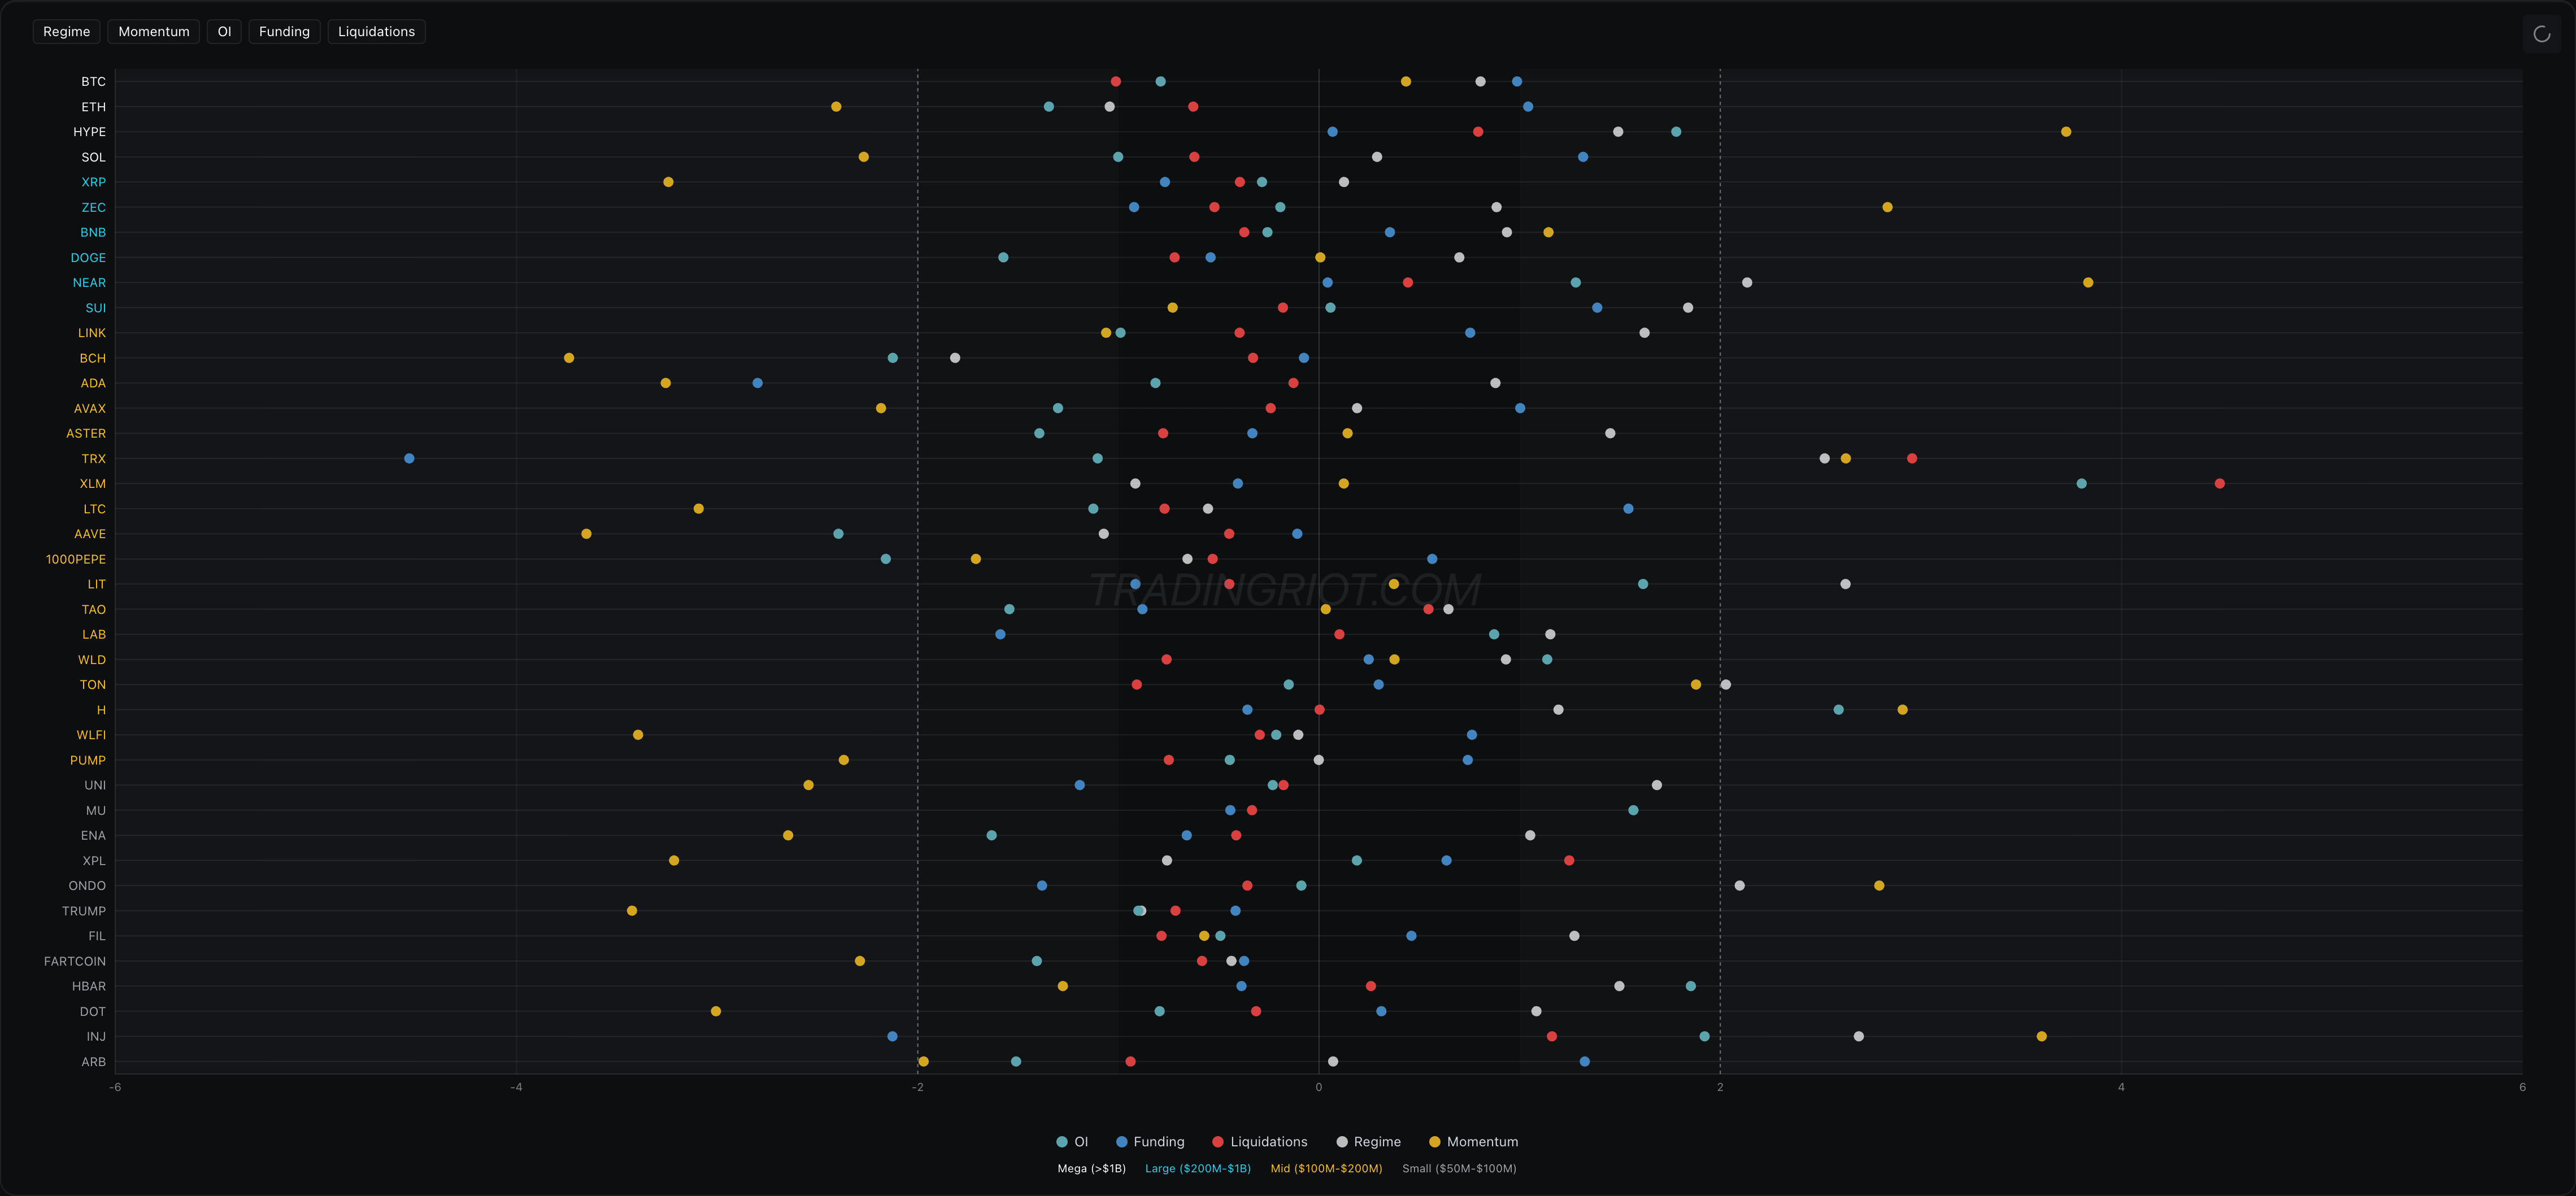
This is the engine under TradingRiot Analytics. Open interest, funding, and liquidations each carry a rolling z-score and percentile rank. The spot order book skew has one. The options risk reversal has one. And a screener ranks the entire market by these extremes every day, so instead of flipping through 150 charts you get handed the handful of coins where positioning is actually stretched. The chart below shows the “lens” view displaying different extremes for range of metrics.
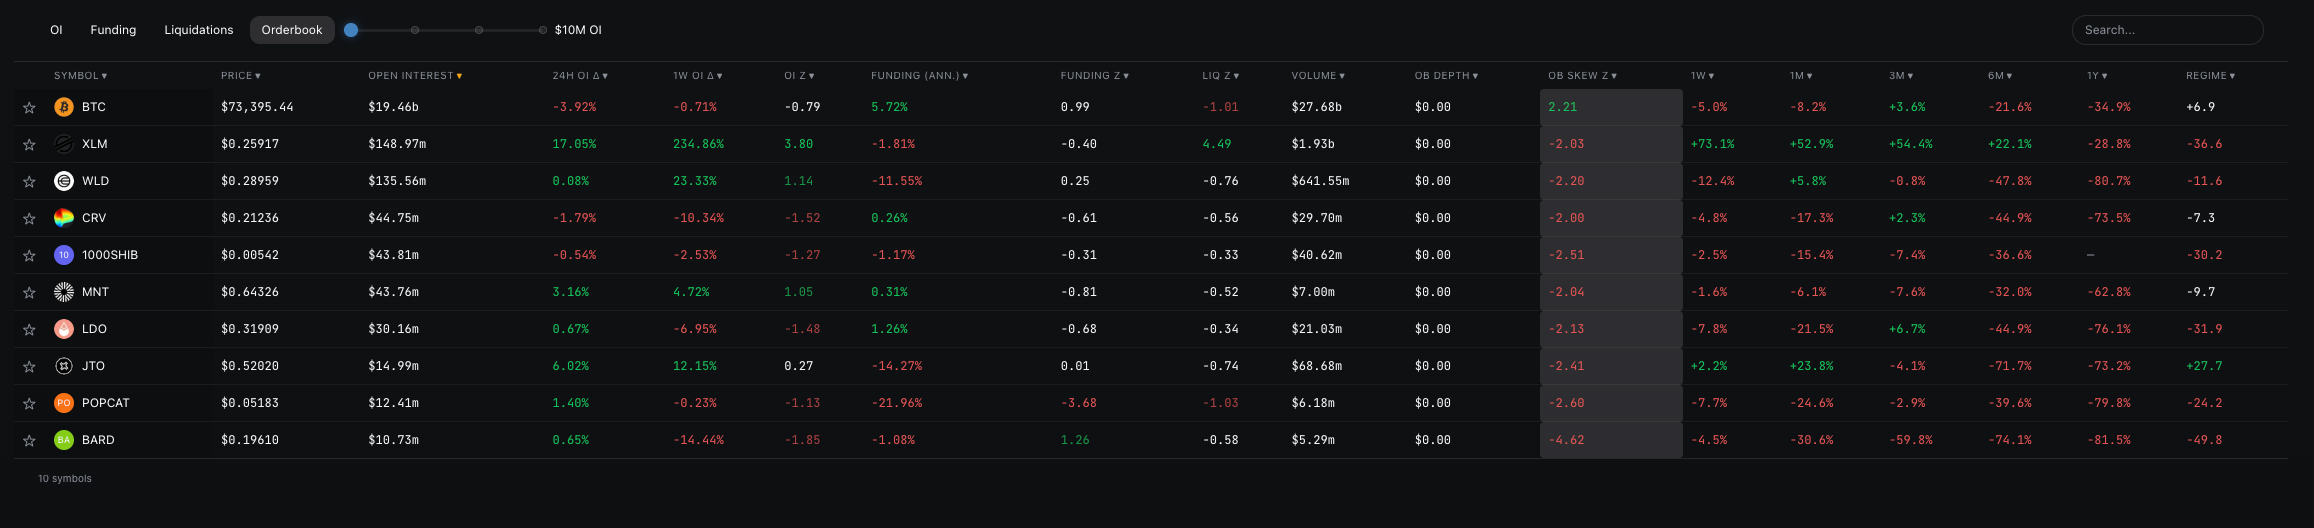
Besides that, the classic screener view allows you to choose metrics you are interested in.
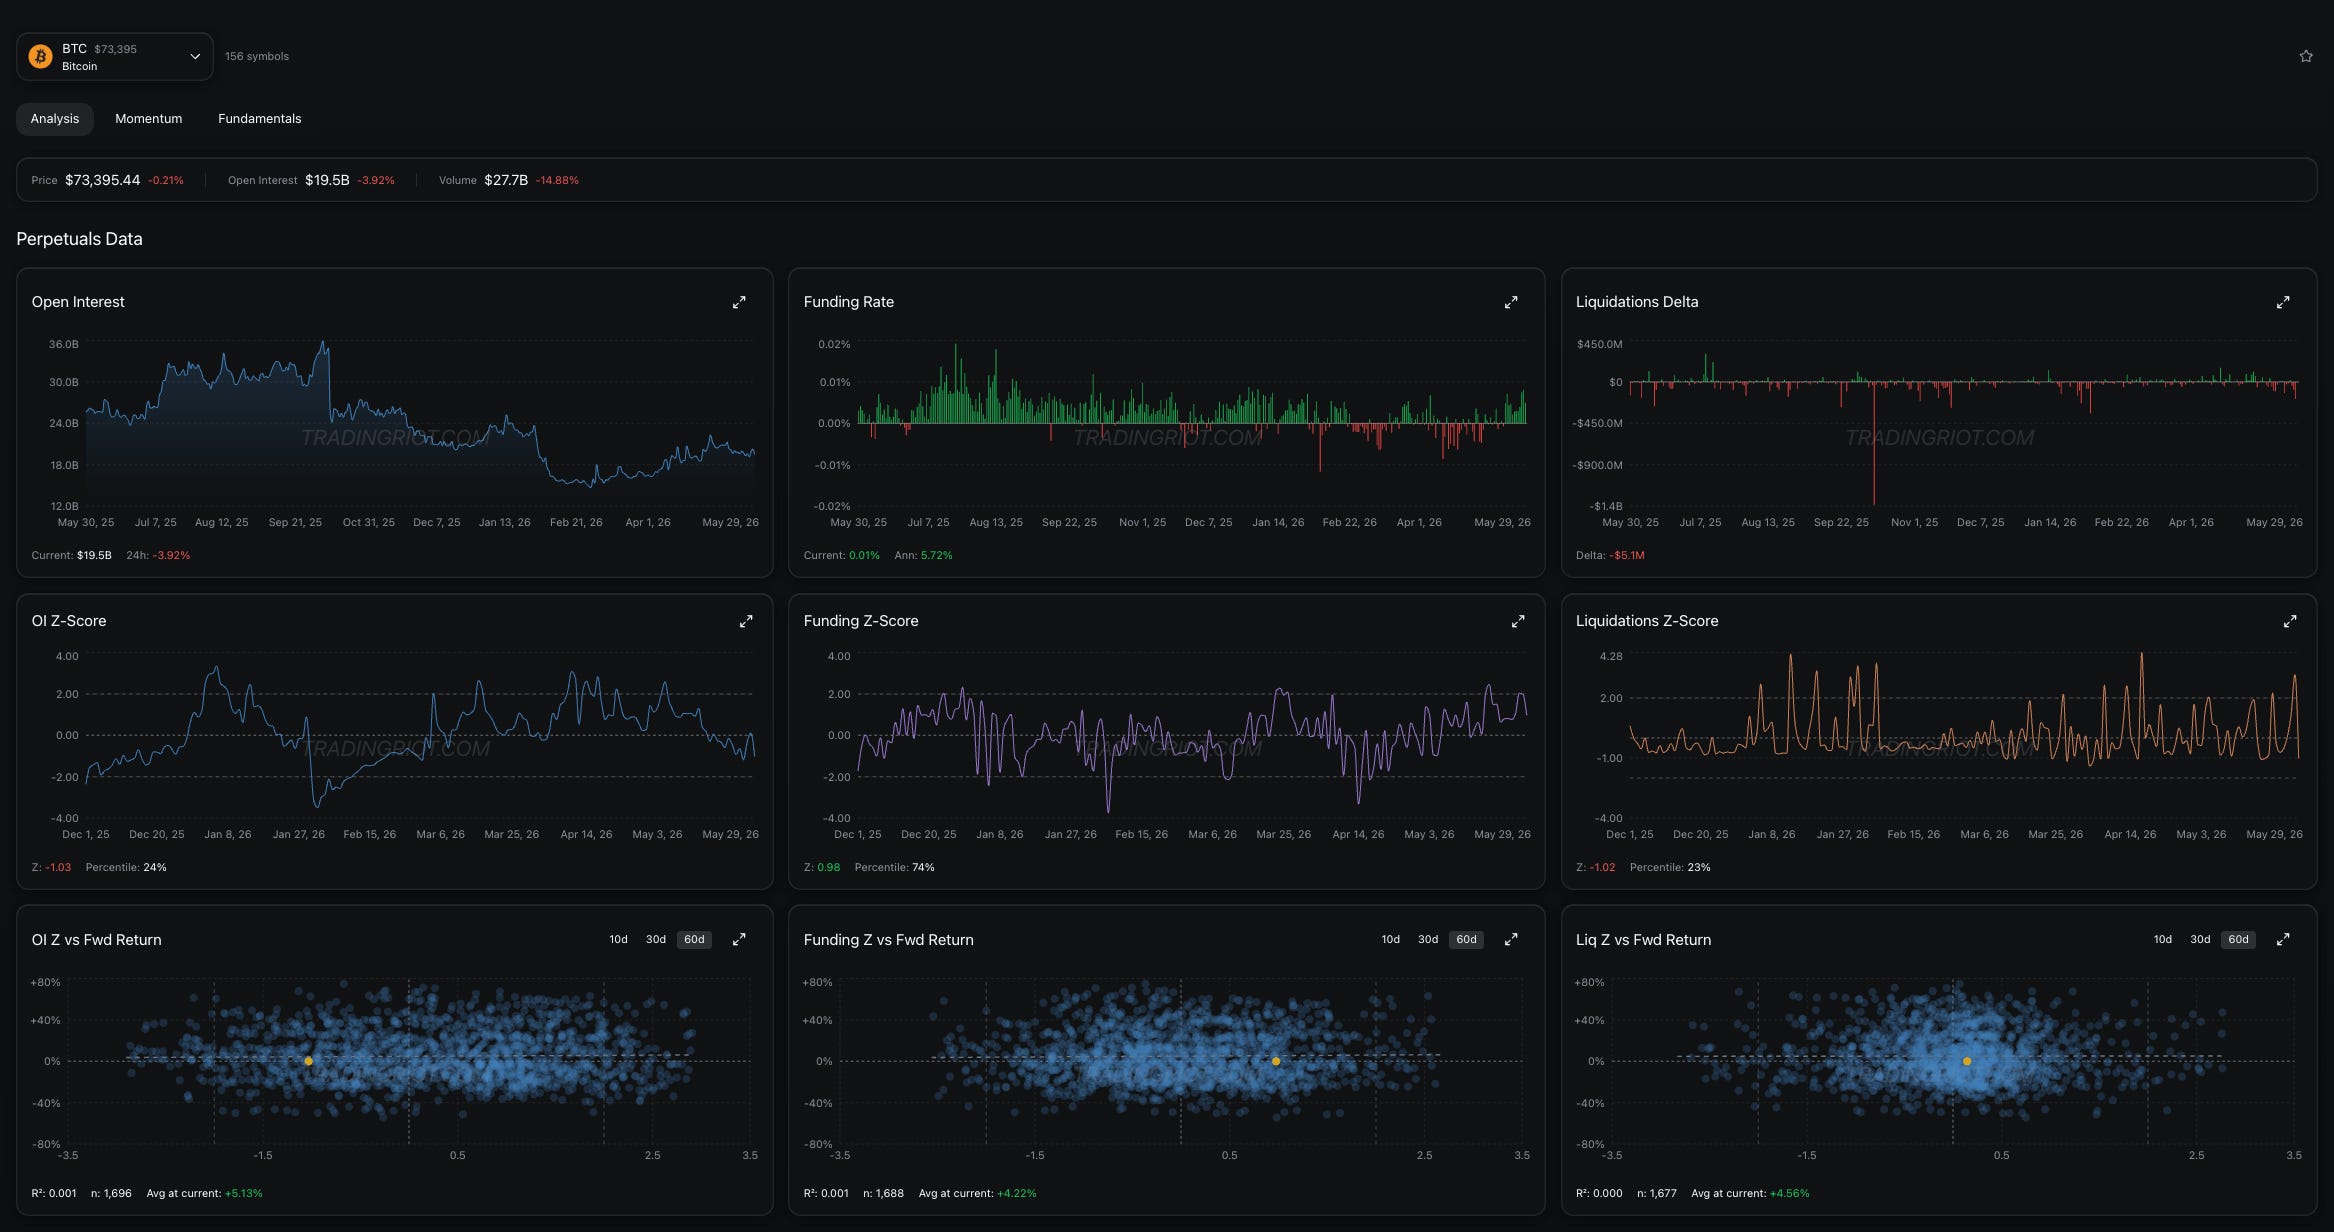
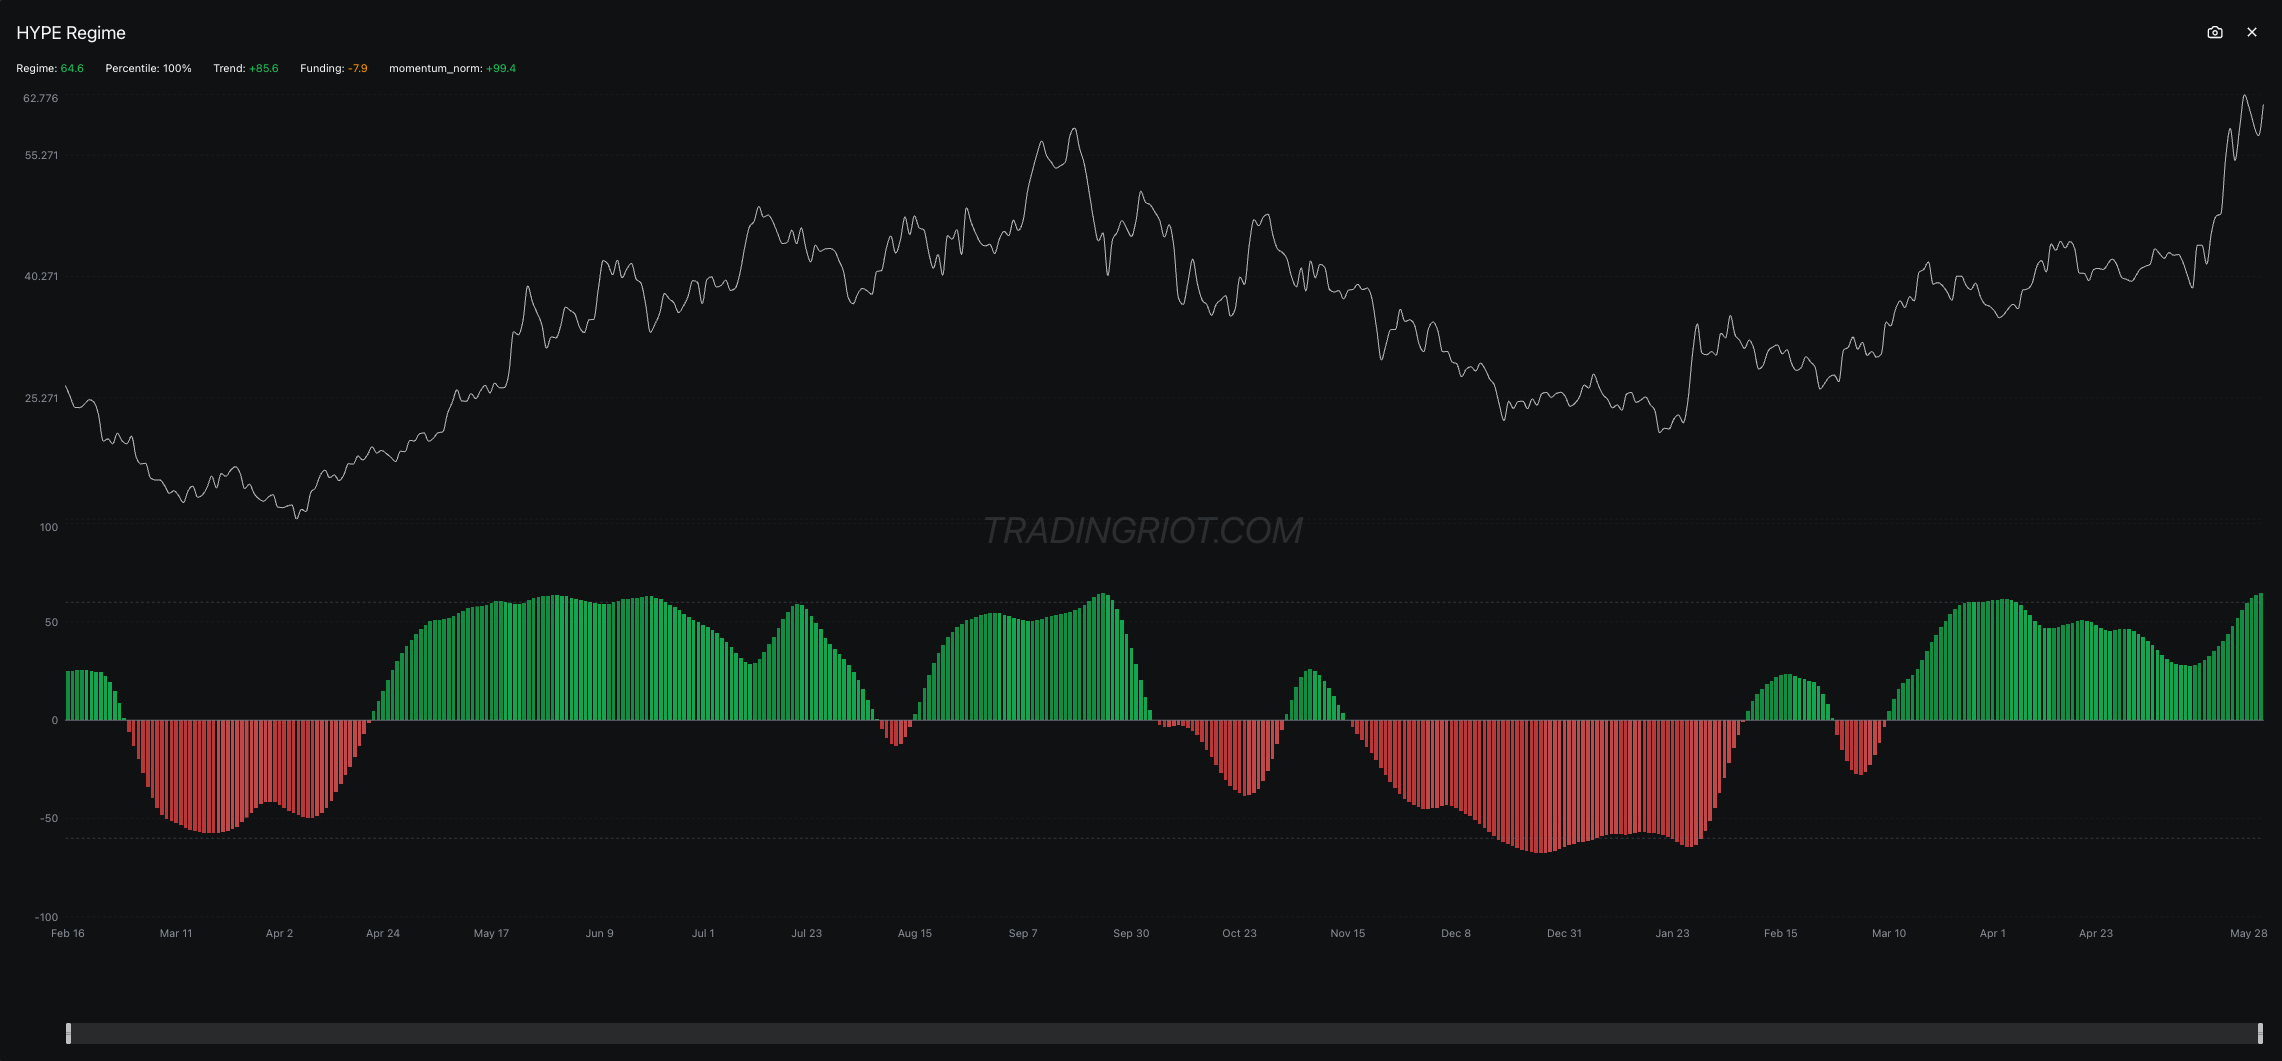
Each market has then its own deep-dive with raw data, z-scores and forward returns, each asset also has a proprietary regime indicator that combines these metrics into one indicator showing the strength of each move.
Conclusion
Crypto is a great asset class to trade. It offers a range of opportunities against less sophisticated competition.
While you can stick to simple technical analysis and probably still find some success, there is large benefit in looking in the derivatives data.
None of these tools is a buy or sell button on its own. The market usually takes its time before it moves, so you still lean on simple structure to time the entry. Most days the data just keeps you out of bad trades.
The one worth waiting for is the trade where everything lines up. When the derivatives data, the spot book, and the options skew all point the same way, that is rare, and it is where you size up and trade with real conviction instead of just drawing lines on chart that are all look the same.
Really appreciate it 🙏
The most insightful, detailed and supphisticated cryptocurrency trading article I've ever read! God bless you brother🙇❤️