
This Strategy Outperforms the Stock Market With 15 Minutes of Trading Per Week
Detailed guide on harvesting two risk premiums for 18% CAGR, 78% win rate and 15 minutes a week.

There have been so many of these articles lately. Especially after AI blew up, people are sharing absolute slop in the form of different strategies and bots that mostly revolve around either trading or prediction markets (which is also trading, just with a few extra mental gymnastics).
So what I figured I’d do, something that felt like a nice breath of fresh air, is share one of the strategies I actively trade. One that has actually been profitable, with the data and reasoning to back up why it works.
In this article, I will take you step by step through the whole process: why the strategy actually makes money, why it sucks, and what you can expect from running it.
While this article won’t be hidden behind any paywalls, I will be using data from my website at https://www.tradingriot.com/. There you will also find the exact screener to get markets to trade each week and a position size calculator for optimal betting. If you want to give it a try, you can use code “ANALYTICS” for 50% off your first month.
Risk Premium
Usually a lot of these articles start by giving you some insane hooks about how much alpha you will find in the text. This won’t be one of them.
The reason I am sharing this strategy in the first place is exactly that: there is no alpha in this.
While people who use the word alpha online usually don’t understand what alpha is in the first place, alpha strategies are extremely scarce. They don’t last long and everyone who has any actual alpha keeps it for themselves for a reason.
This strategy is simply a fairly basic risk premium.
I wrote a longer article about risk premium already, so go ahead and read that if you haven’t. I don’t want to spend too much time explaining myself here, but in short, risk premium is compensation for bearing risk others don’t want to hold.
This strategy in particular is harvesting two different risk premium at once.
Equities risk premium
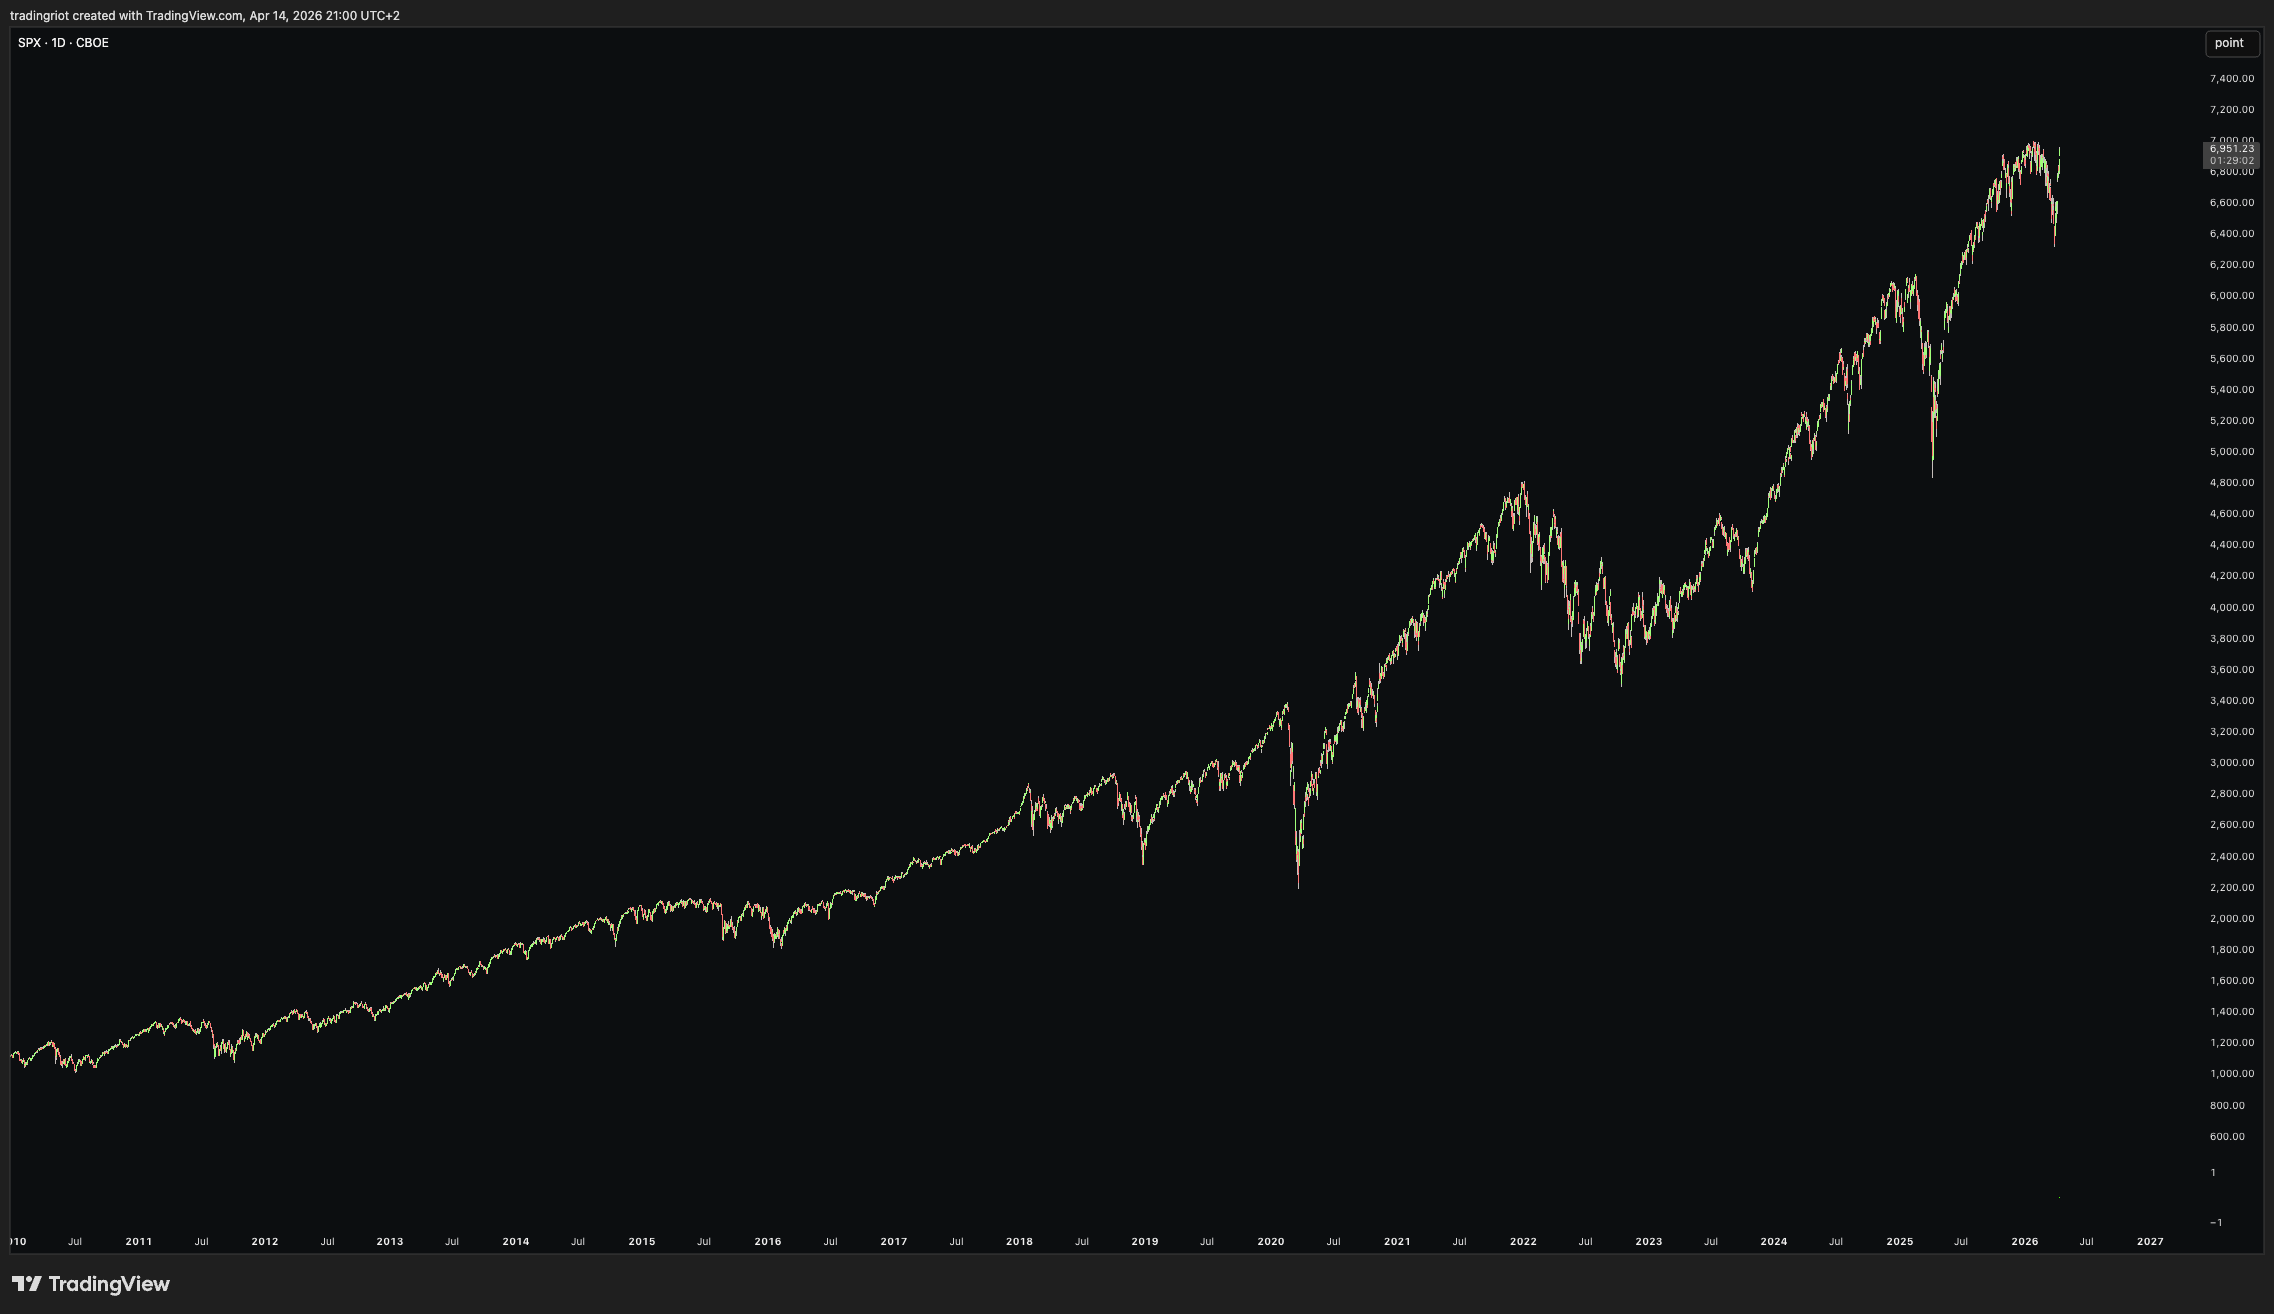
TLDR here is stonks go up.
The longer version: stocks have a built-in positive drift over time. People who park their money in equities are sitting with real risk, and they expect to get paid for it.
Historically that payment has worked out to roughly 4-6% annually on top of whatever the risk-free rate is.
This is obviously not a secret. Academics have picked it apart for decades. Yet it keeps paying out. Why? Because the discomfort of owning something that can drop 30% in a month never goes away.
That fear is real and the reason why you are getting paid
Variance risk premium
This one is slightly more complicated but equally important for understanding why you’re getting paid.
Variance risk premium is the difference between implied and realized volatility. In other words, it’s what the market thinks is going to happen versus what actually happened.
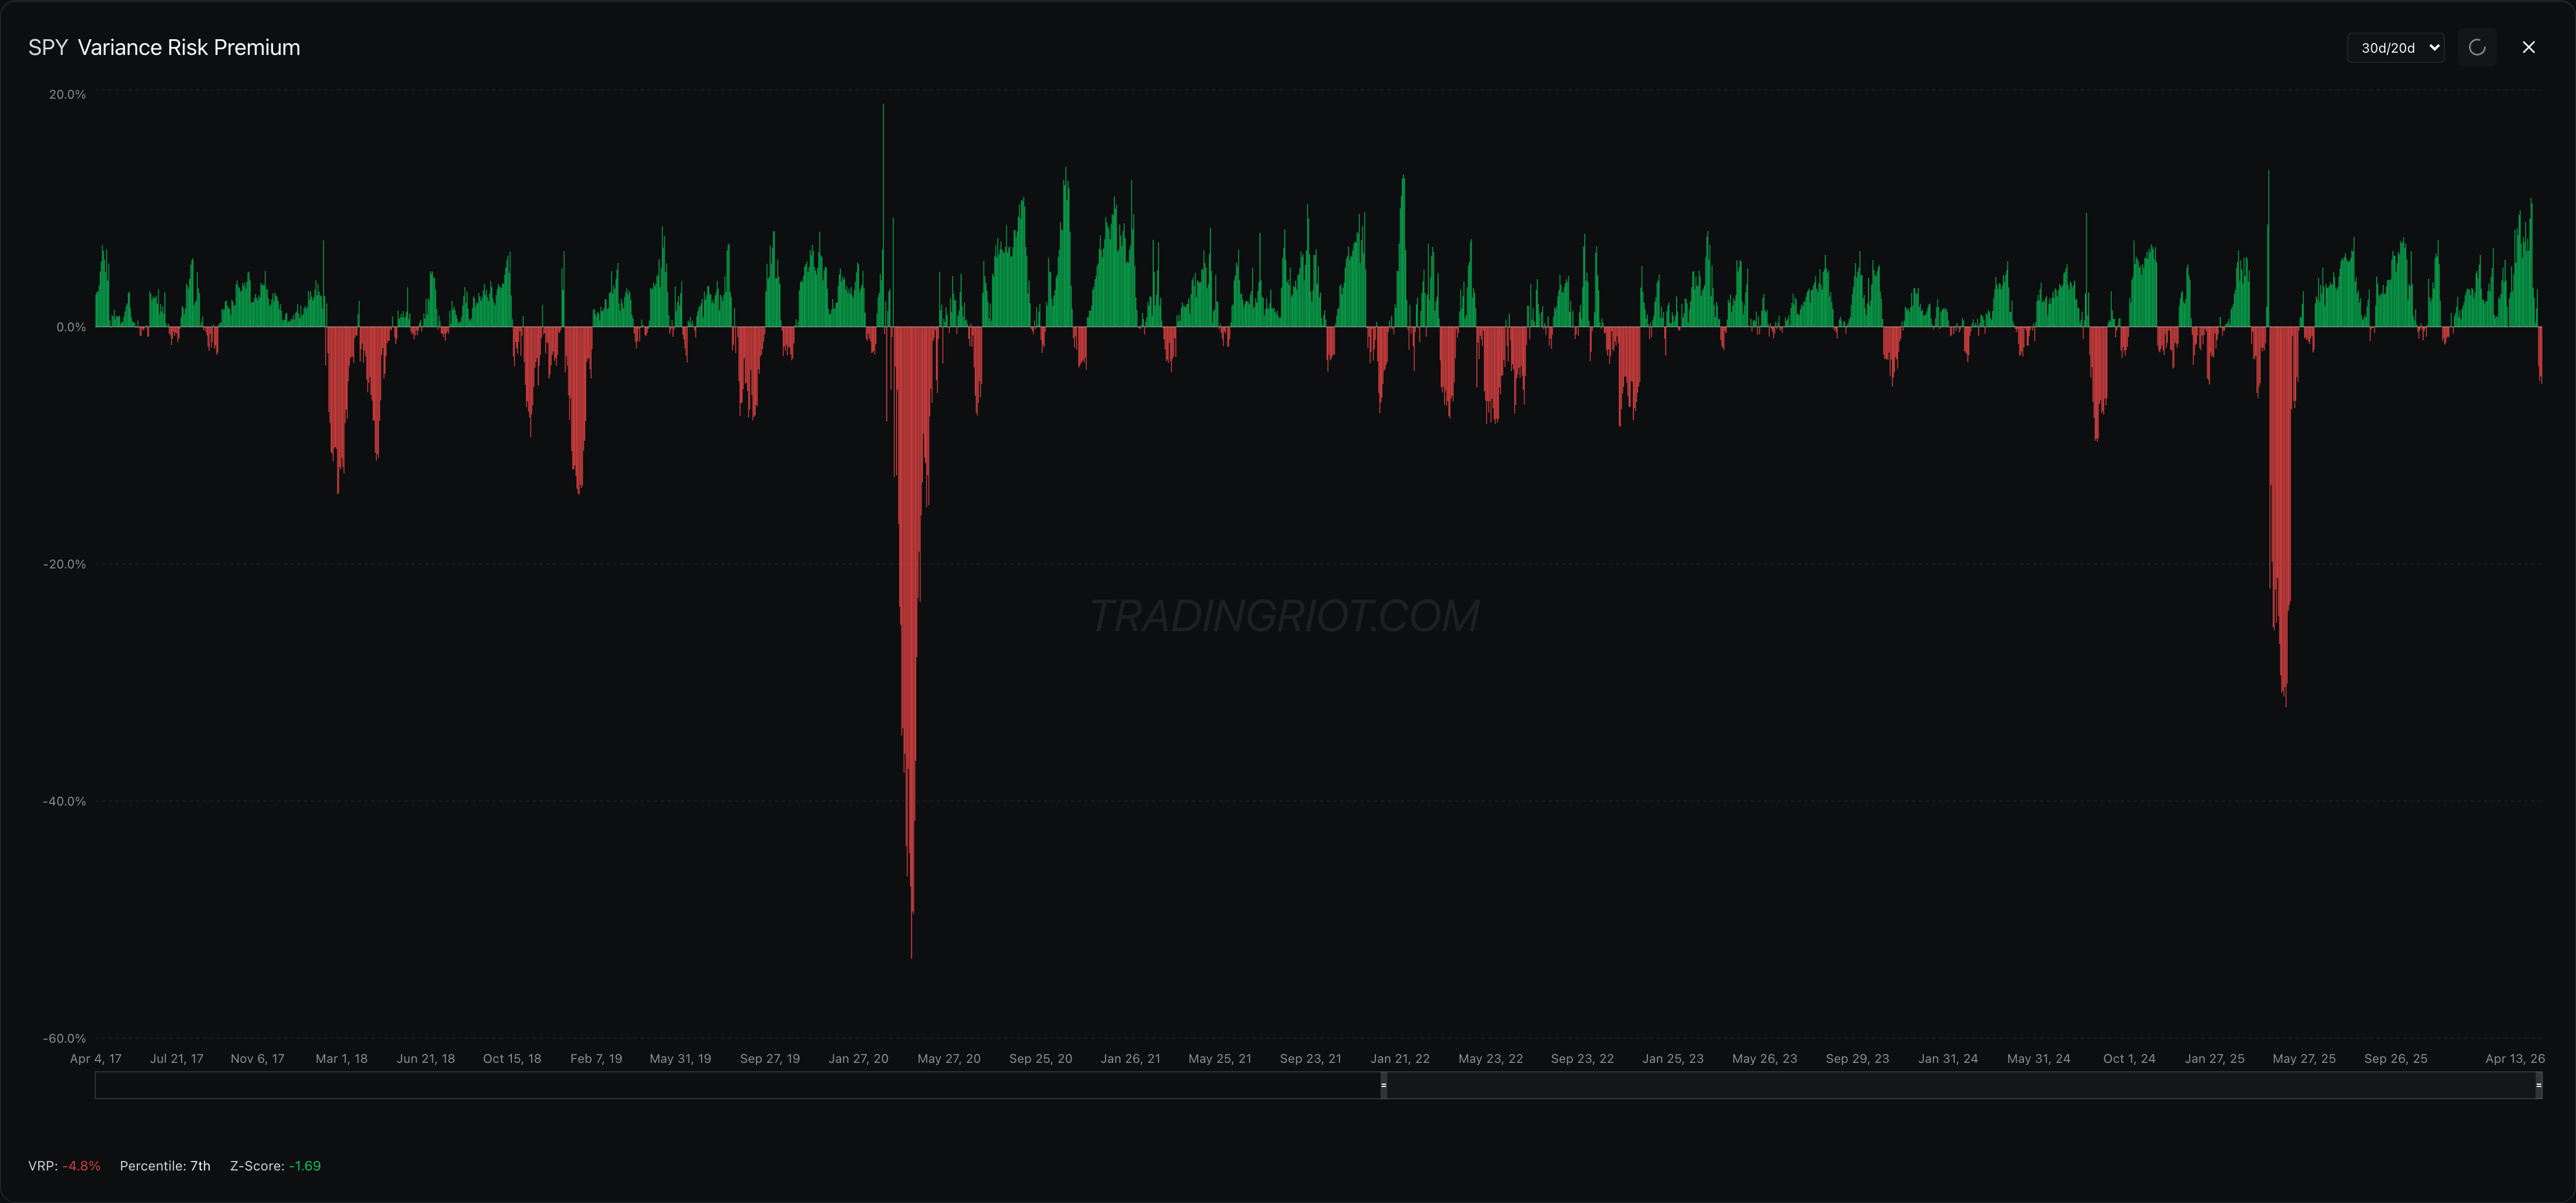
As you can see on the chart above, variance risk premium (VRP) for SPY is mostly positive with some nasty spikes to the downside. Market participants consistently overestimate the amount of volatility that will occur over the next n-days. But when volatility does exceed the estimate, it usually overshoots by a lot.
This is the “staircase up, elevator down” feature markets have. Most up days are calm and slow while crashes are fast and violent.
So why is VRP consistently overstating what ends up happening? Are people dumb? Yes, generally, but that’s probably beside the point.
There are several reasons for it, and VRP probably deserves its own article sometime in the future. But long story short, implied volatility is historically elevated because sellers demand compensation due to concave payoff structure, buyers are buying protection, and gamblers are gambling. All of this creates a structural imbalance between option buyers and sellers.
Variance risk premium has been studied for a long time and similar to the directional risk premium, it is unlikely to disappear anytime soon.
Why This Sucks
I generally hate people who glorify trading. Holding stuff that can go down sucks. And while I continue to do this because my mom raised no pussy, for everything you trade it’s good to understand why it sucks.
We established that you are making money because stonks go up and because options are overpriced. So what you end up doing is selling options while taking an upside directional bet.
A lot of you probably know that selling options has a concave payoff, or in other words, negative skew. You get paid small amounts of money while risking much larger losses.
Don’t worry, this is not one of those covered call or wheel strategies you’ve probably seen on YouTube, where your risk is technically unlimited hidden behind one of the dumbest phrases in trading: selling options for “income.”
While our risk will be limited, the risk to reward will still be negative. When we lose, we lose more than when we win.
If you want to trade a strategy like that, you need a high win rate to compensate for the larger losses. This is probably a decent spot to share the full strategy backtest including commissions, drawdowns, and everything else.
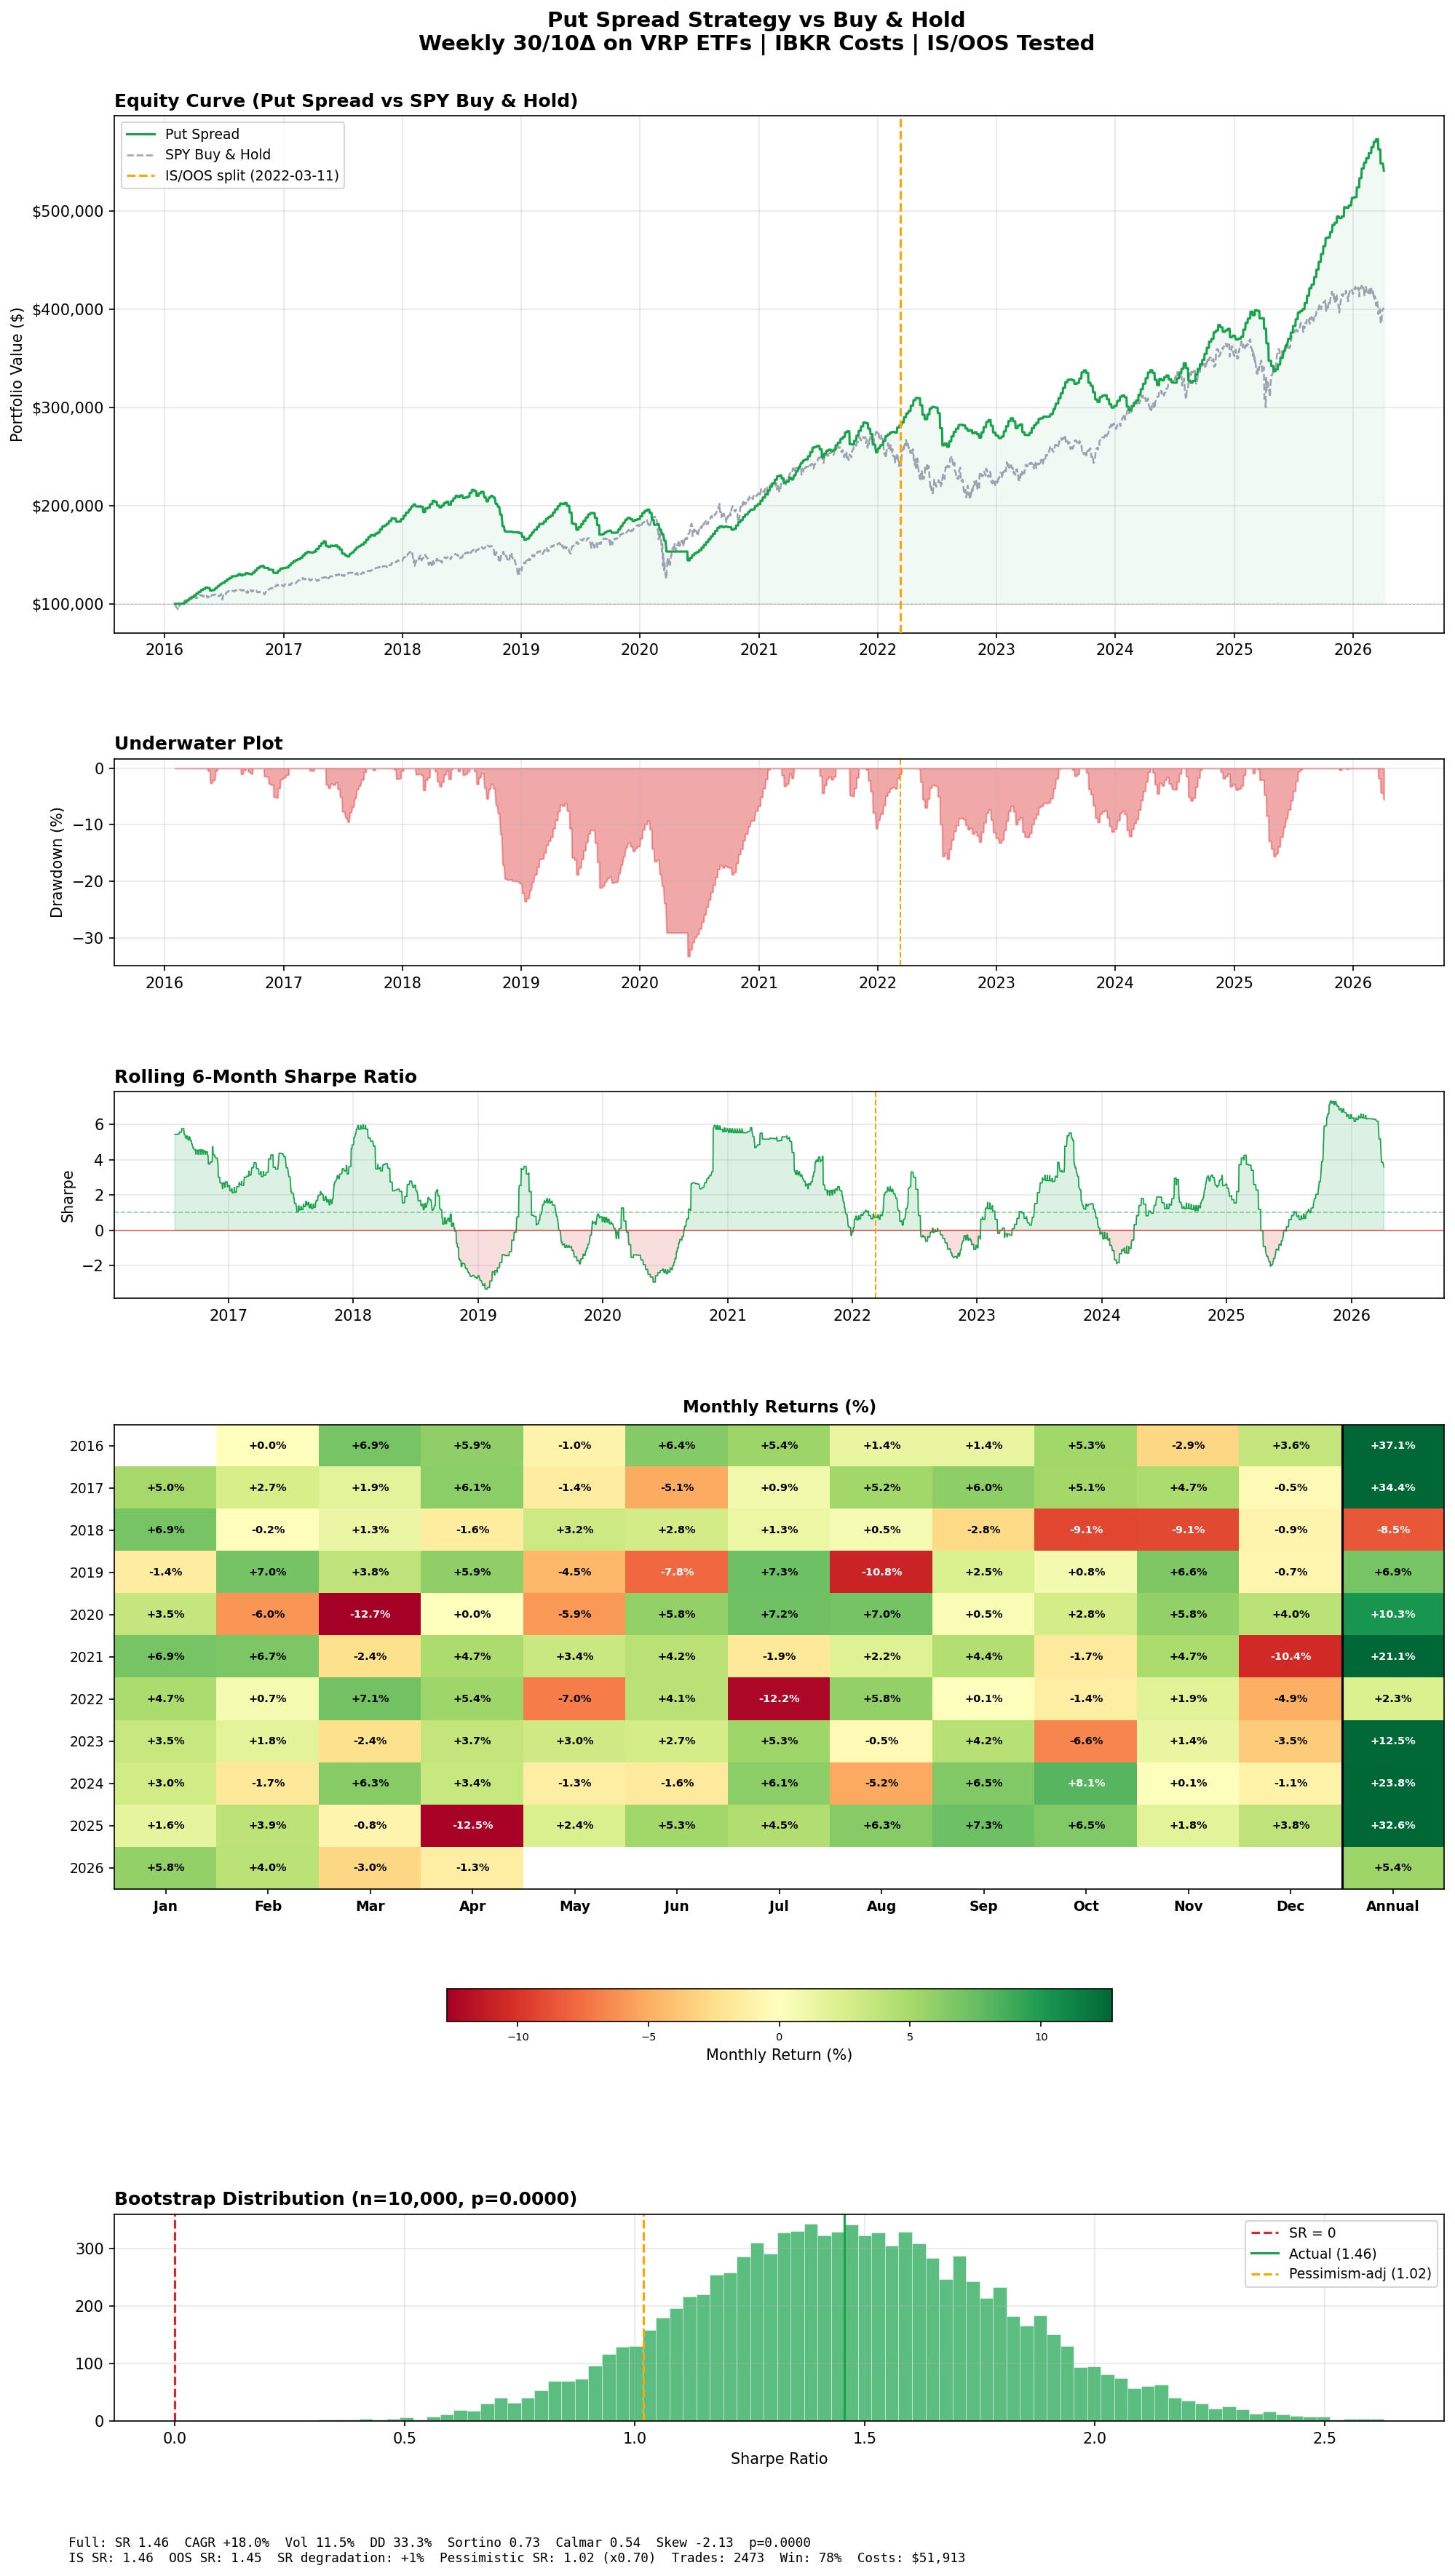
If you continue reading after the disappointment that this is not a hidden alpha returning 500% per year, let’s quickly break down the chart above.
The strategy returned 18% CAGR with only 11.5% annualized volatility. For context, SPY gives you roughly 10% CAGR with around 15-16% volatility, so you’re getting almost double the return with less risk.
Sharpe ratio sits at 1.46, which is strong for anything that isn’t curve-fitted. The pessimism-adjusted Sharpe still comes in at 1.02, meaning even after penalizing for potential overfitting, the strategy holds up.
Win rate is 78% across 2,473 trades. That high win rate is exactly what you need to offset the negative skew we talked about. The strategy skew of -2.13 confirms what we already know: wins are frequent and small, losses are rare but painful.
Max drawdown hit 33.3%, which is not nothing. The Sortino ratio of 0.73 and Calmar of 0.54 reflect that. When this thing bleeds, it bleeds.
One detail worth noting: the backtest is split into in-sample and out-of-sample at March 2022. The in-sample Sharpe is 1.46, out-of-sample is 1.45. Almost no degradation. That’s rare and it matters, because most backtests fall apart the moment they hit data they weren’t optimized on.
Total costs came to $51,913 over the full period starting with $100,000 account. This is running on IBKR commissions and execution at mid-price which is realistic after learning more about instrument selection.
The Strategy
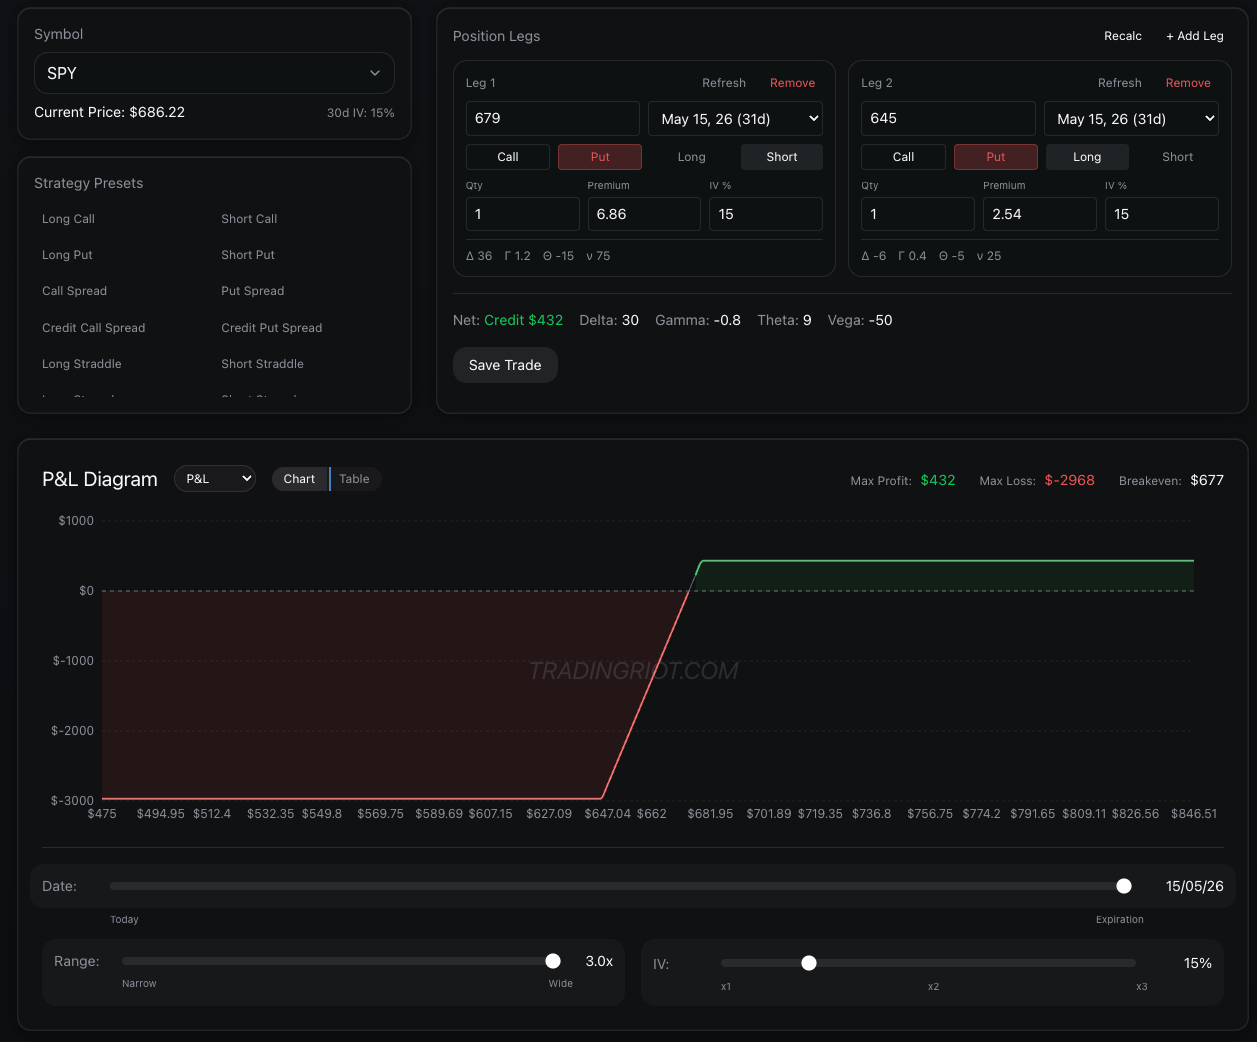
The sharper ones of you (those that can read) already saw from the backtest that we are going to be selling 30/10 delta put spreads on ETFs.
While there are many strategies that harvest these risk premiums, credit put spreads are the cleanest structure for it.
Straddles and strangles will get hurt during any move in either direction. Selling naked options receives more credit but can catch you off guard during crashes, especially since the strategy holds up to twenty positions at any given time.
Here are the exact strategy rules. I will expand on each step after.
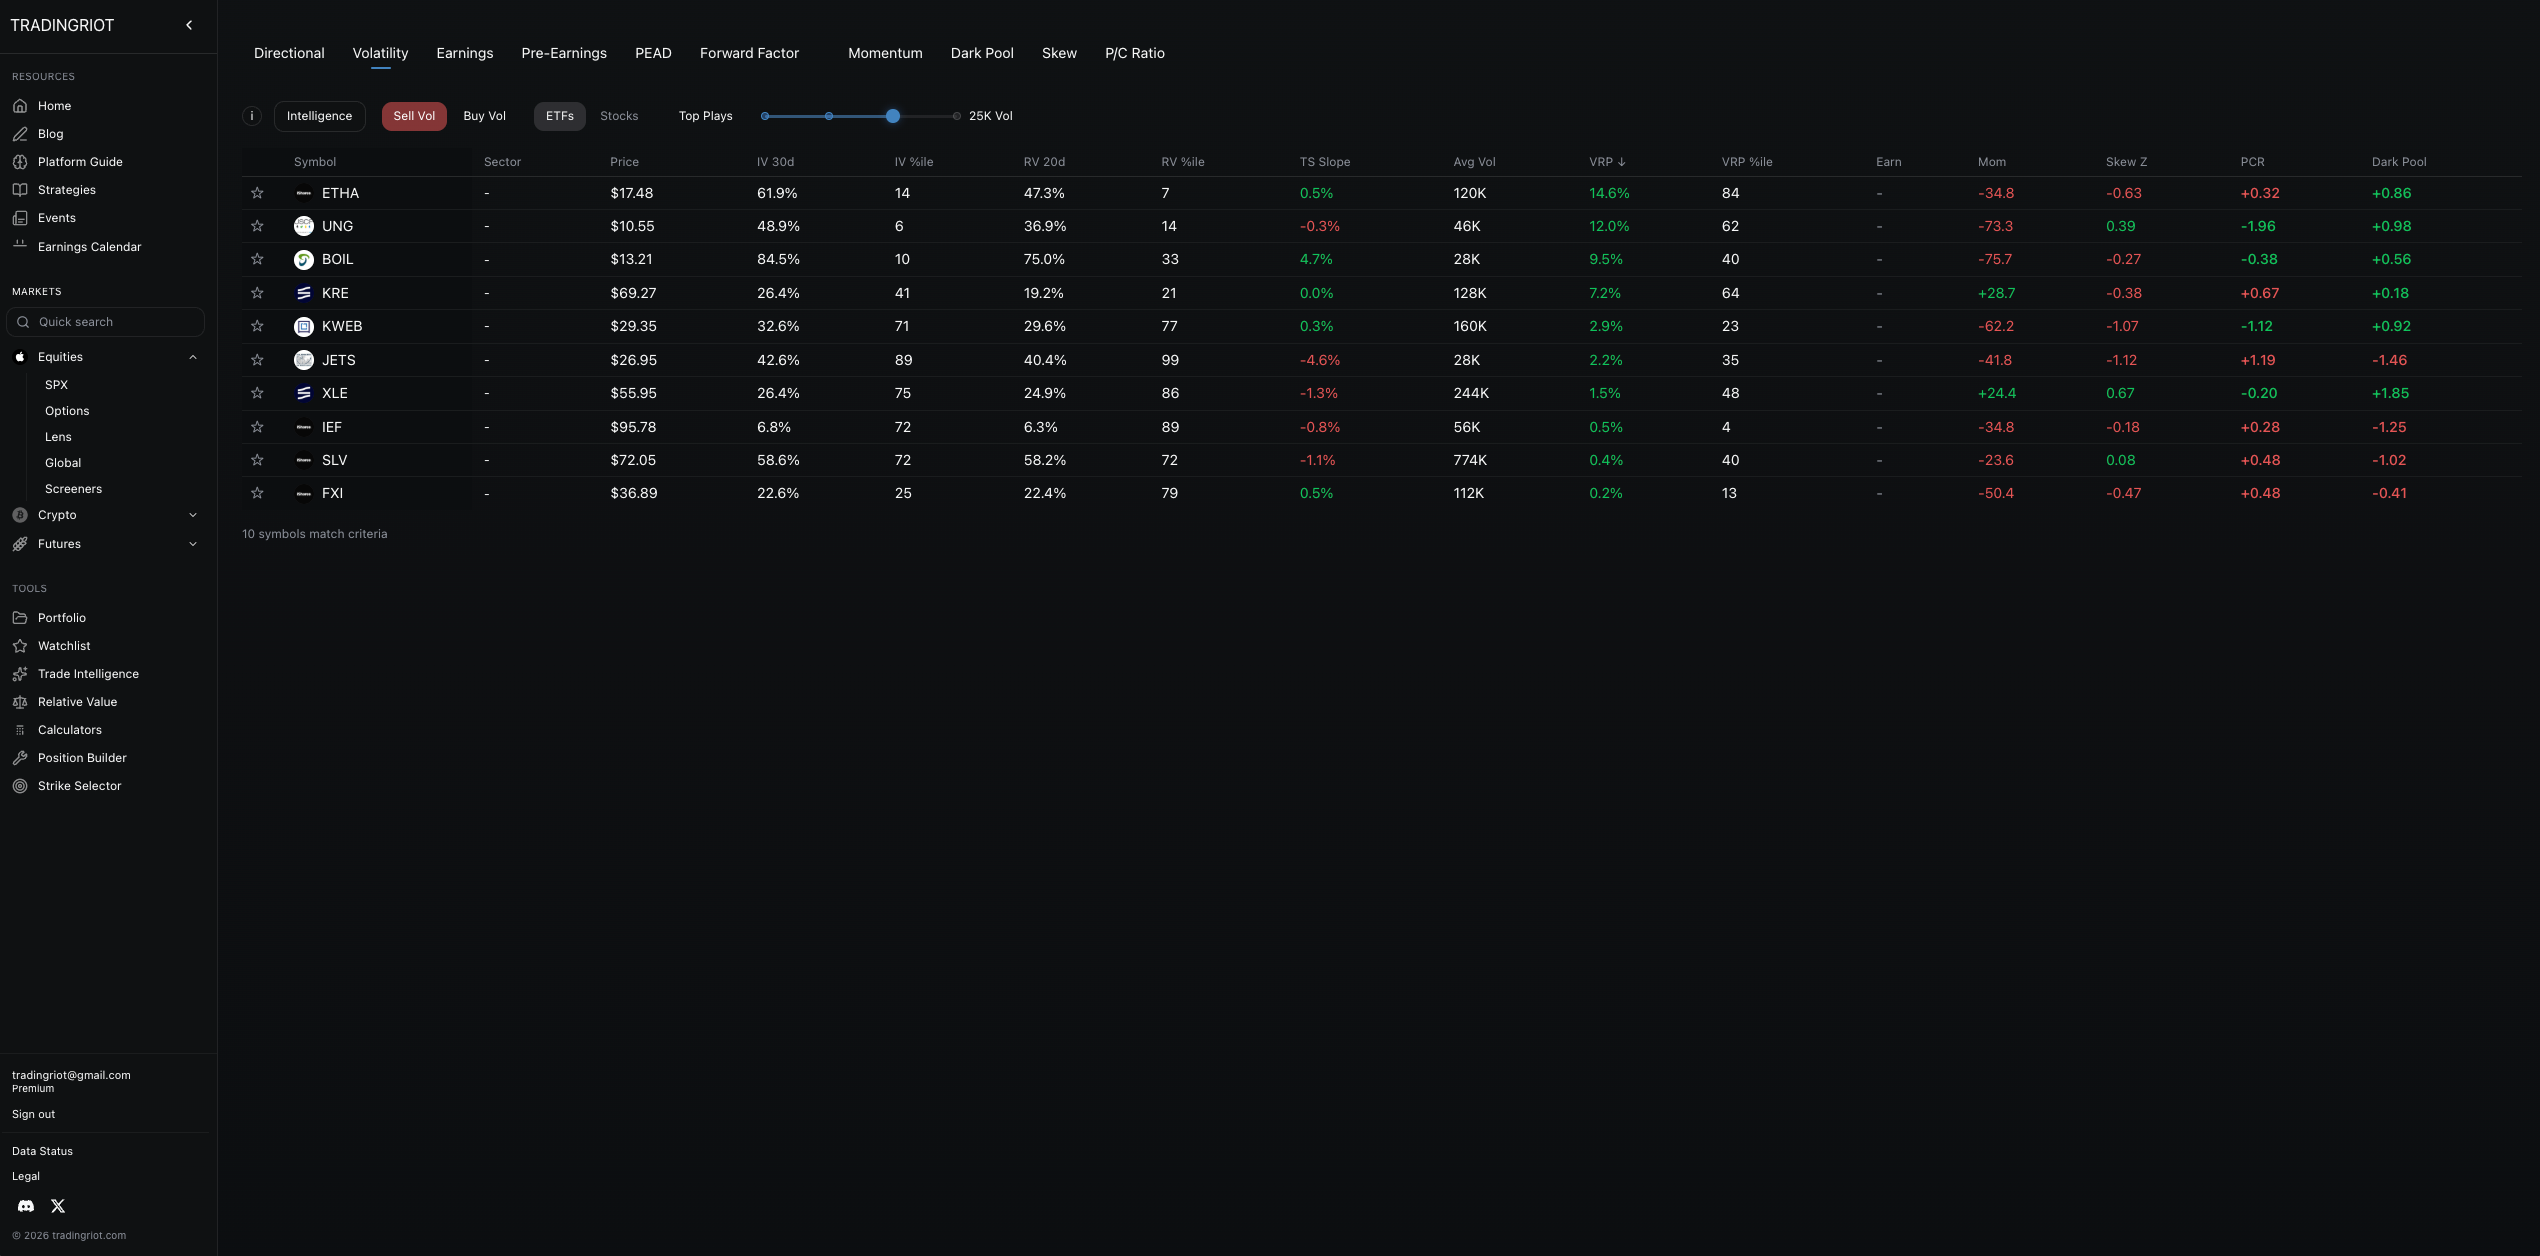
Every Monday, look at all ETFs with more than 25,000 average options volume over the last 20 days.
Sell a 30/10 delta put spread on the top five with the highest VRP. Aim for the closest expiration to 30 days out.
Repeat every Monday, so you are holding up to 20 positions at any given time.
If VIX is above 40, do not enter new trades for that week but let existing positions run.
There is a screener on Tradingriot which will do all of that for you each week.
I would say that one of the good signs of strategy being actually being any good is if you can mess around with entry parameters to see if it holds true.
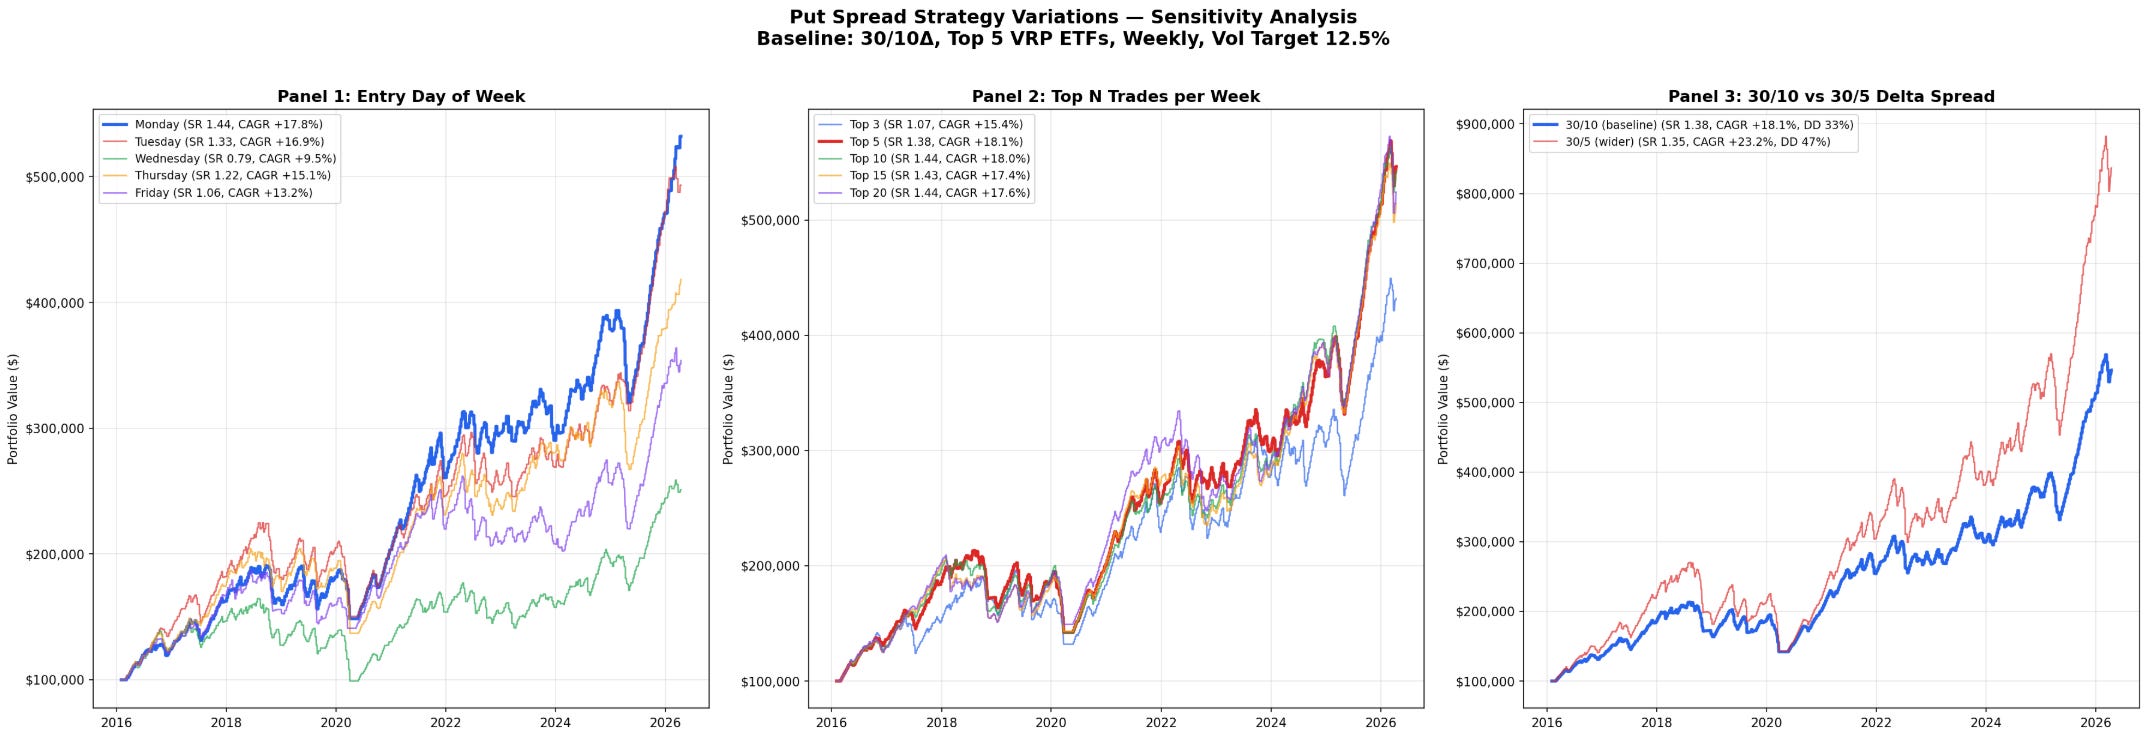
I would say that one of the good signs of a strategy actually being any good is if you can mess around with entry parameters and it still holds up. As you can see here, it does.
Panel 1 shows entry day sensitivity. Monday comes out on top with a 1.44 Sharpe and 17.8% CAGR, but Tuesday and Thursday aren’t far behind. Even Friday, the worst performer, still pulls a 1.06 Sharpe and 13.2% CAGR. The strategy isn’t fragile to when you enter. It works across the whole week, Monday just happens to be the best also kind of logical to know the trades out at start of the week and move on.
Panel 2 tests how many positions you open each week. Whether you trade the top 3, top 5, top 10, or even top 20, the Sharpe stays between 1.07 and 1.44. The CAGR ranges from 15.4% to 18.1%. More positions give you slightly more return but the risk-adjusted performance barely moves. Top 5 looks like a sweet spot where you are taking the trades with generally high VRP rather than trying to trade everything.
Panel 3 compares the 30/10 delta spread against a wider 30/5. The wider spread squeezes out more return at 23.2% CAGR, but the max drawdown jumps from 33% to 47%. The Sharpe barely changes, 1.38 versus 1.35. You’re getting paid more but you’re taking a significantly bigger hit when things go wrong. Its honestly up to you here if you are willing to try to get higher returns (as 5 delta options are much cheaper) or try to manage the drawdown better.
Overall, backtesting options turned out to be a little bit of dark magic (pain in the ass), so in reality you won't take perfect 30/10 delta trades. Which is fine. The key point is that the strategy performs well even when you mess around with the parameters, since the two risk premiums you are getting paid for remain the same.
Market Selection
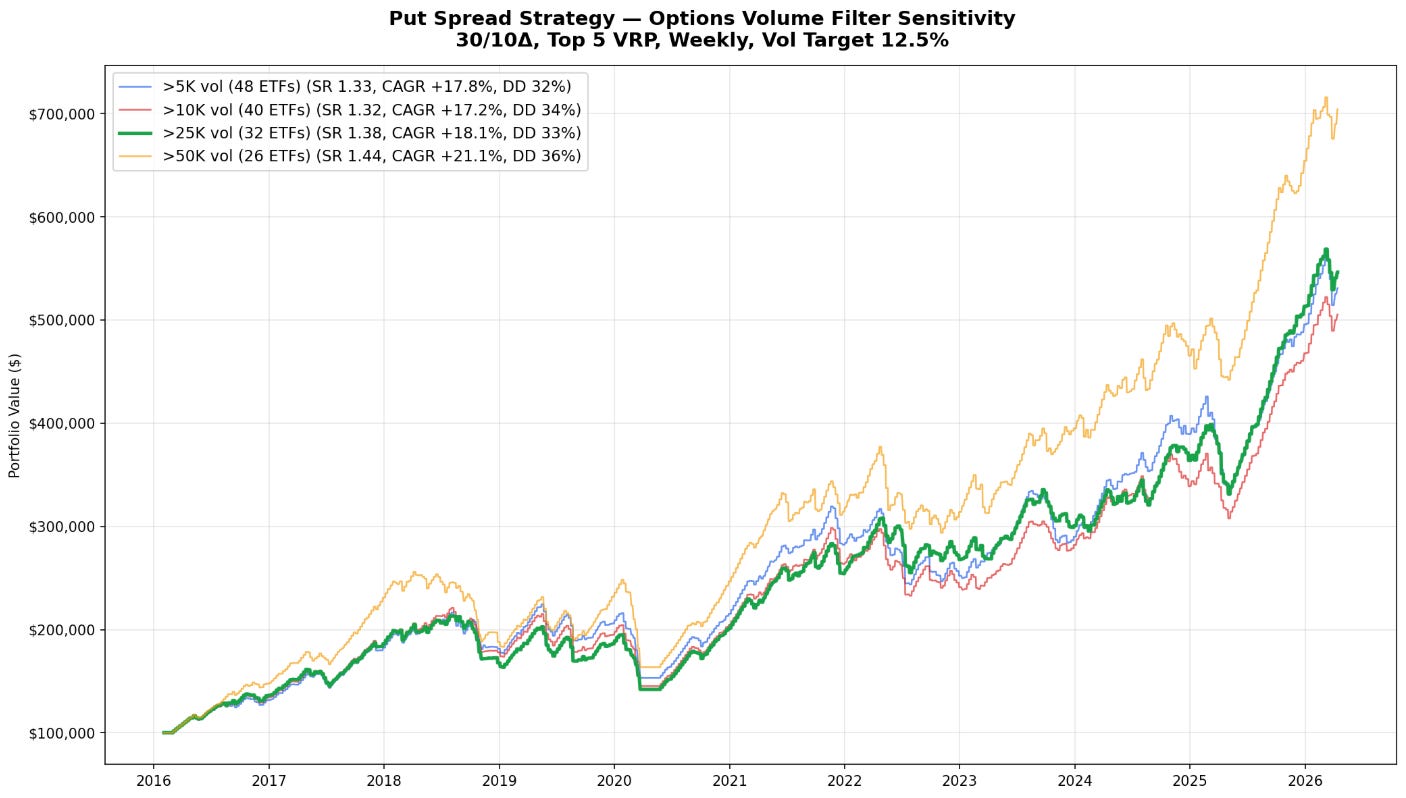
As I already mentioned, you will be trading liquid ETFs. The backtest actually shows that the most liquid ETFs above 50,000 traded contracts on a 20-day average perform the best, but 25k is a decent sweet spot to include a few more markets so you avoid trading heavily correlated ones.
Going to less liquid ones is fine, but while the backtest includes costs and slippage, you will just have a generally harder time trading the less liquid ones, especially with a larger account.
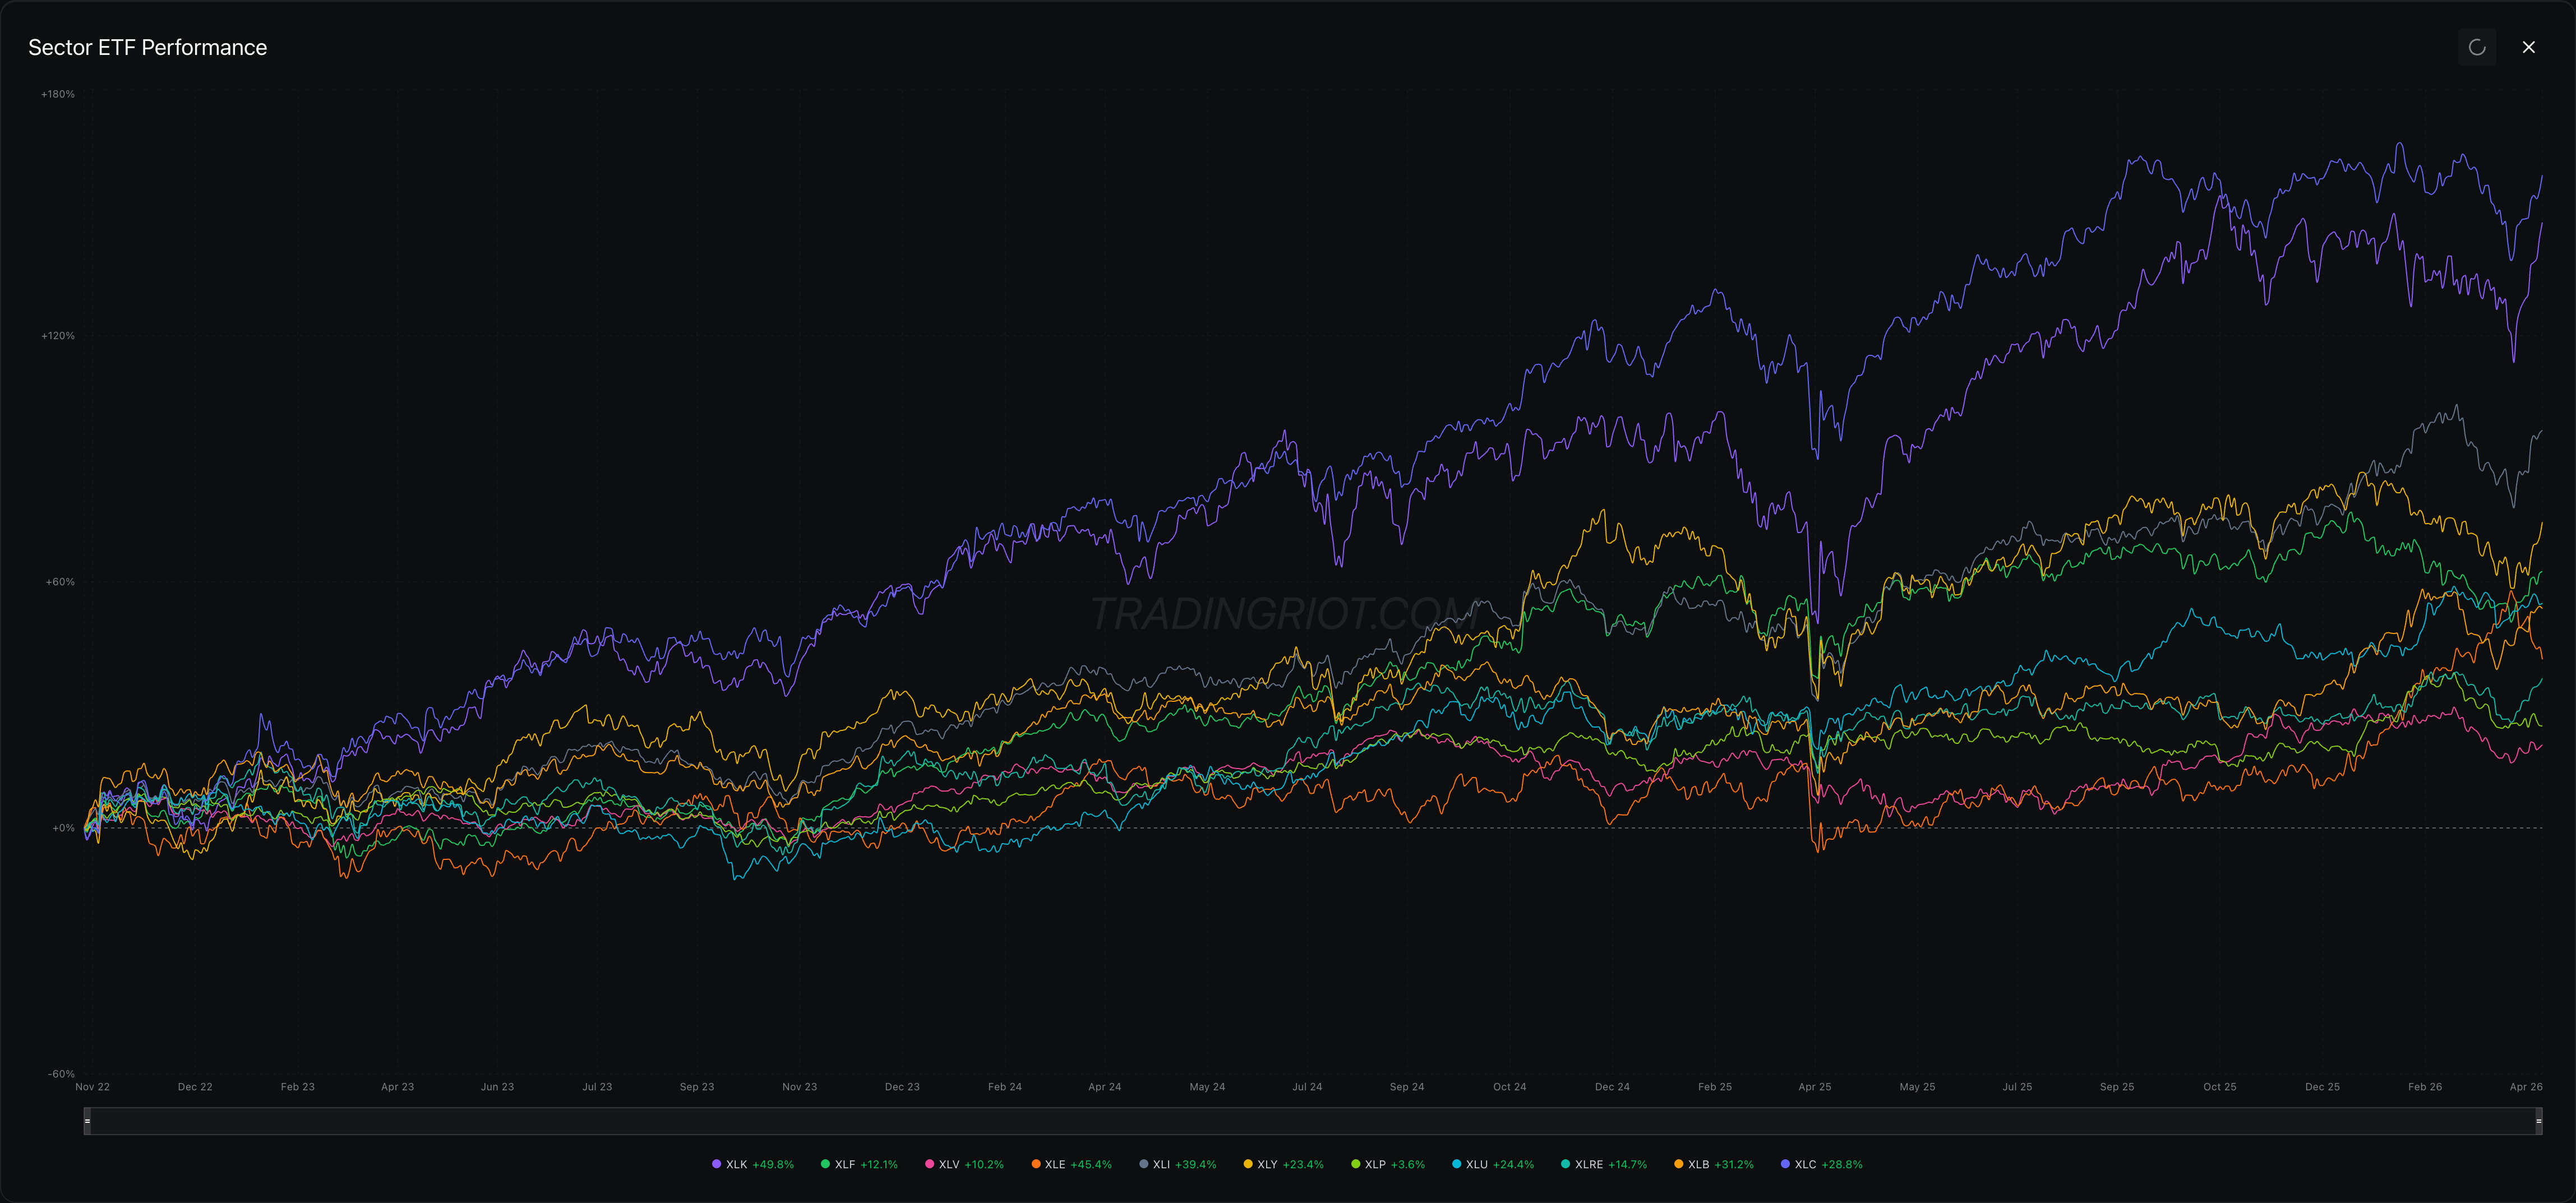
One important thing is that all leveraged and inverse ETFs were removed. The main reason you want to be trading ETFs is to remove a lot of the idiosyncratic risk stocks have. There are no earnings, no surprise news, and none of those annoying things that make a stock gap 20% overnight.
As you can see from the chart below, all key sector ETFs had positive drift over the last few years, which makes them great candidates. You might be thinking that some stocks go up much more. This is true, but your upside is capped on the put spread, so you generally prefer markets that grind up slowly rather than something much more volatile.
The VIX above 40 filter is there to protect you during the most turbulent times. Obviously, if there are no ETFs with positive VRP on Monday you just don’t open new trades since there is no variance risk premium to harvest. Also if you for example opened put spread on SPY on Monday and week after SPY is still in top five markets based on VRP, you will open new one.
The trades are held until expiration. No management, no closing things early. This keeps things simple and also saves you on commissions since you’re not paying to close positions that will expire worthless anyway. On IBKR, options that expire out of the money have no closing commission, so letting winners expire is both the laziest and cheapest approach.
Position Sizing
So how much do you bet? In the backtest and in actual trading, instead of fixed risk per trade I am using volatility targeting. This is borrowed from systematic trading frameworks from Robert Carver and the idea is simple: every position should contribute roughly the same amount of risk to your portfolio, regardless of what you’re trading.
You pick a target portfolio volatility. In this backtest, it’s 12.5% annualized. That means you expect your account to swing about 12.5% per year, or roughly 0.8% on any given day. For negative skew strategies like this one, 12.5% is a good sweet spot.
For each trade, you calculate how many contracts to sell so that the position’s expected daily P&L swing matches your risk budget. Volatile markets get fewer contracts because each one moves more. Calm ones get more contracts because each one barely moves. Every position ends up contributing roughly the same dollar risk to the portfolio.
It also scales with your account. When you’re making money, positions grow. When you’re losing, they shrink automatically. Built-in compounding on the way up, built-in de-risking on the way down.
Since this strategy has a fixed number of positions it holds at any given time, I built a calculator on the website that spits out the exact size for each trade. You plug in your account size and it does the rest.
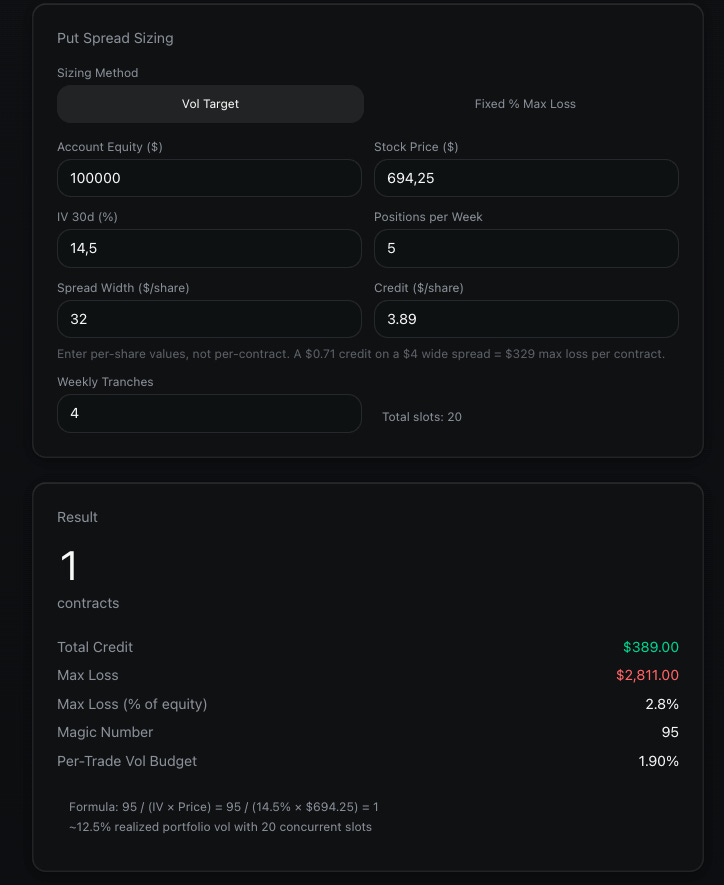
To achieve this volatility target I would recommend a starting balance of at least $100,000. If your account is smaller, you will struggle to trade large cap ETFs, so lowering the minimum volume threshold and selecting cheaper markets is reasonable. I understand that $100,000 is a lot of money but do not worry, most of the ETFs will be much smaller and cheaper, my point here is to be mindful of the proper sizing more than anything.
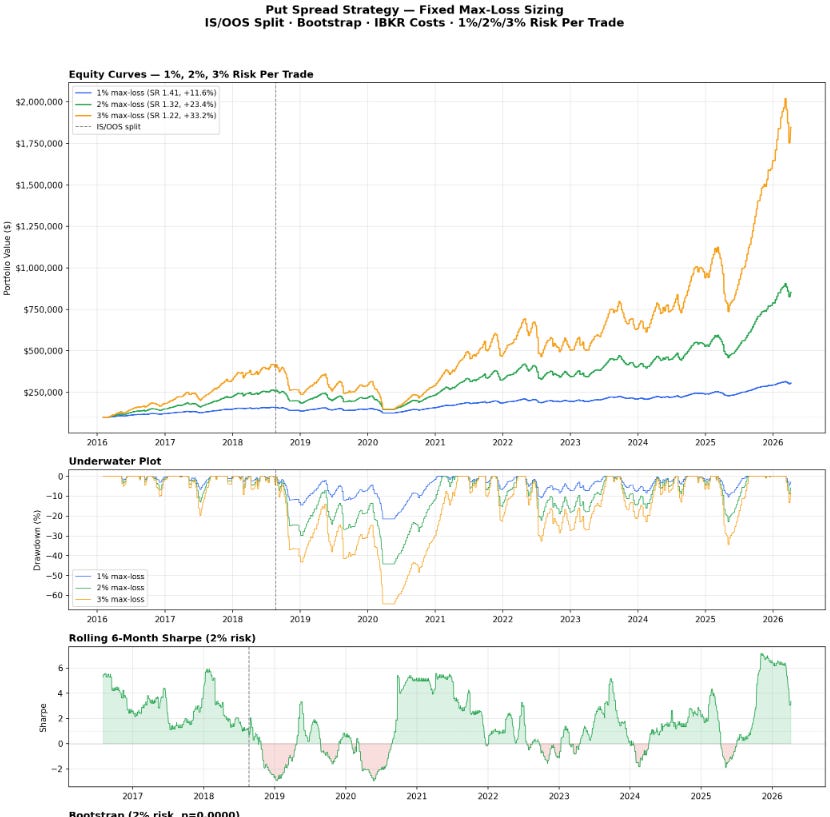
I also ran the backtest with fixed percentage max loss per trade. The 12.5% annualized volatility target translates to somewhere around 1.5-2% risk per trade. As you can see from the chart, the 1% risk version has the best Sharpe at 1.41 but only returns 11.6% CAGR. The 2% version hits 23.4% with a 1.32 Sharpe and drawdowns around 40%. The 3% version pushes 33.2% CAGR but drawdowns exceed 50%.
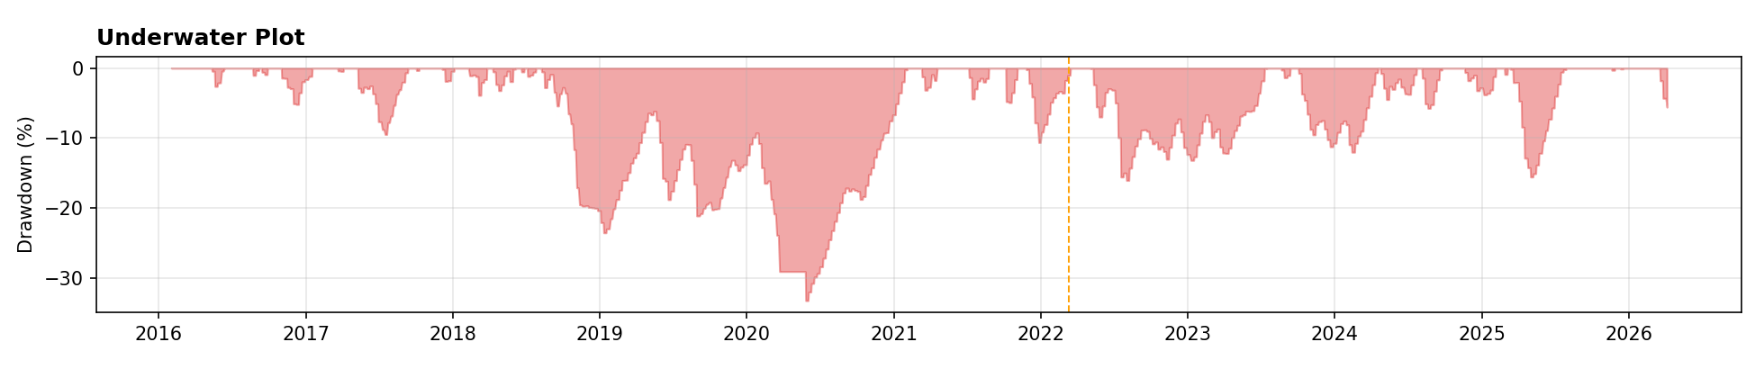
Drawdowns
I already mentioned that this strategy sucks, but before we wrap up I want to mention it one more time.
With the negative skew you are making less money than you are risking. Not sure about you, but with my luck I generally start trading something new and hit the worst case scenario within the first few weeks.
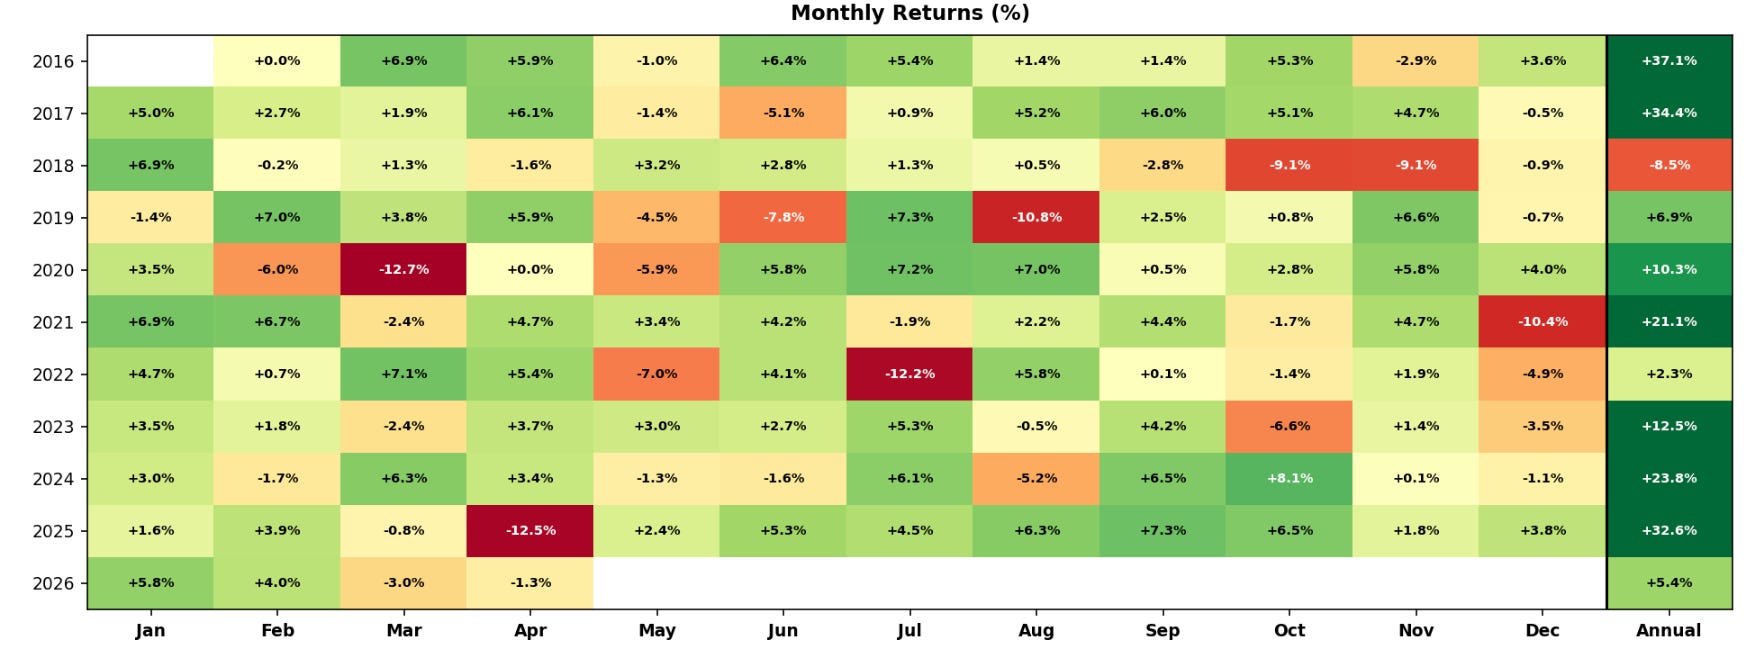
This can very easily happen here since a lot of the markets you will be trading are correlated. Negative months are absolute norm. Not only that, over the last 10 years you would have spent almost two years in drawdown from equity highs.
That’s not fun. You can obviously try to get cute with this by adding new rules and filters that might help you avoid bad trades. That’s completely up to you.
For me, when I can get paid for selling overpriced options and benefit from the fact that these markets go up and to the right over time, that’s more than enough.
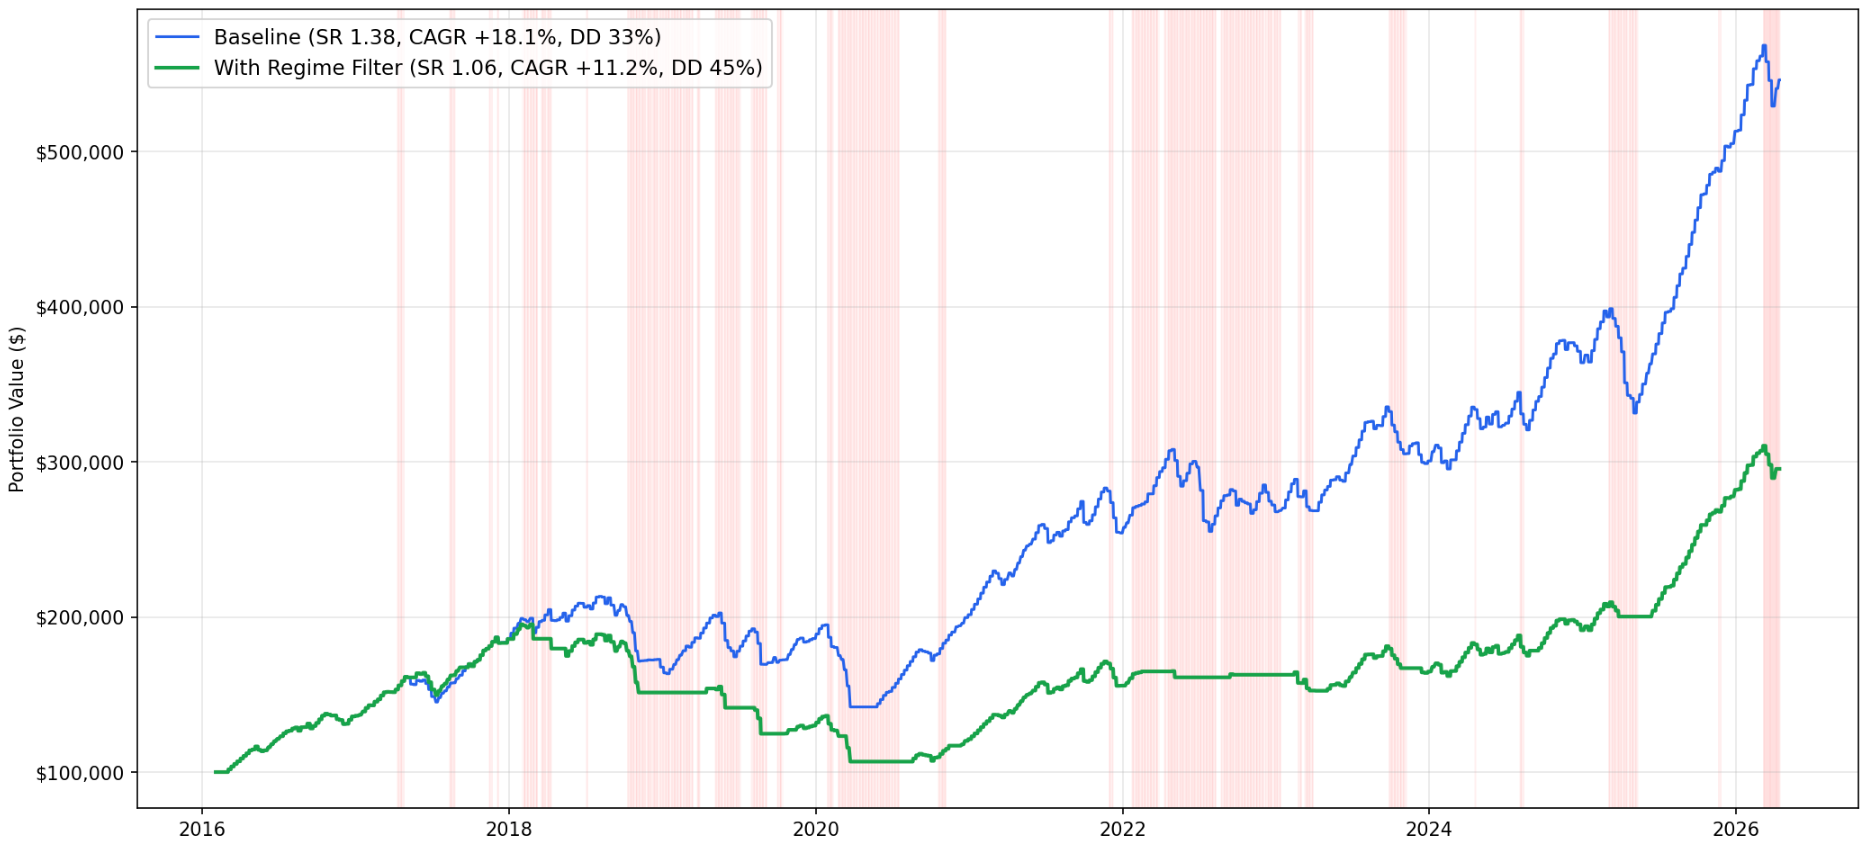
I actually spent some time building a regime filter for the broad market and applied those findings to the backtest to see if avoiding trades when things get shaky does any good. It turned out it doesn't.
Which makes sense, because you are getting paid to hold risk others don't want. Sitting out during the rough patches means giving up the exact moments where that compensation is highest.
Conclusion
This strategy is not something that will make you a millionaire overnight, but it delivers the promise from the headline without any bait.
Executing five trades on Monday is not going to take you more than 15 minutes (although don’t try to be an ape and actually work on getting the best fills possible) and you can and actually should do exactly nothing after that.
This has been my go-to strategy for “passive investing.” Getting exposure to the broad market without having to hang on trying to study all the different narratives and timing sector rotations.
As I mentioned, all the data is available on my website which significantly eases the whole workflow, but obviously there are many other places where options data is available.
Hope you enjoyed the read, and if you end up blowing up your account, don’t @ me.
Nice write up, Adam! Refreshing to see a strategy that isn't AI slop. Selling overpriced options into that equity drift is a classic move, but those ETF filters and the VIX 40 cap add a really solid layer of protection. Great stuff.
That’s the trade-off many people ignore with high win-rate strategies. Frequent small wins feel like skill right up until the payoff structure reminds you what you were actually underwriting. Win rate and risk quality are not the same thing.