

When it comes to volatility, the market generally doesn’t do all that much during a normal trading day or a week. However, we have several planned events each month, besides these being public gatherings of all the macro experts on social media, where you can learn from a person, with the highest achieved education being driving school, if there will be a rate hike or how companies’ earnings announcements will look.
These events drive a considerable anticipation in terms of volatility expectations and therefore often provide interesting trading opportunities.
In this article I want to cover a few of them, mostly looking at single company earnings but also trading indices around the events like FOMC.
Before we do so, all the data you will see in this article comes from Tradingriot.com. There you can find all relevant charts, screeners, and calculators, which allow you to start trading these strategies yourself, or you can follow the systematic portfolios in equities and crypto.
This article also assumes some basic knowledge of options trading; if you don’t have that, you can read the free guide here.
Why does this make money?
While this is not very popular in the trading space, where apparently drawing a rectangle on a chart is a strong enough reason for a trade to make money, I am a big fan of taking trades where I understand what is actually driving the PnL.
These strategies trade volatility, while I would rather not spend too much time on all the intricacies of how that works since it was already covered in the article about selling volatility. Ahead of any major planned event, whether it’s the FOMC, CPI, earnings, or election, there is a lot of uncertainty in the market.
Sensible Gamblers’ Guide to Shorting Volatility

The first time I learned about the concept of short volatility was when James Cordier posted a now-legendary apology video to YouTube after blowing his fund.
Several groups bid up options before these events for different reasons. Institutional hedgers need to protect concentrated positions through the event. Portfolio managers are often mandated to hedge. Retail traders pile into protective or speculative positions. Market makers widen spreads to account for jump risks. This combination creates systematically inflated premiums.
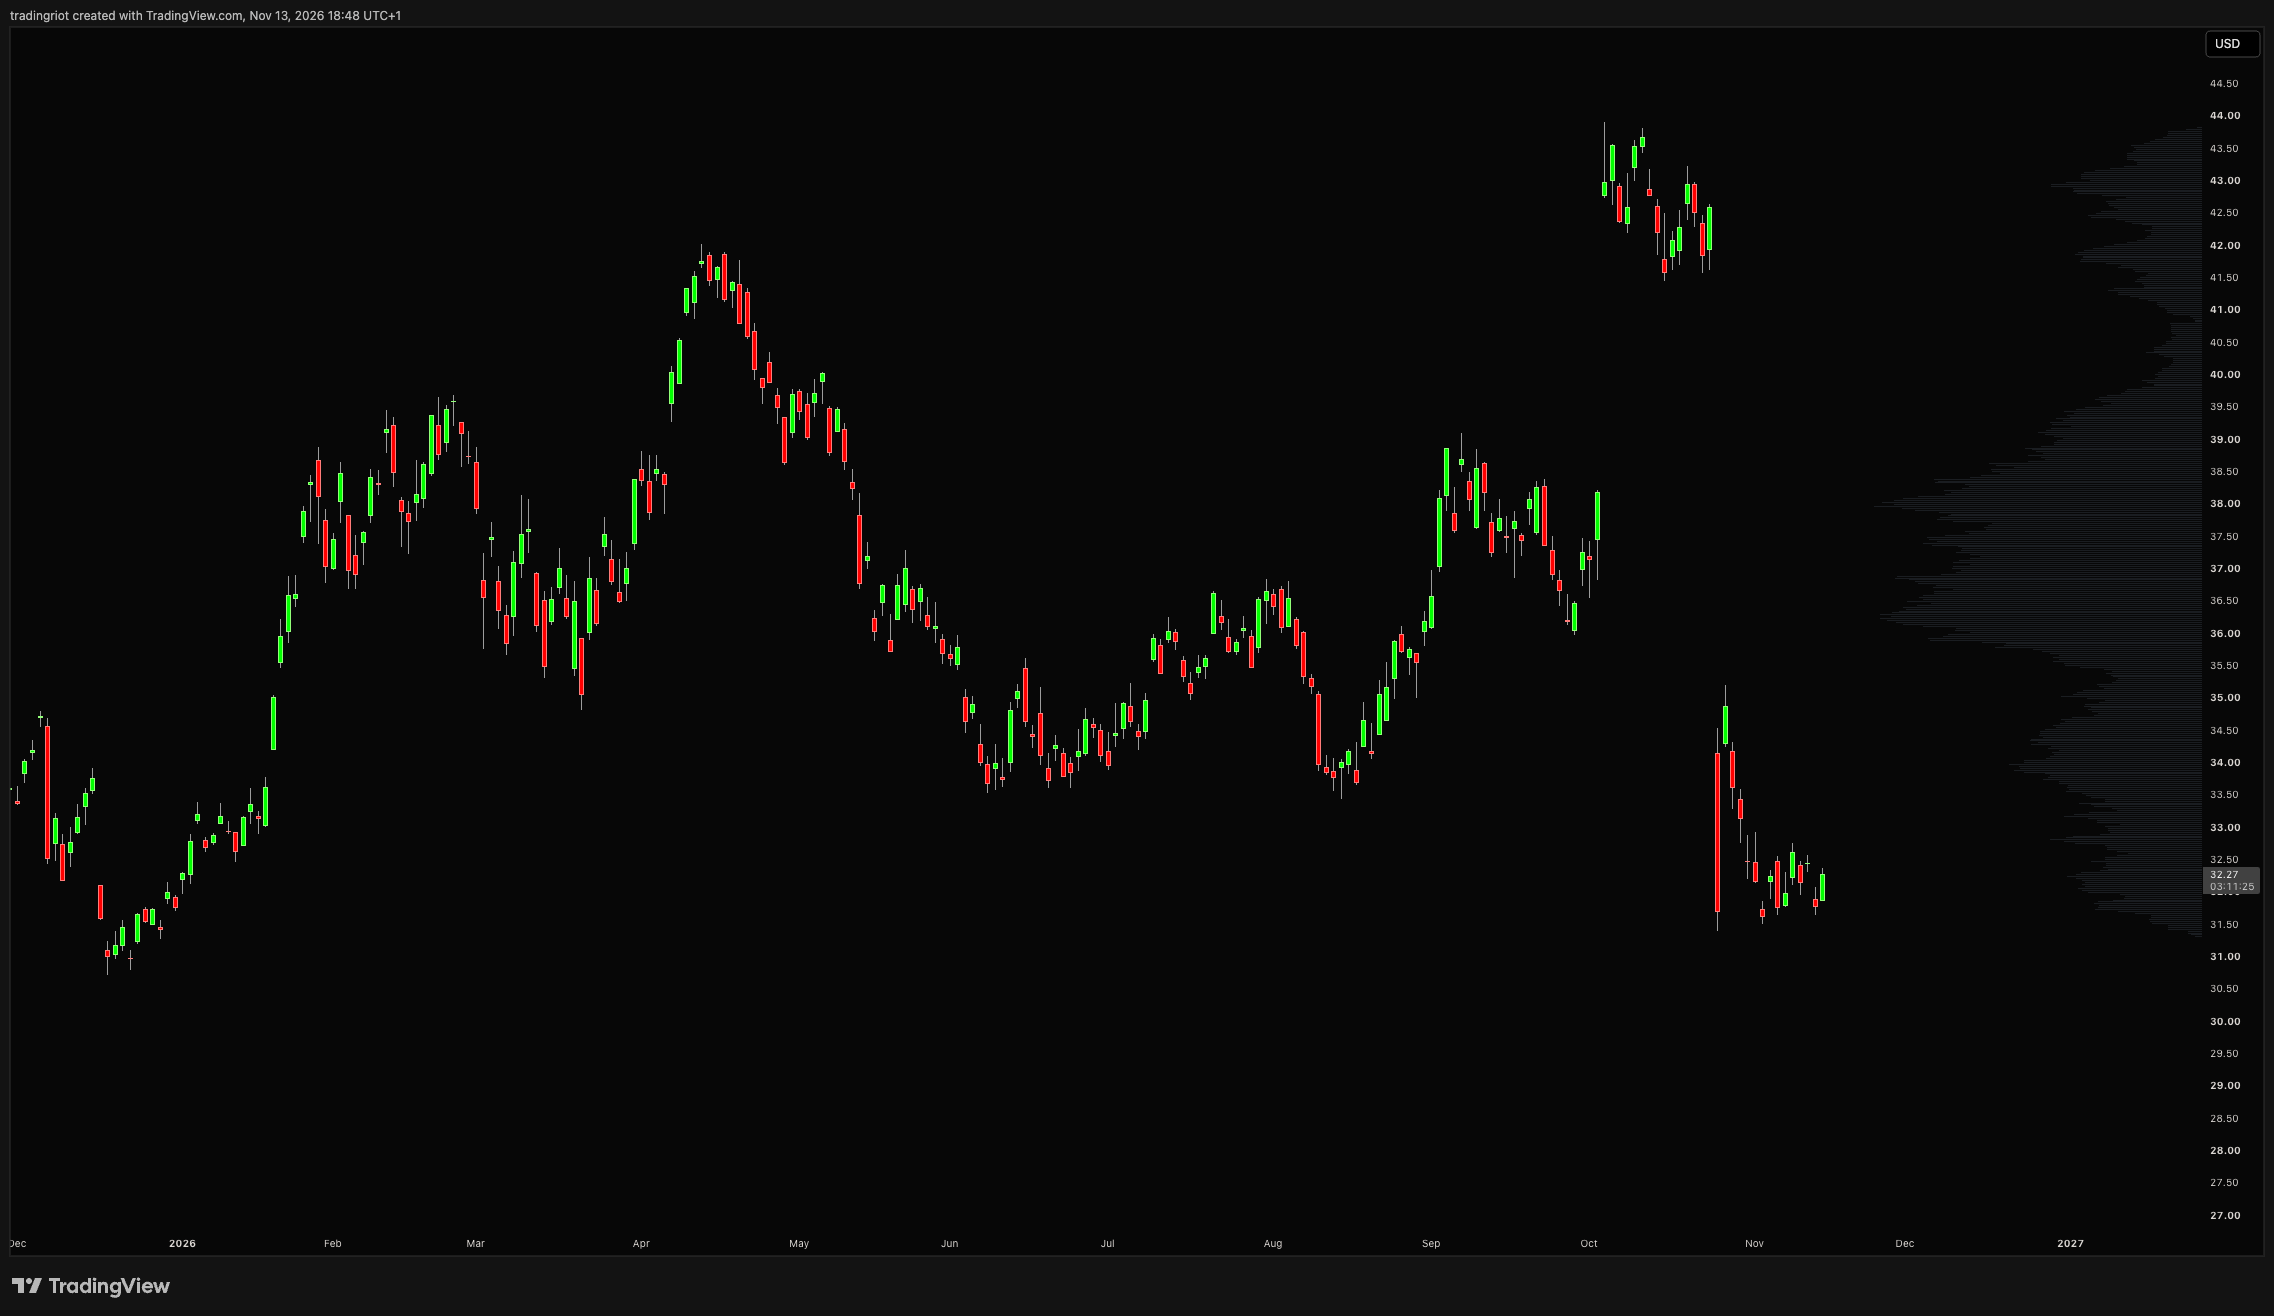
The premium is compensation for bearing a real risk. As these events can produce gap moves that no amount of delta hedging can cover, like this massive gap down after the Brazil election in EWZ (Brazil ETF).
You as a seller are providing a genuine service: absorbing the uncertainty that others don't want to hold. The edge exists because the market, on average, overestimates how bad things will be.
This is another version of the risk premium; people aren't stupid for buying these options. They're paying for insurance they genuinely need. But the insurance is, on average, priced too expensively. The seller captures that spread over many trades while finding himself crying in a fetal position every once in a while after a massive event surprise.
We can capture these with options; selling straddles, strangles, or buying calendars allows us to make money when markets “do nothing,” as we profit not only from price not moving but also from time decay and implied volatility crush.
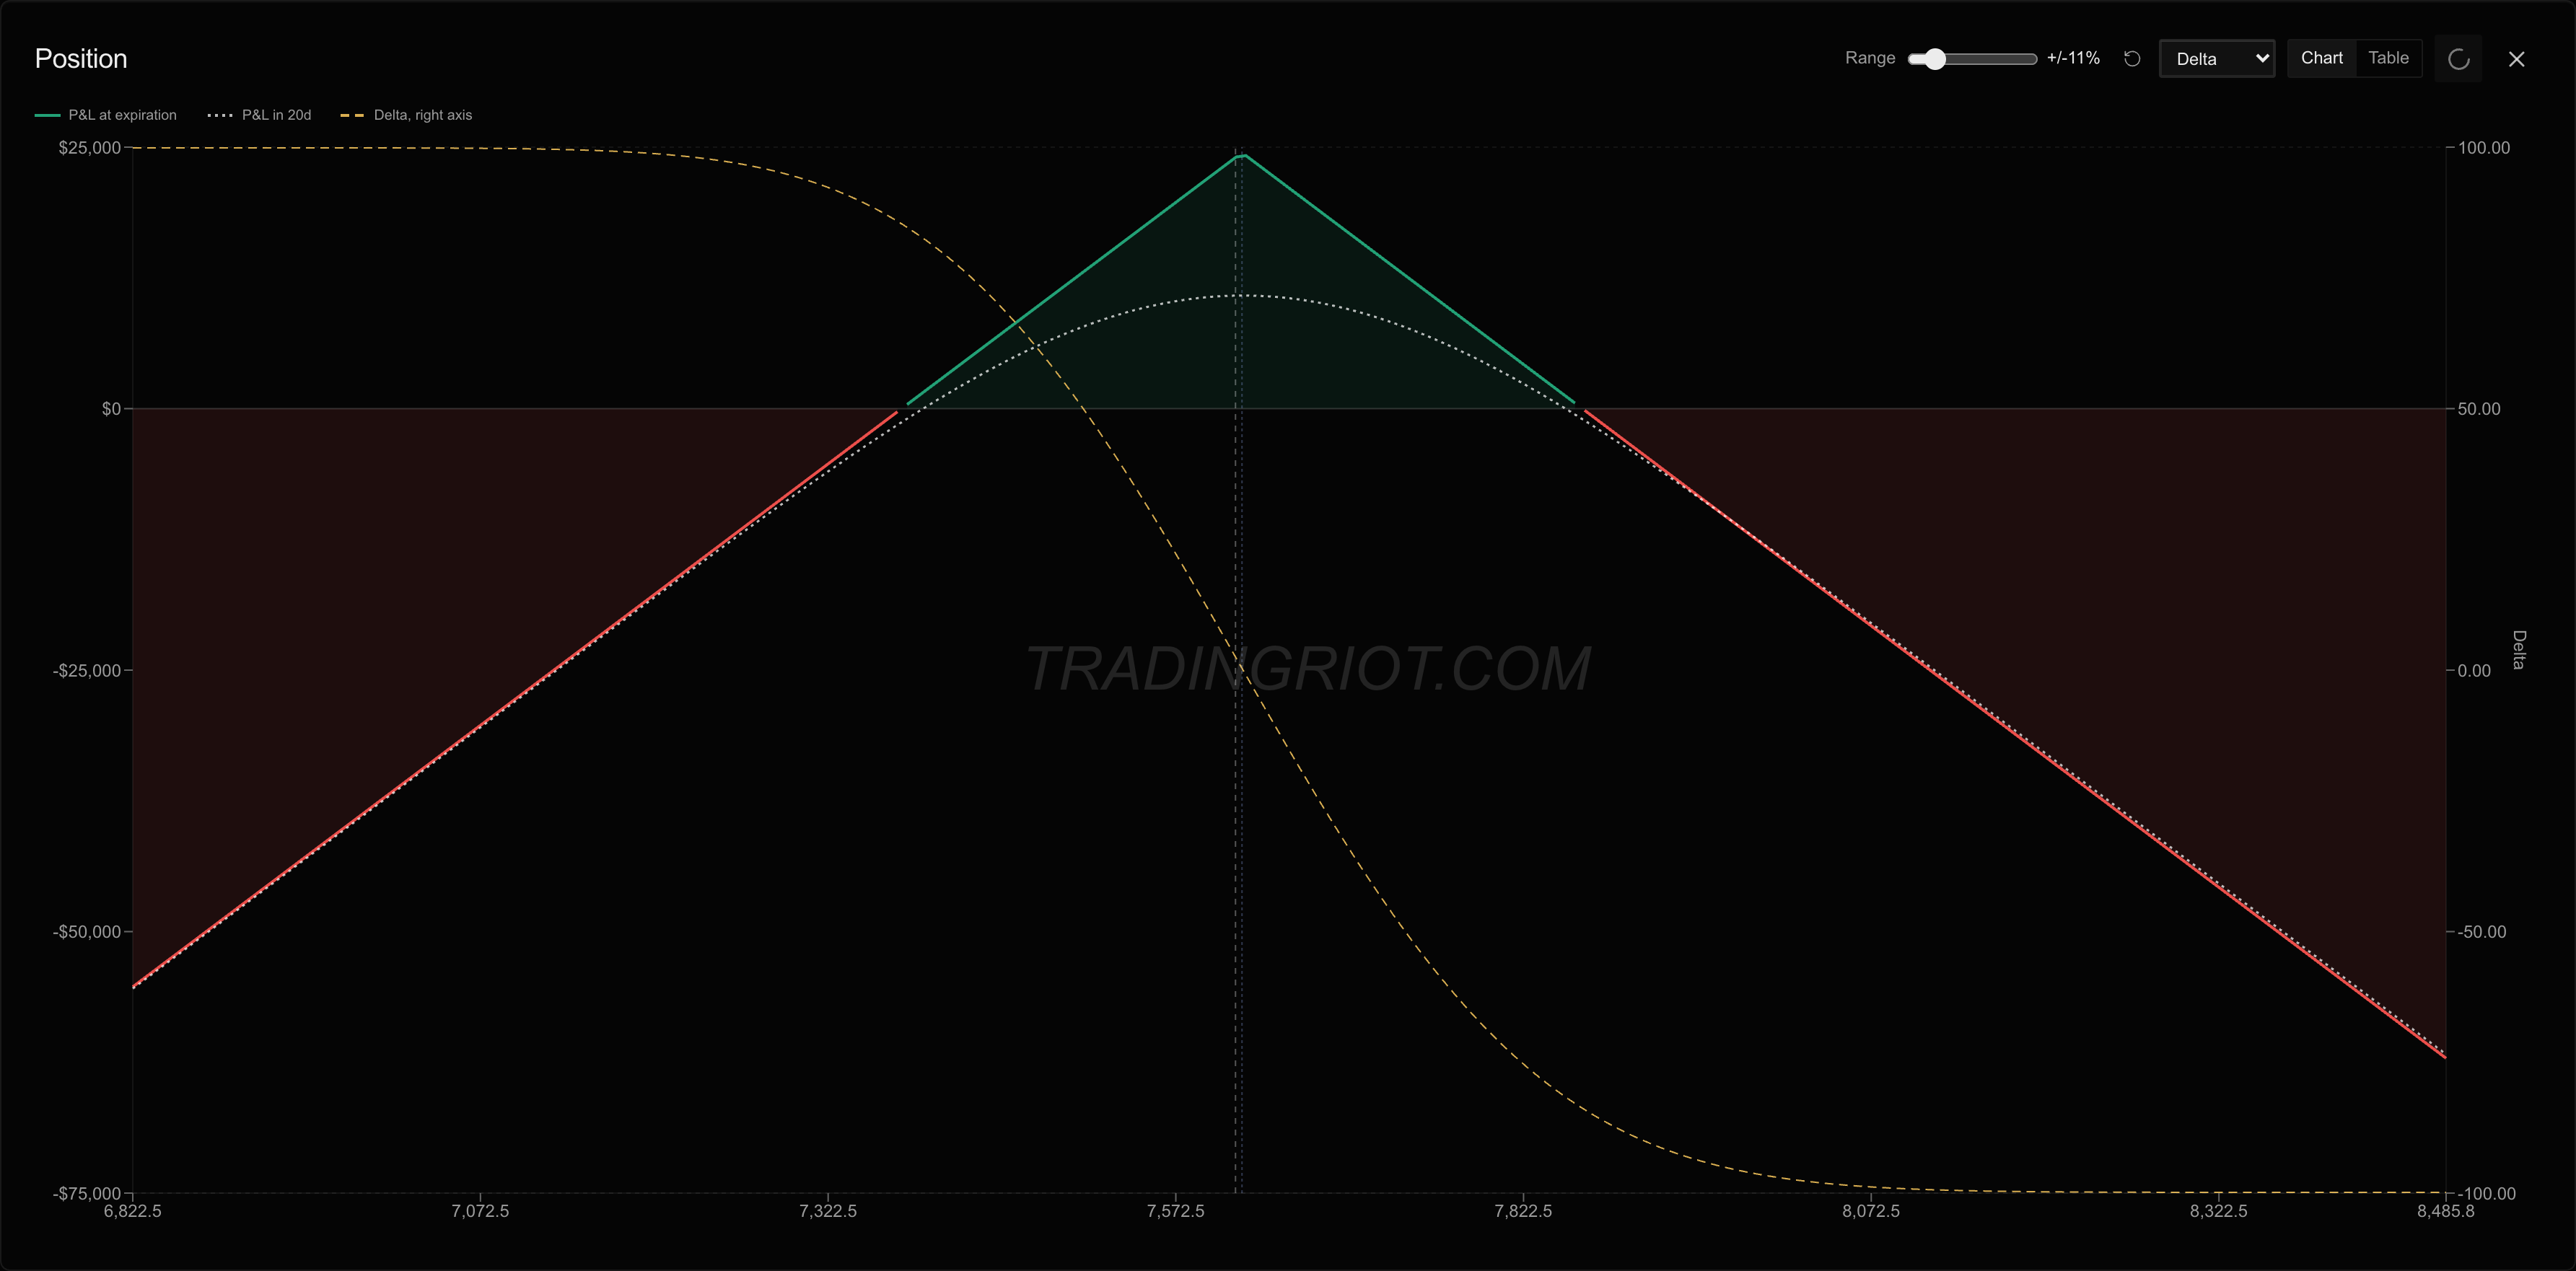
The implied-versus-realized gap shows up clearly in the data. When you compare the implied move priced by options to the actual move that shows up after the event, the implied tends to overshoot. Not every time. Not even most times by a considerable margin. But consistently enough, selling premium across a large sample of these events can have positive expected value.
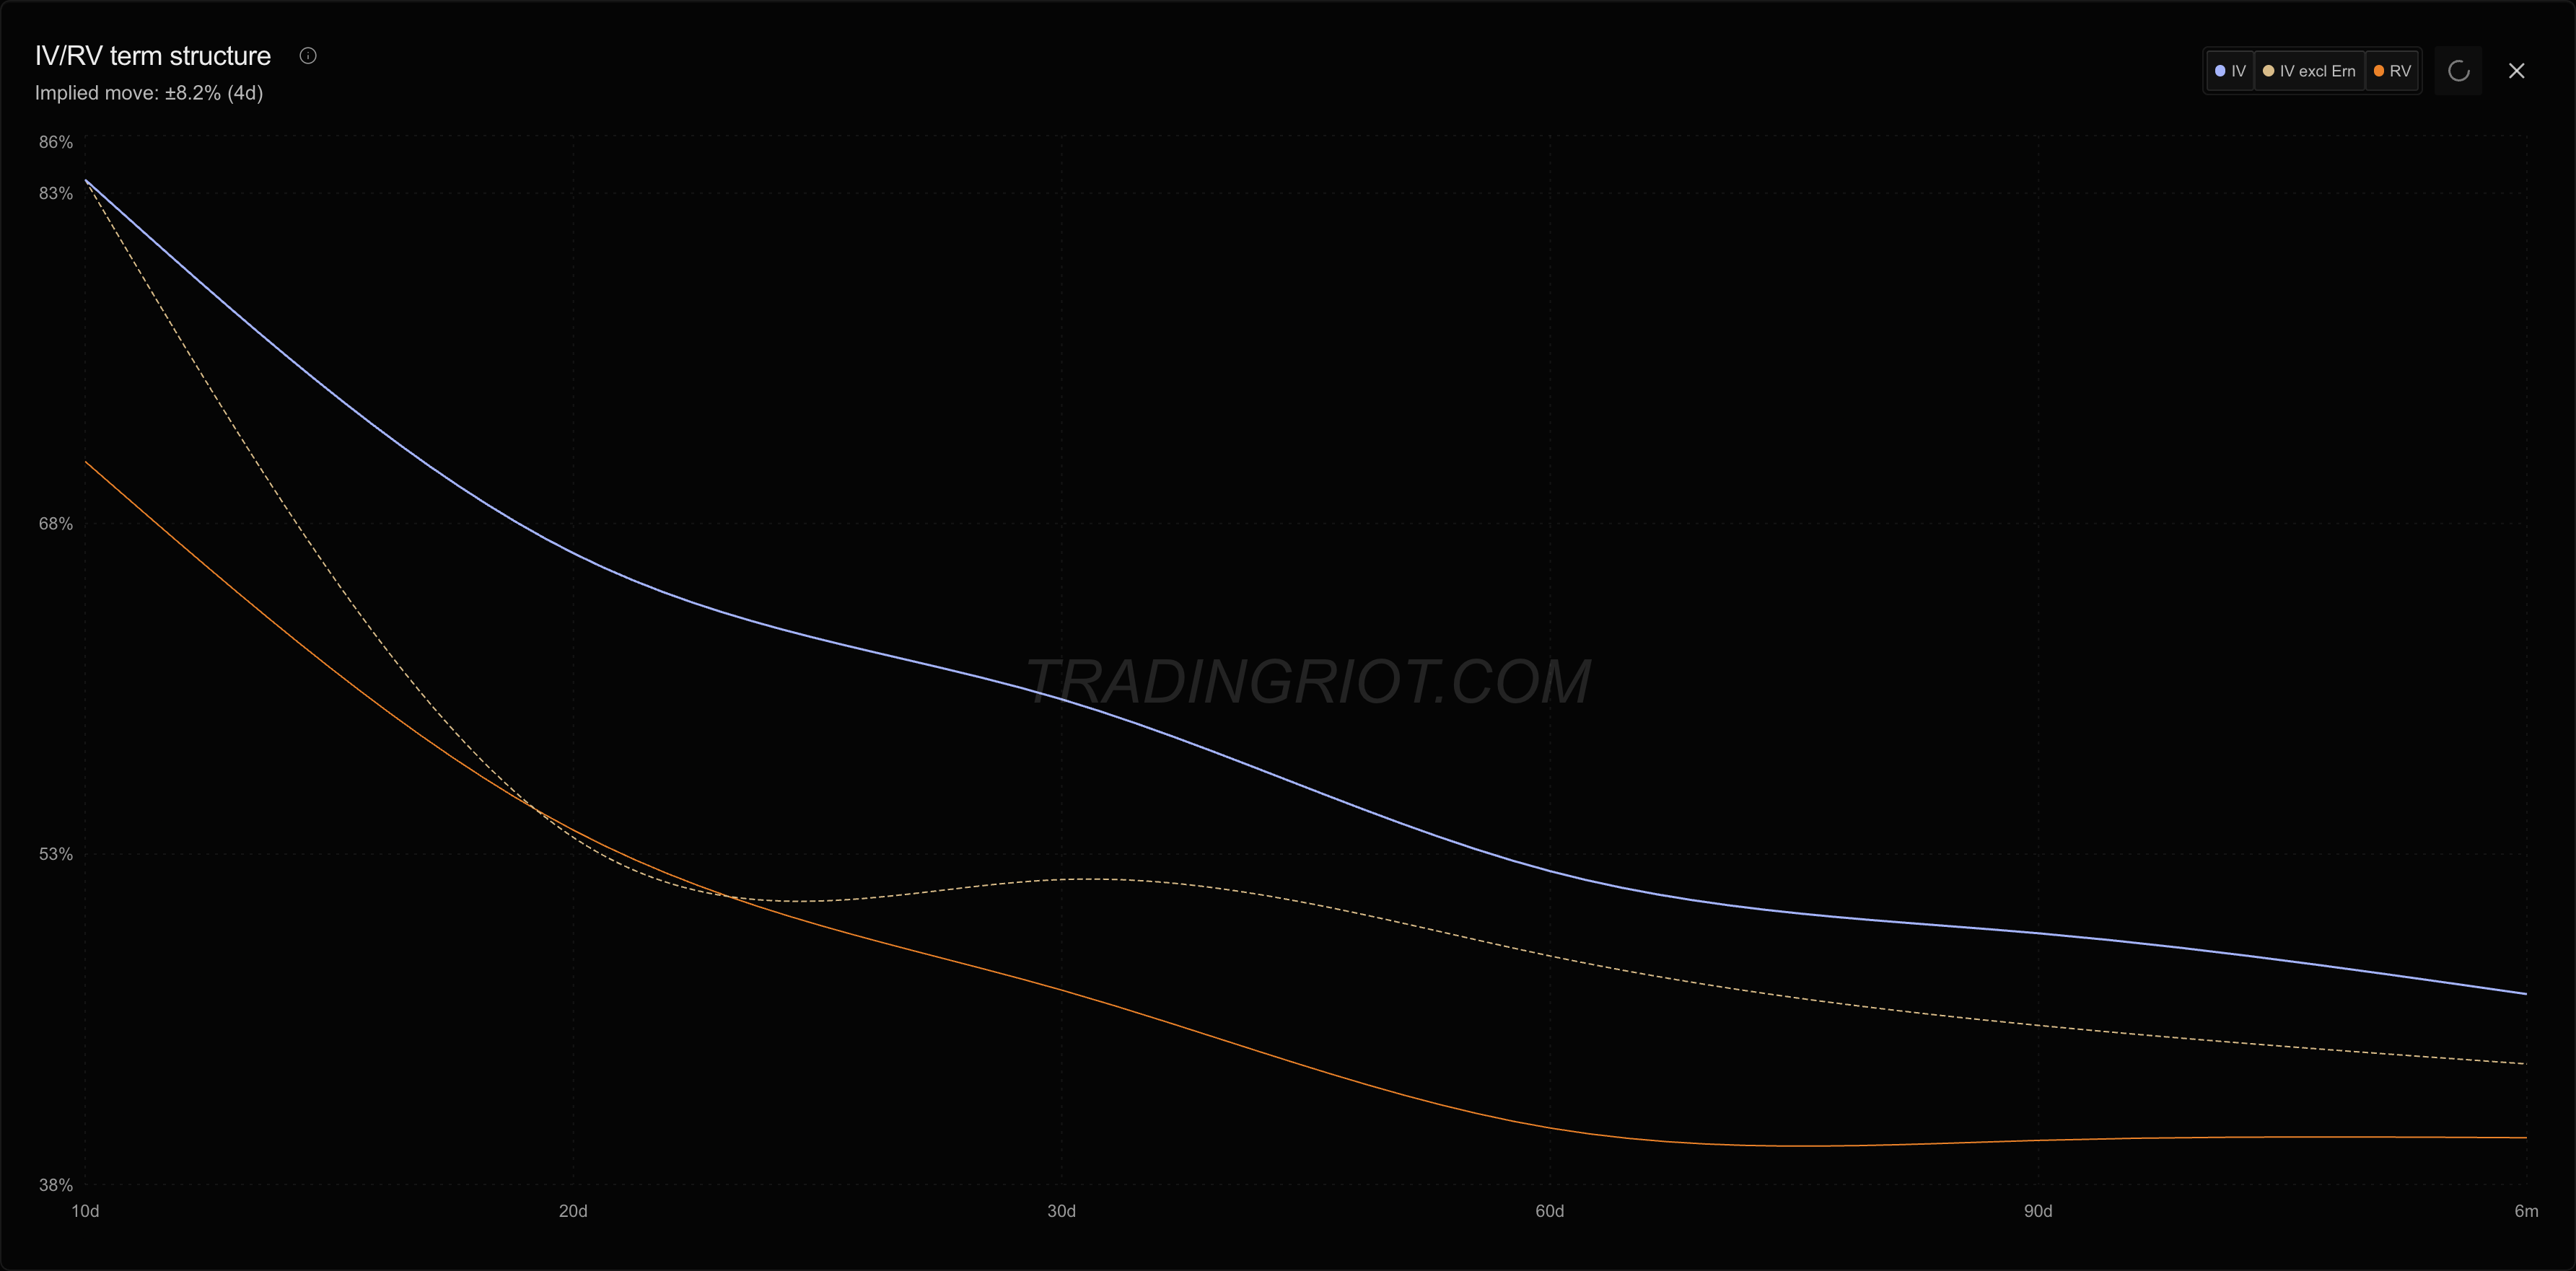
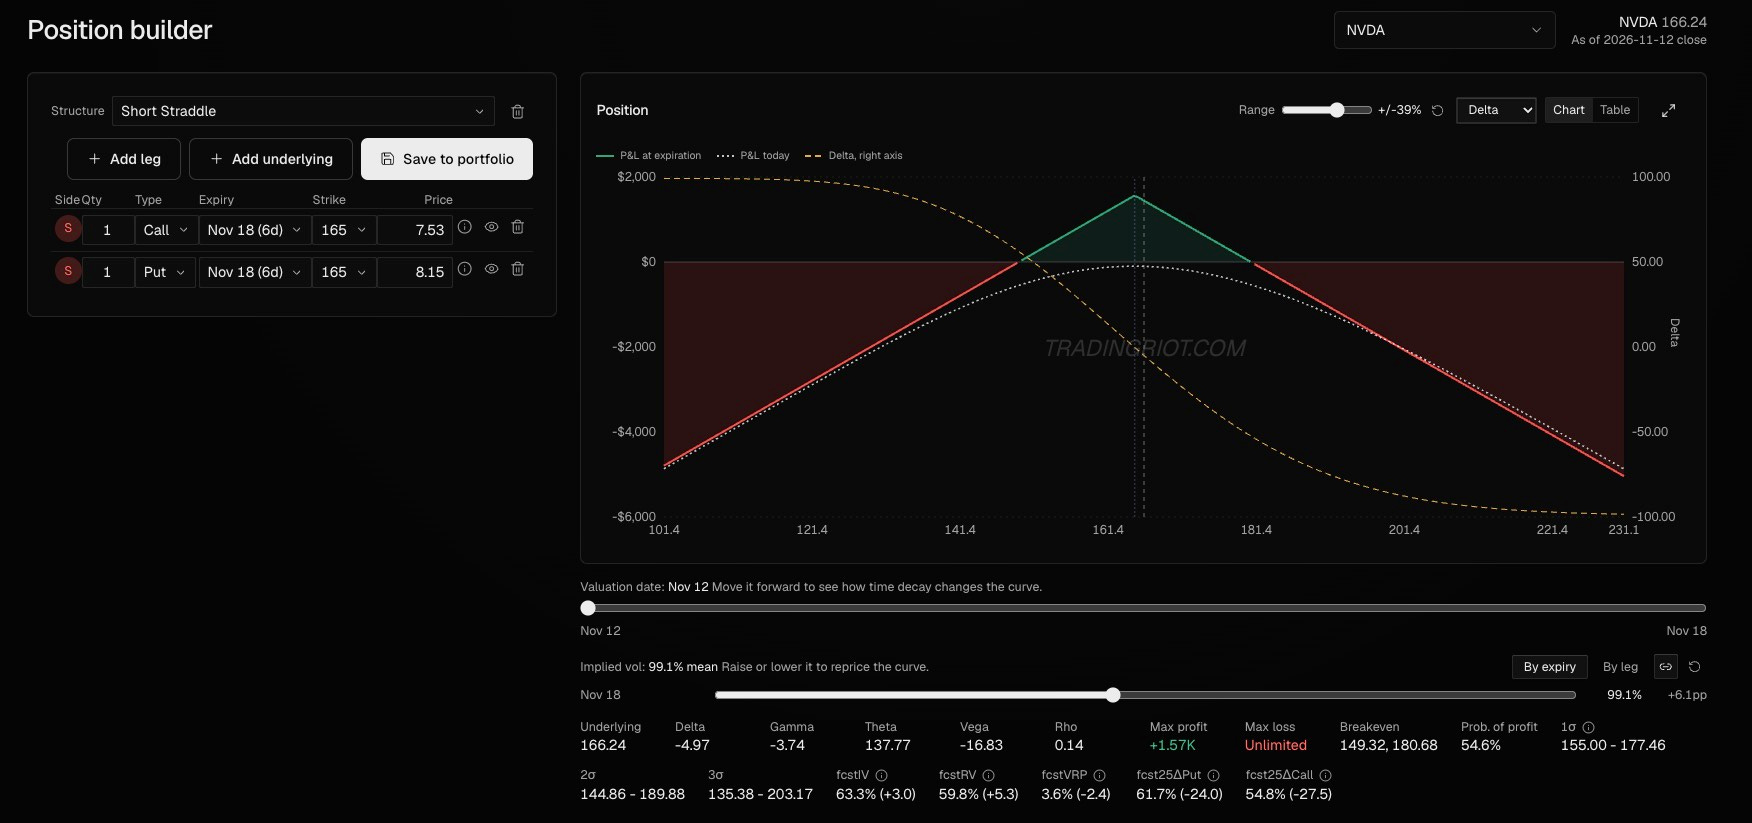
Like NVDA, for example, the term structure is not only rich in front solely because Jensen Huang is a sex-demon but also because NVDA reports earnings four days from now.
Currently the market is pricing ~8% implied move over the earnings event, but you can notice on the screenshot below that historically price moves only about ~5.5% over the event. You can also see that more often than not, price stays within the expected move range over the last decade.
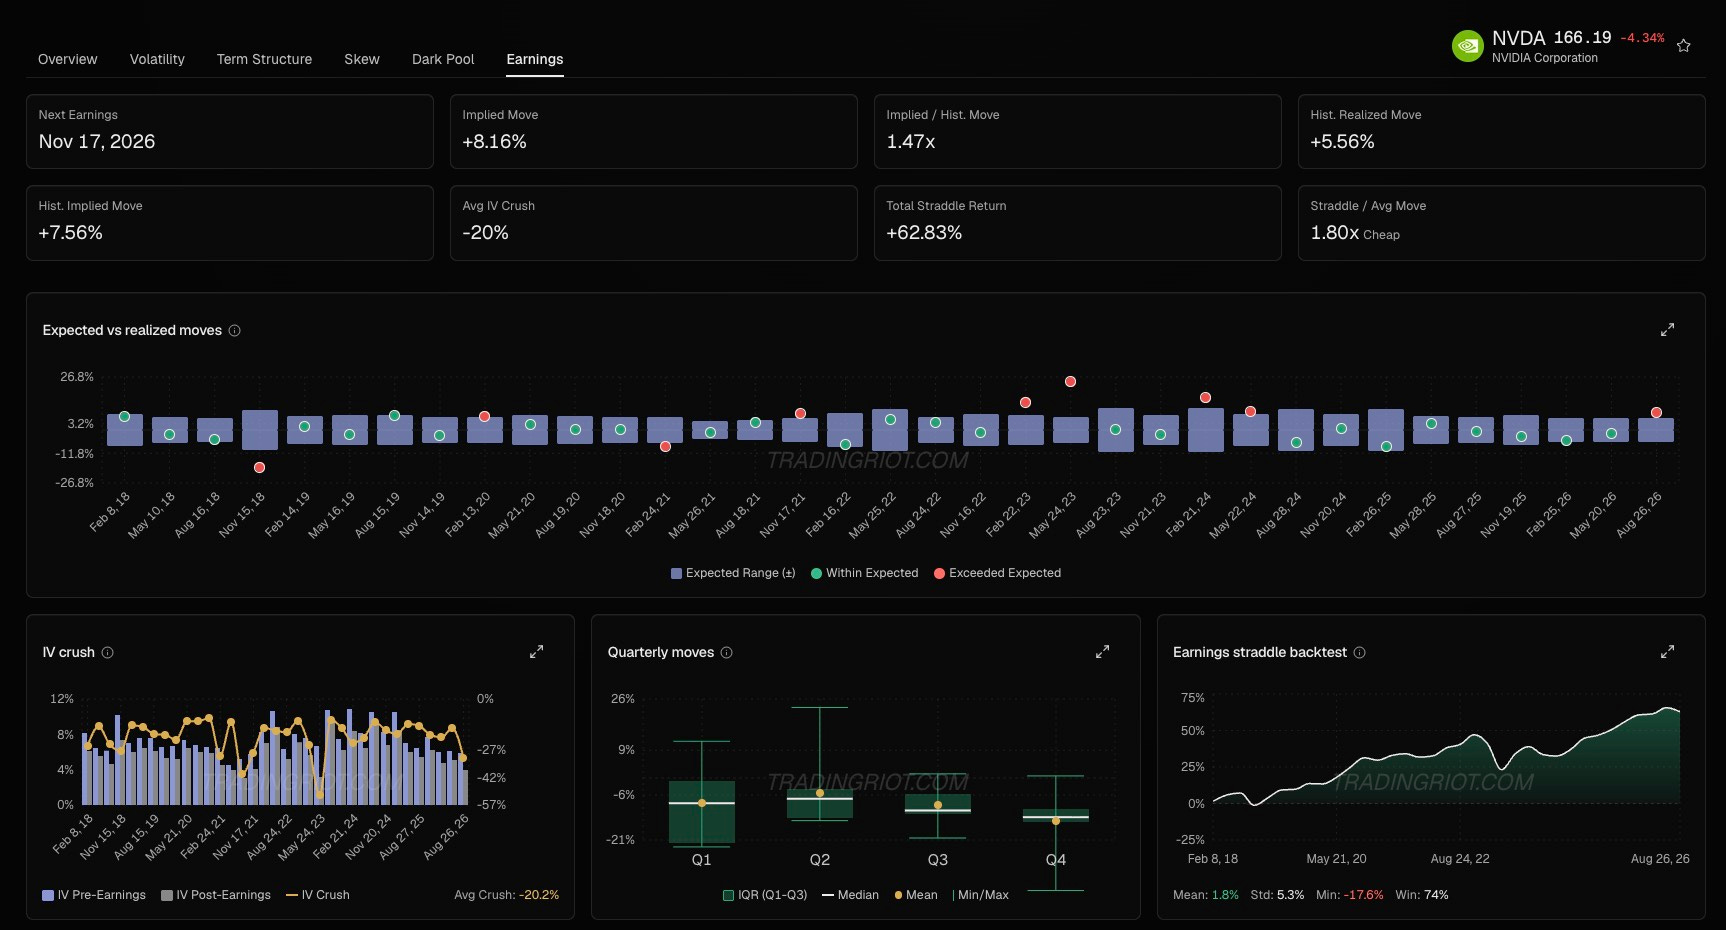
This means that if I sell a straddle expiring one day after the earnings, my breakeven is more or less what the market expects to realize during the earnings, and I make money if anything less than that ends up happening. I will come back to earnings later, but first let’s start with macro events.
Macro events
Starting with probably the most obvious one, news like FOMC, CPI, or NFP are always the most important releases in our lives (until the next one).
For the simplicity’s sake of this article, we will focus on FOMC in the most likely two most-impacted markets, SPY and TLT.
First, I think it is good to understand that trading these meetings in SPY can be equivalent to day-trading ES futures. These are one of the most watched events, so it is very much expected these will be priced accurately, and there is not that much miss-pricing compared to more idiosyncratic markets like single stocks.
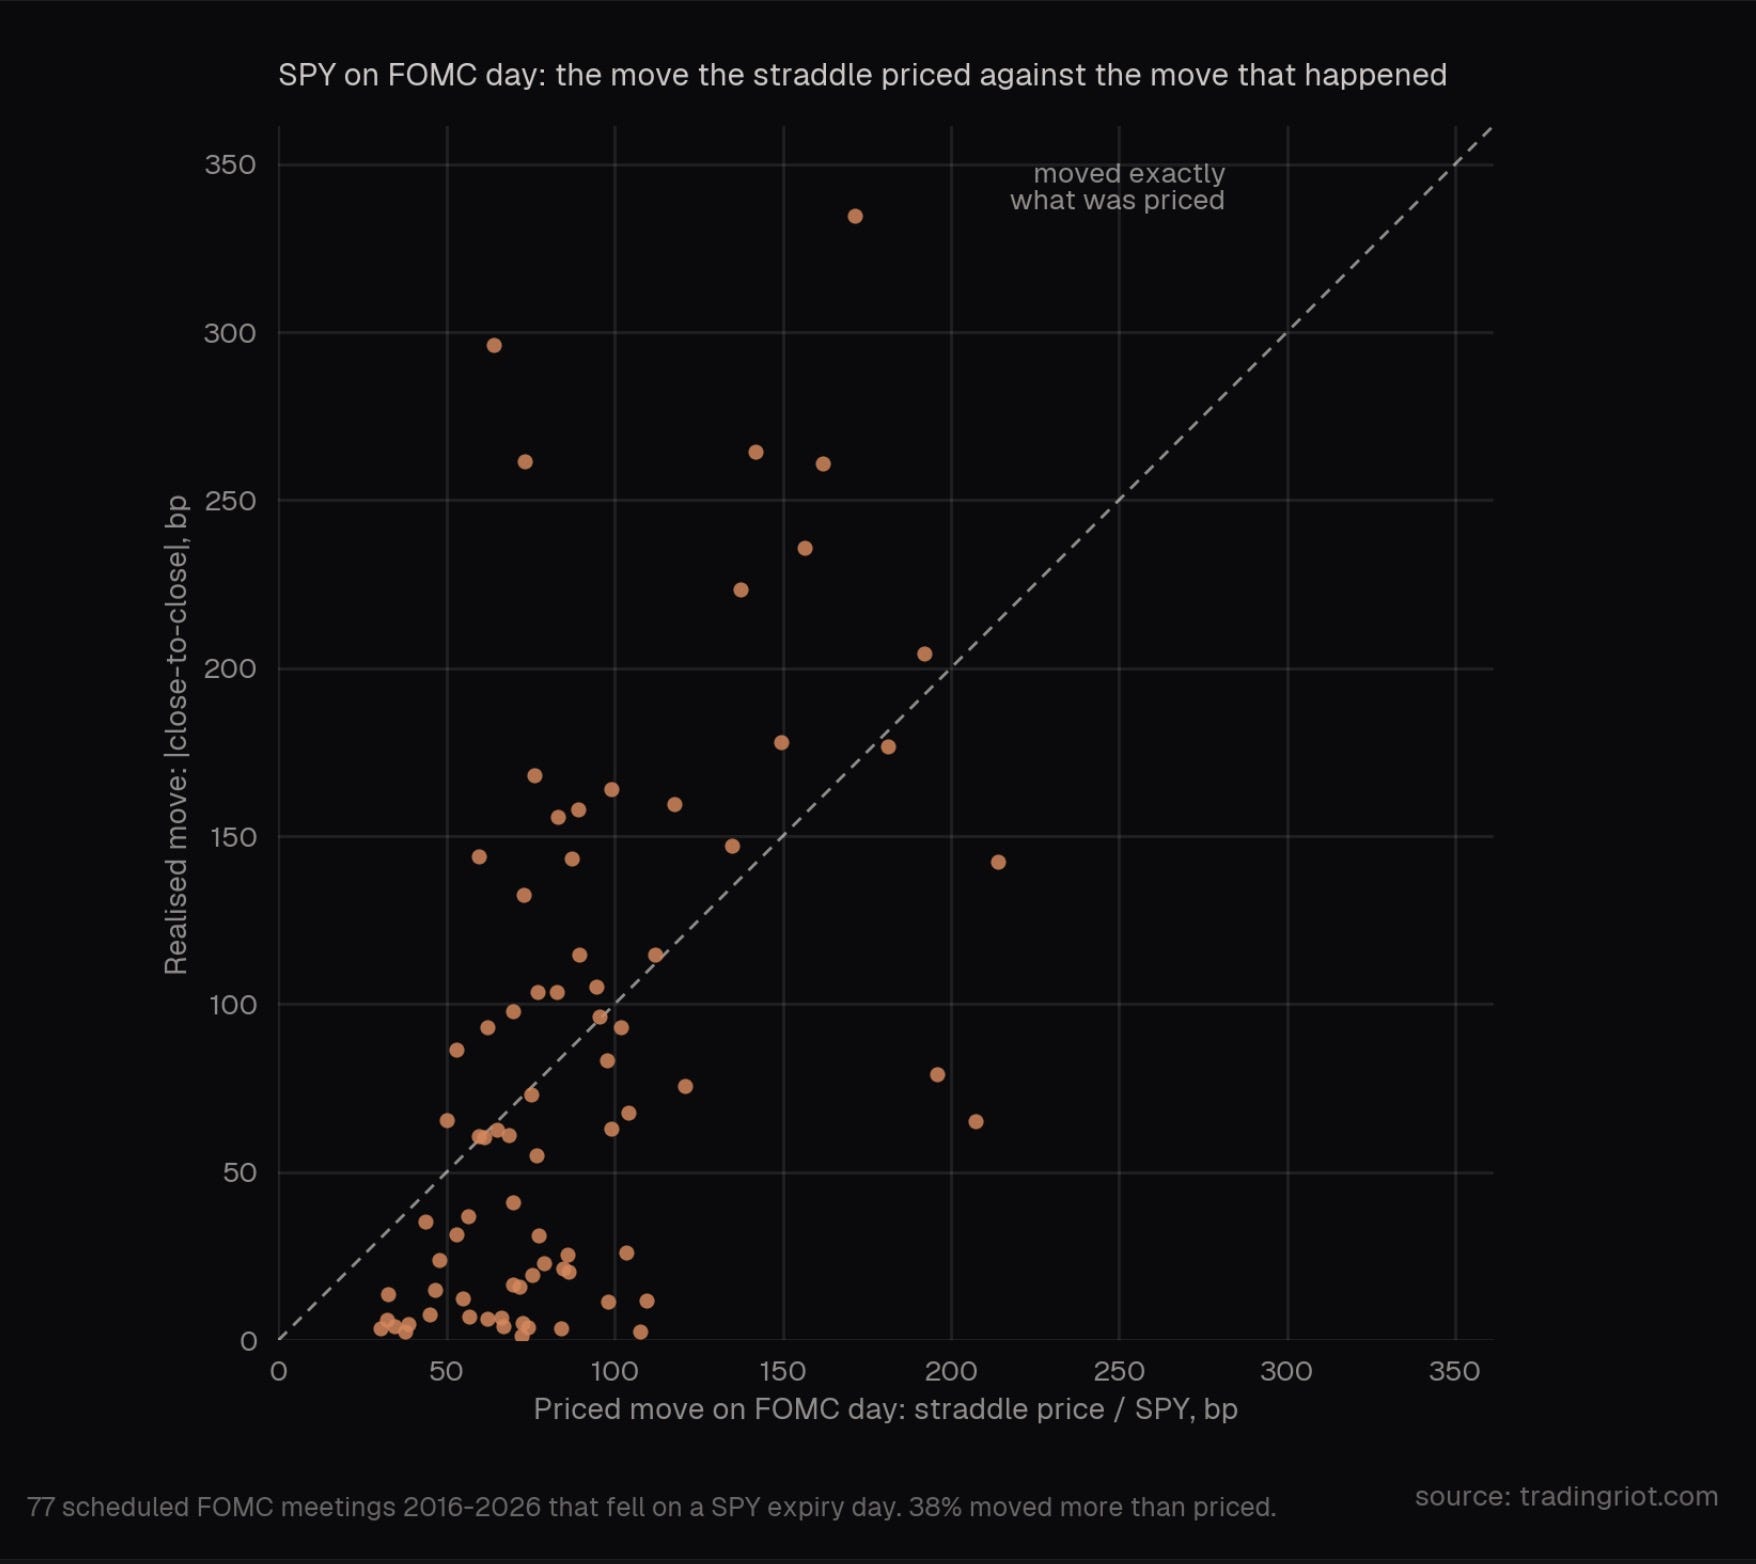
Over the seventy-one FOMC events from 2016, the average meeting priced 90 bp and moved 85 bp, so it lands almost on the line. Individual meetings scatter widely, though. Many were quiet, a handful moved two to three times what was priced, and 38% moved more than priced. So the market is accurate on average without knowing which meetings will be wild.
Since the majority of meetings moved under the expected move, we can now test selling a straddle over the event compared to any random day.
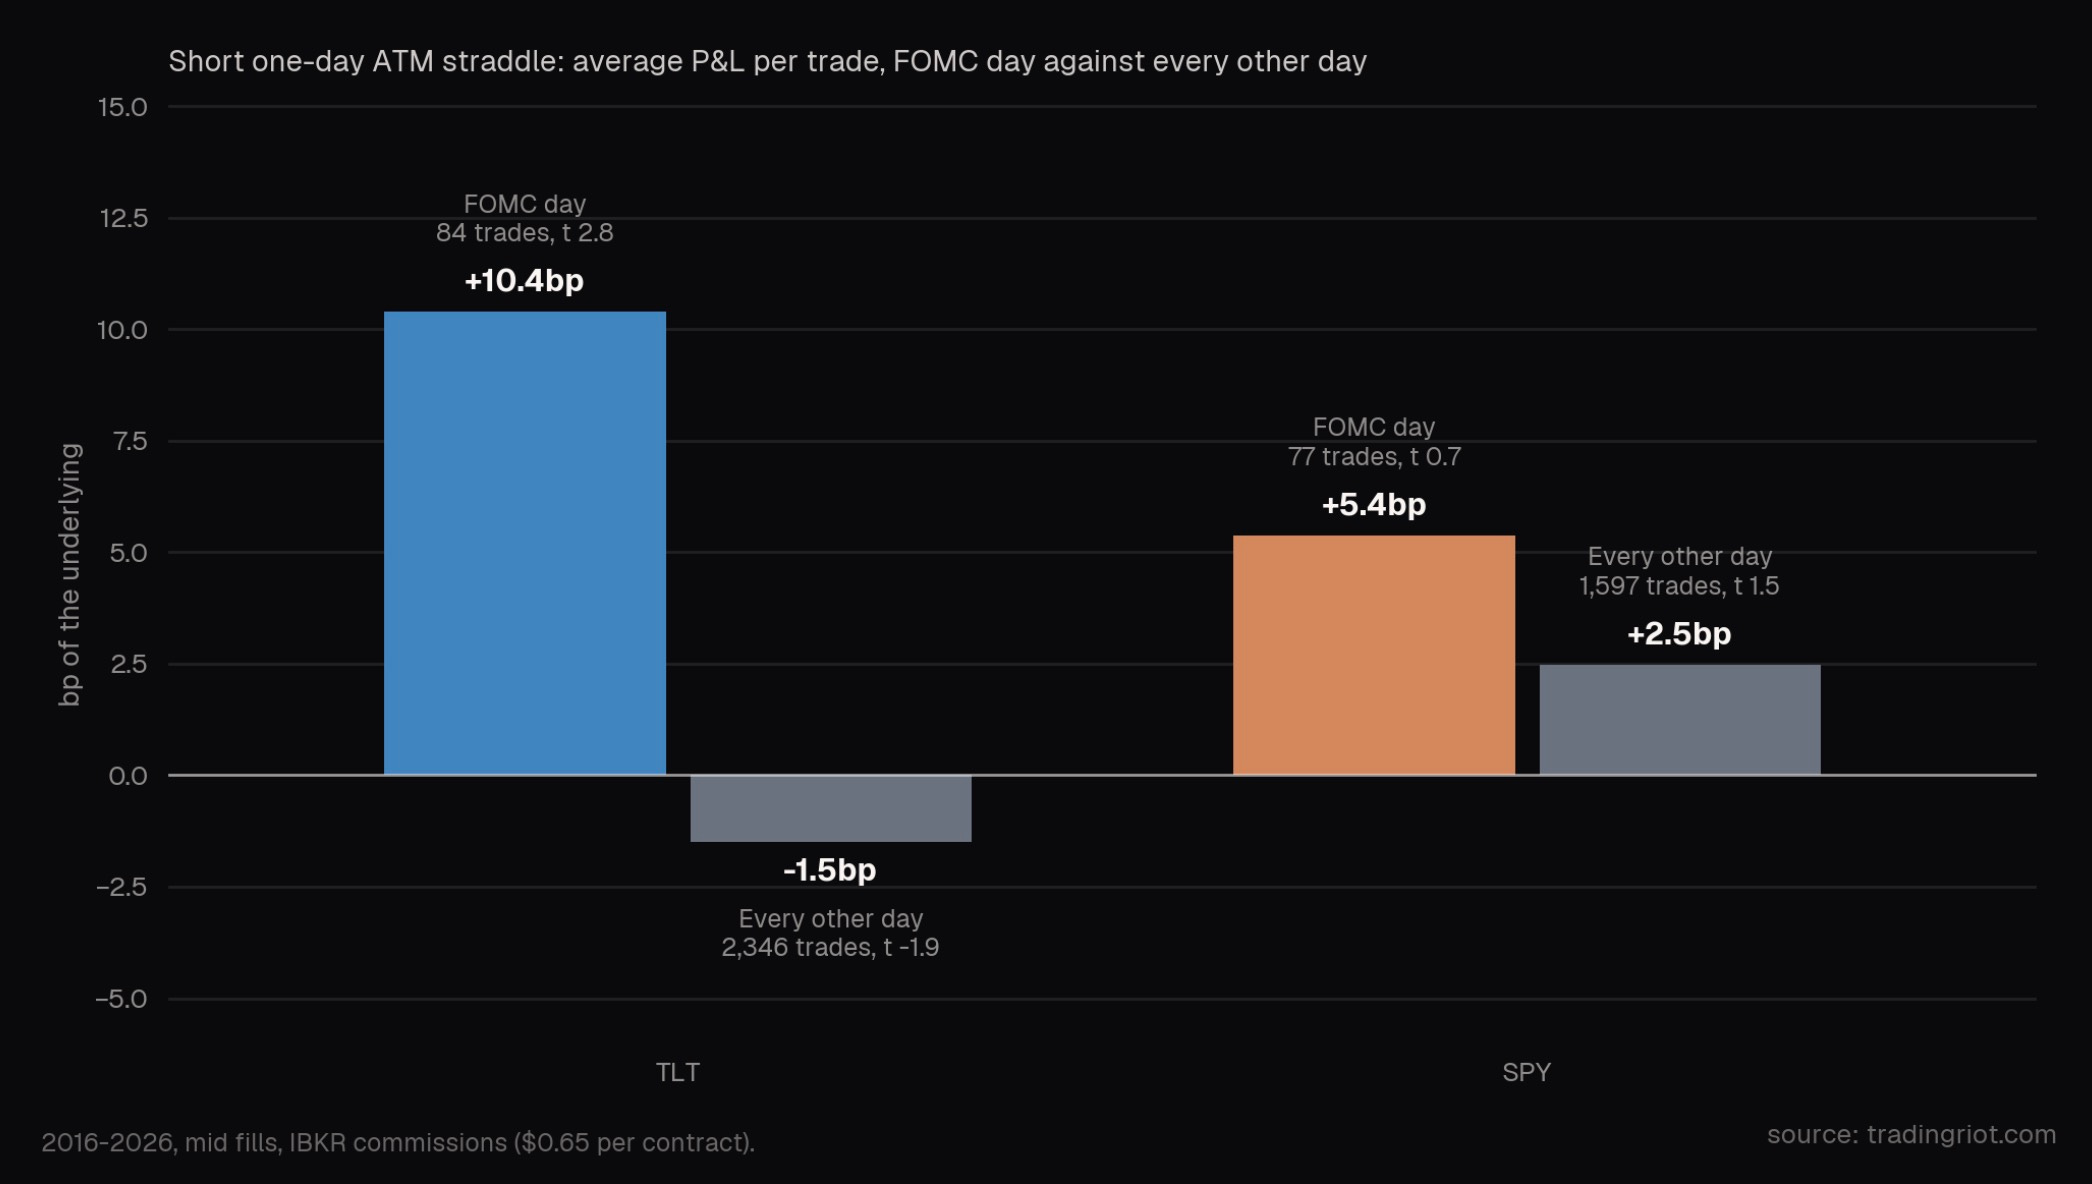
As you can see, the edge in TLT is more significant compared to SPY. Selling a TLT straddle on a random day loses money once you pay the commissions. Selling it over the Fed made significantly more after costs and won three times out of four. The rate decision lands squarely on Treasuries, so that’s where people are most scared of it and where they overpay for protection.
SPY over FOMC made a little more than on a normal expiry day.. As I mentioned, the SPY straddle into the meeting priced on average what the market delivered, which shows the options market doing its job, and you can’t sell insurance that’s already priced fairly.
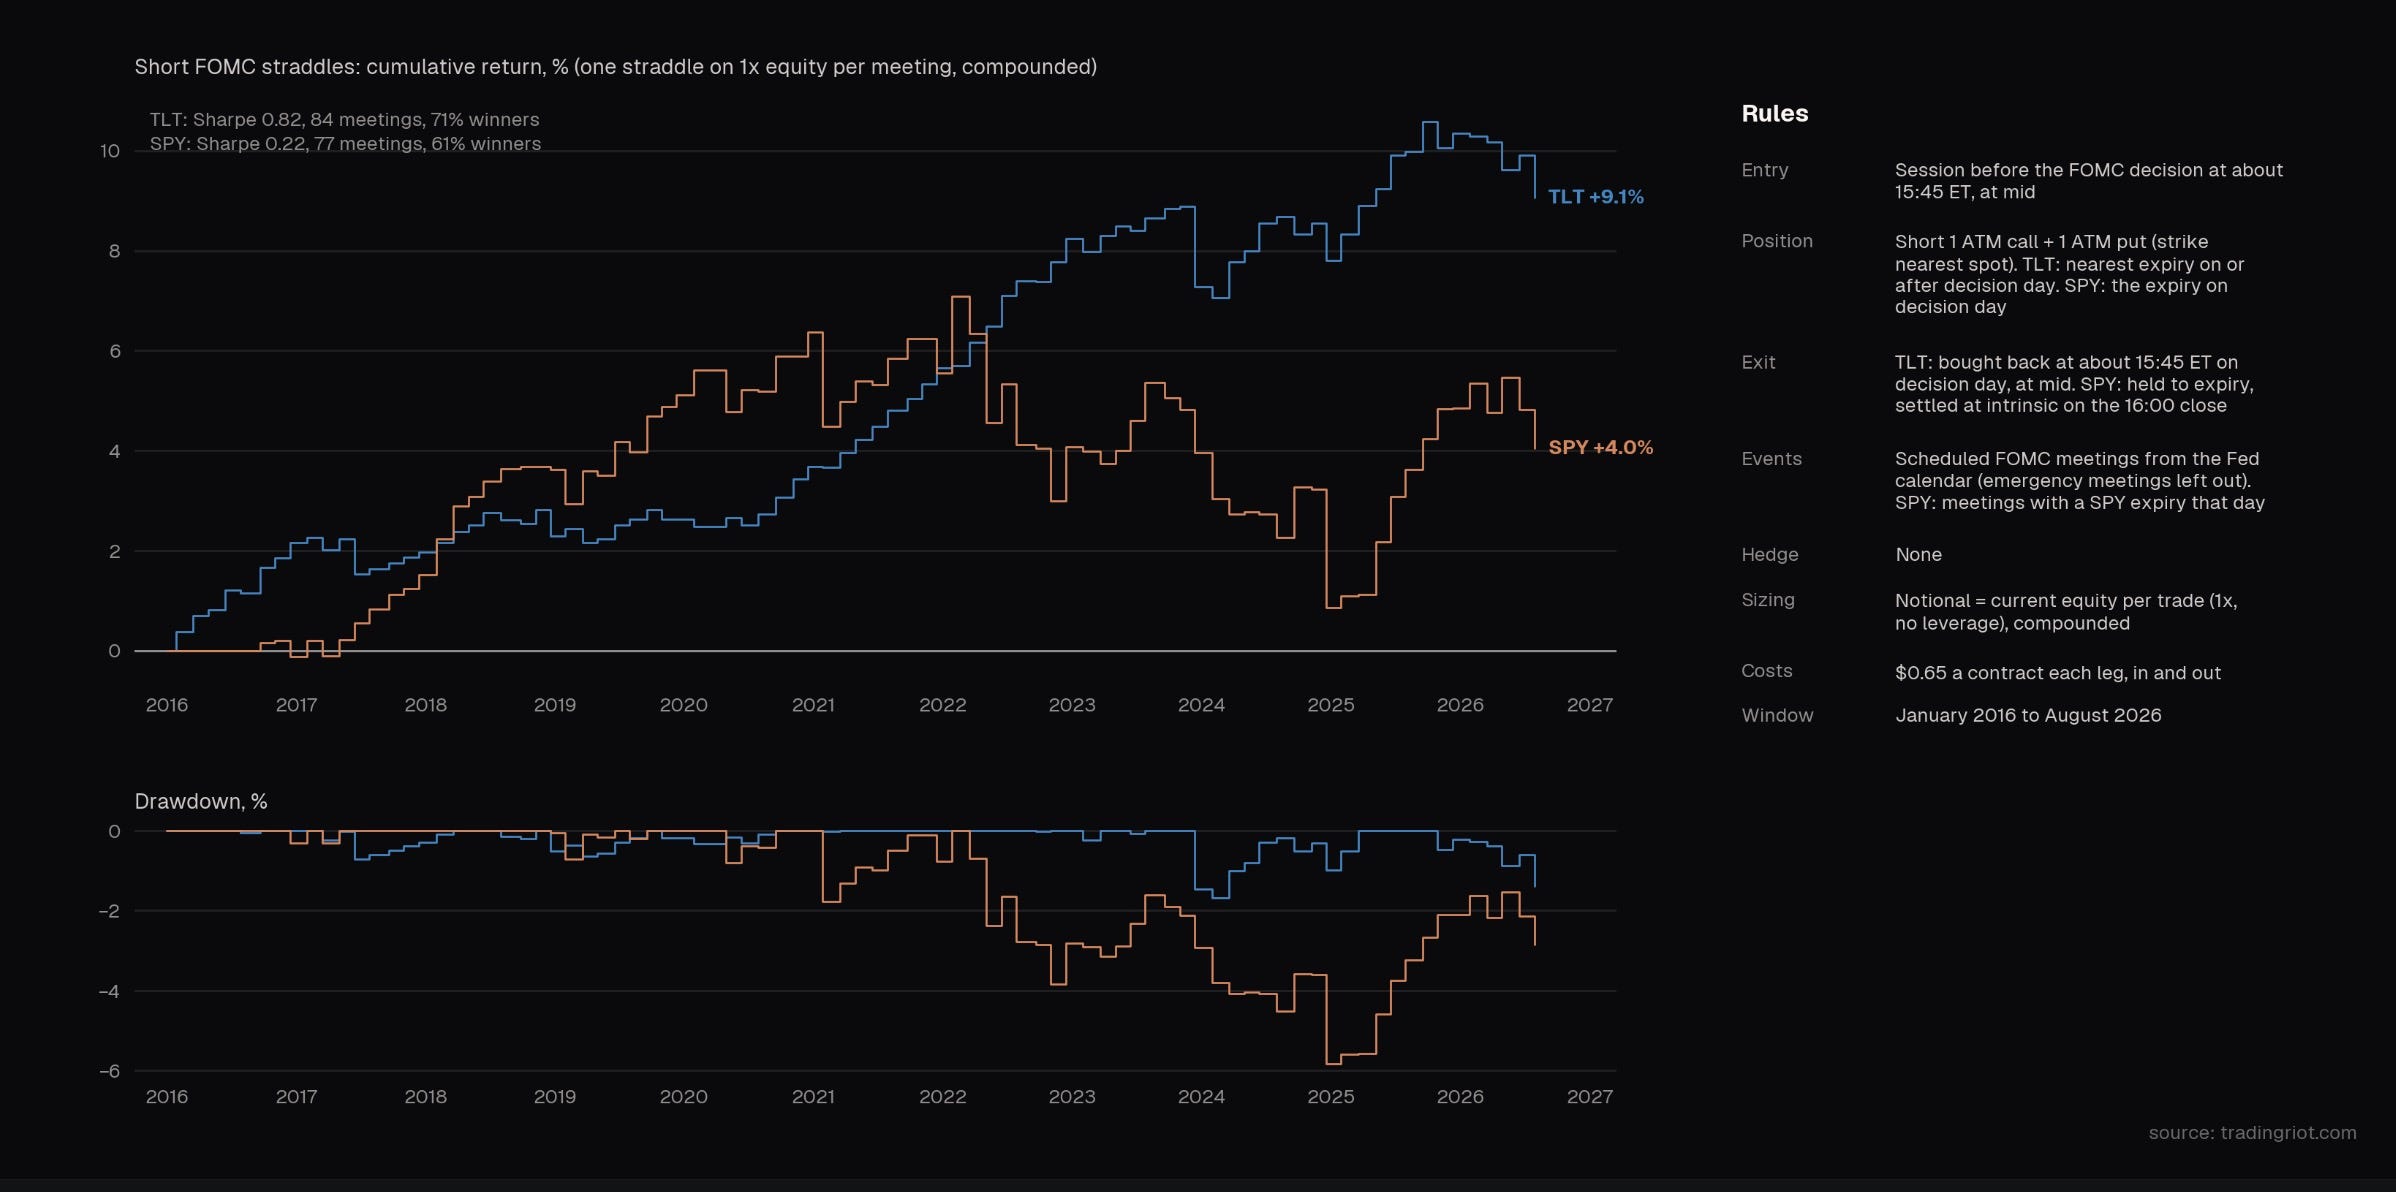
Selling the earnings volatility
While the big markets are priced efficiently, there is much bigger disagreement in single stocks; the chart below shows an earning season from this summer for approximately 700 names. While there were a good chunk of large surprises, you can see that the majority of moves were realized below implied.
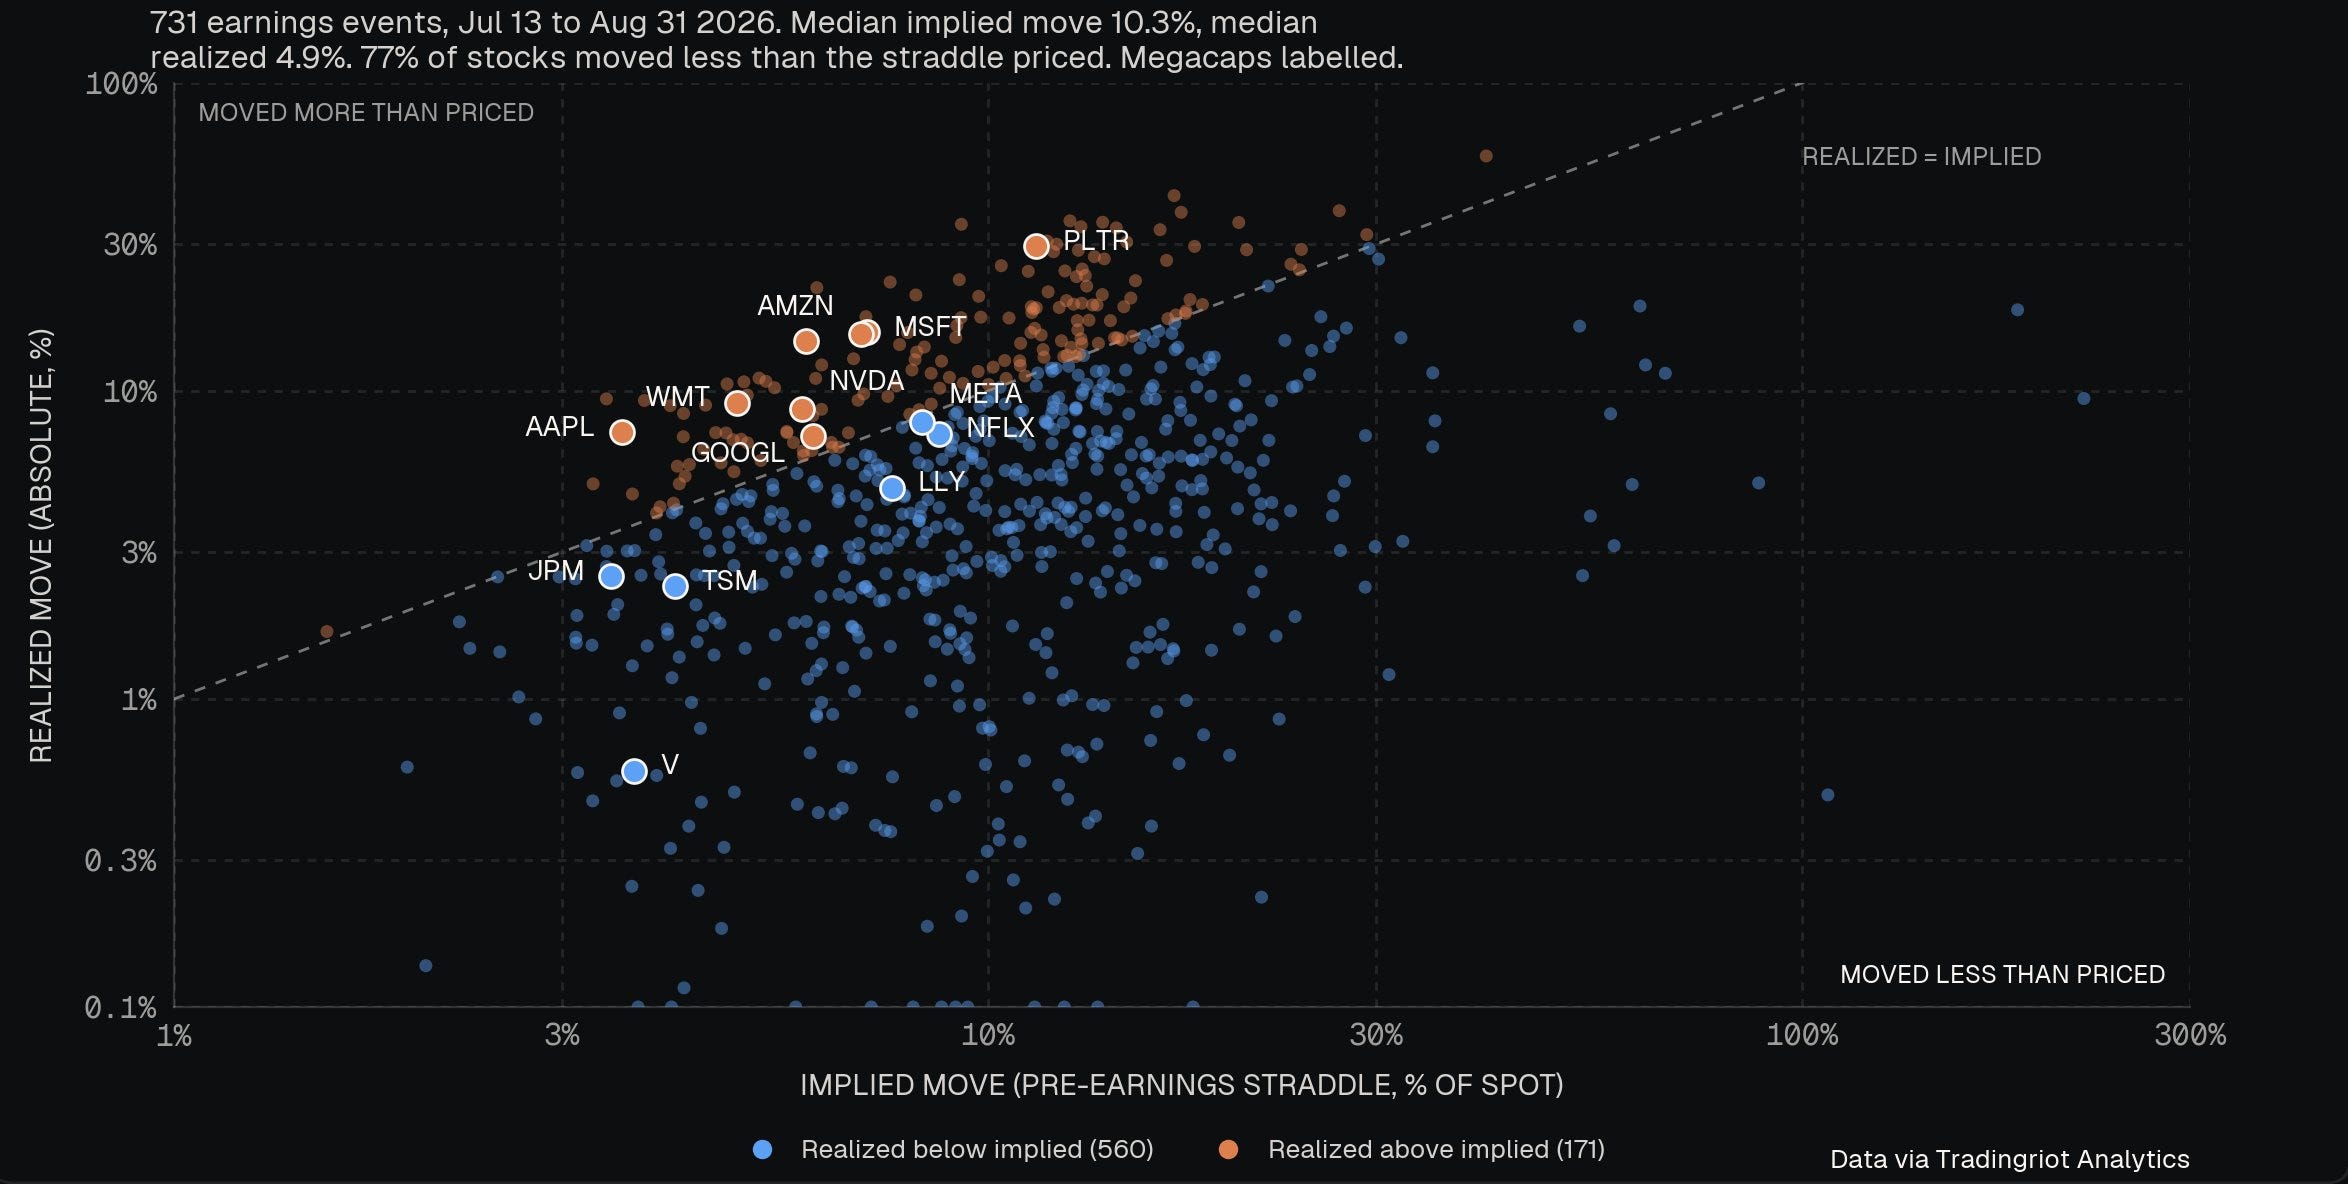
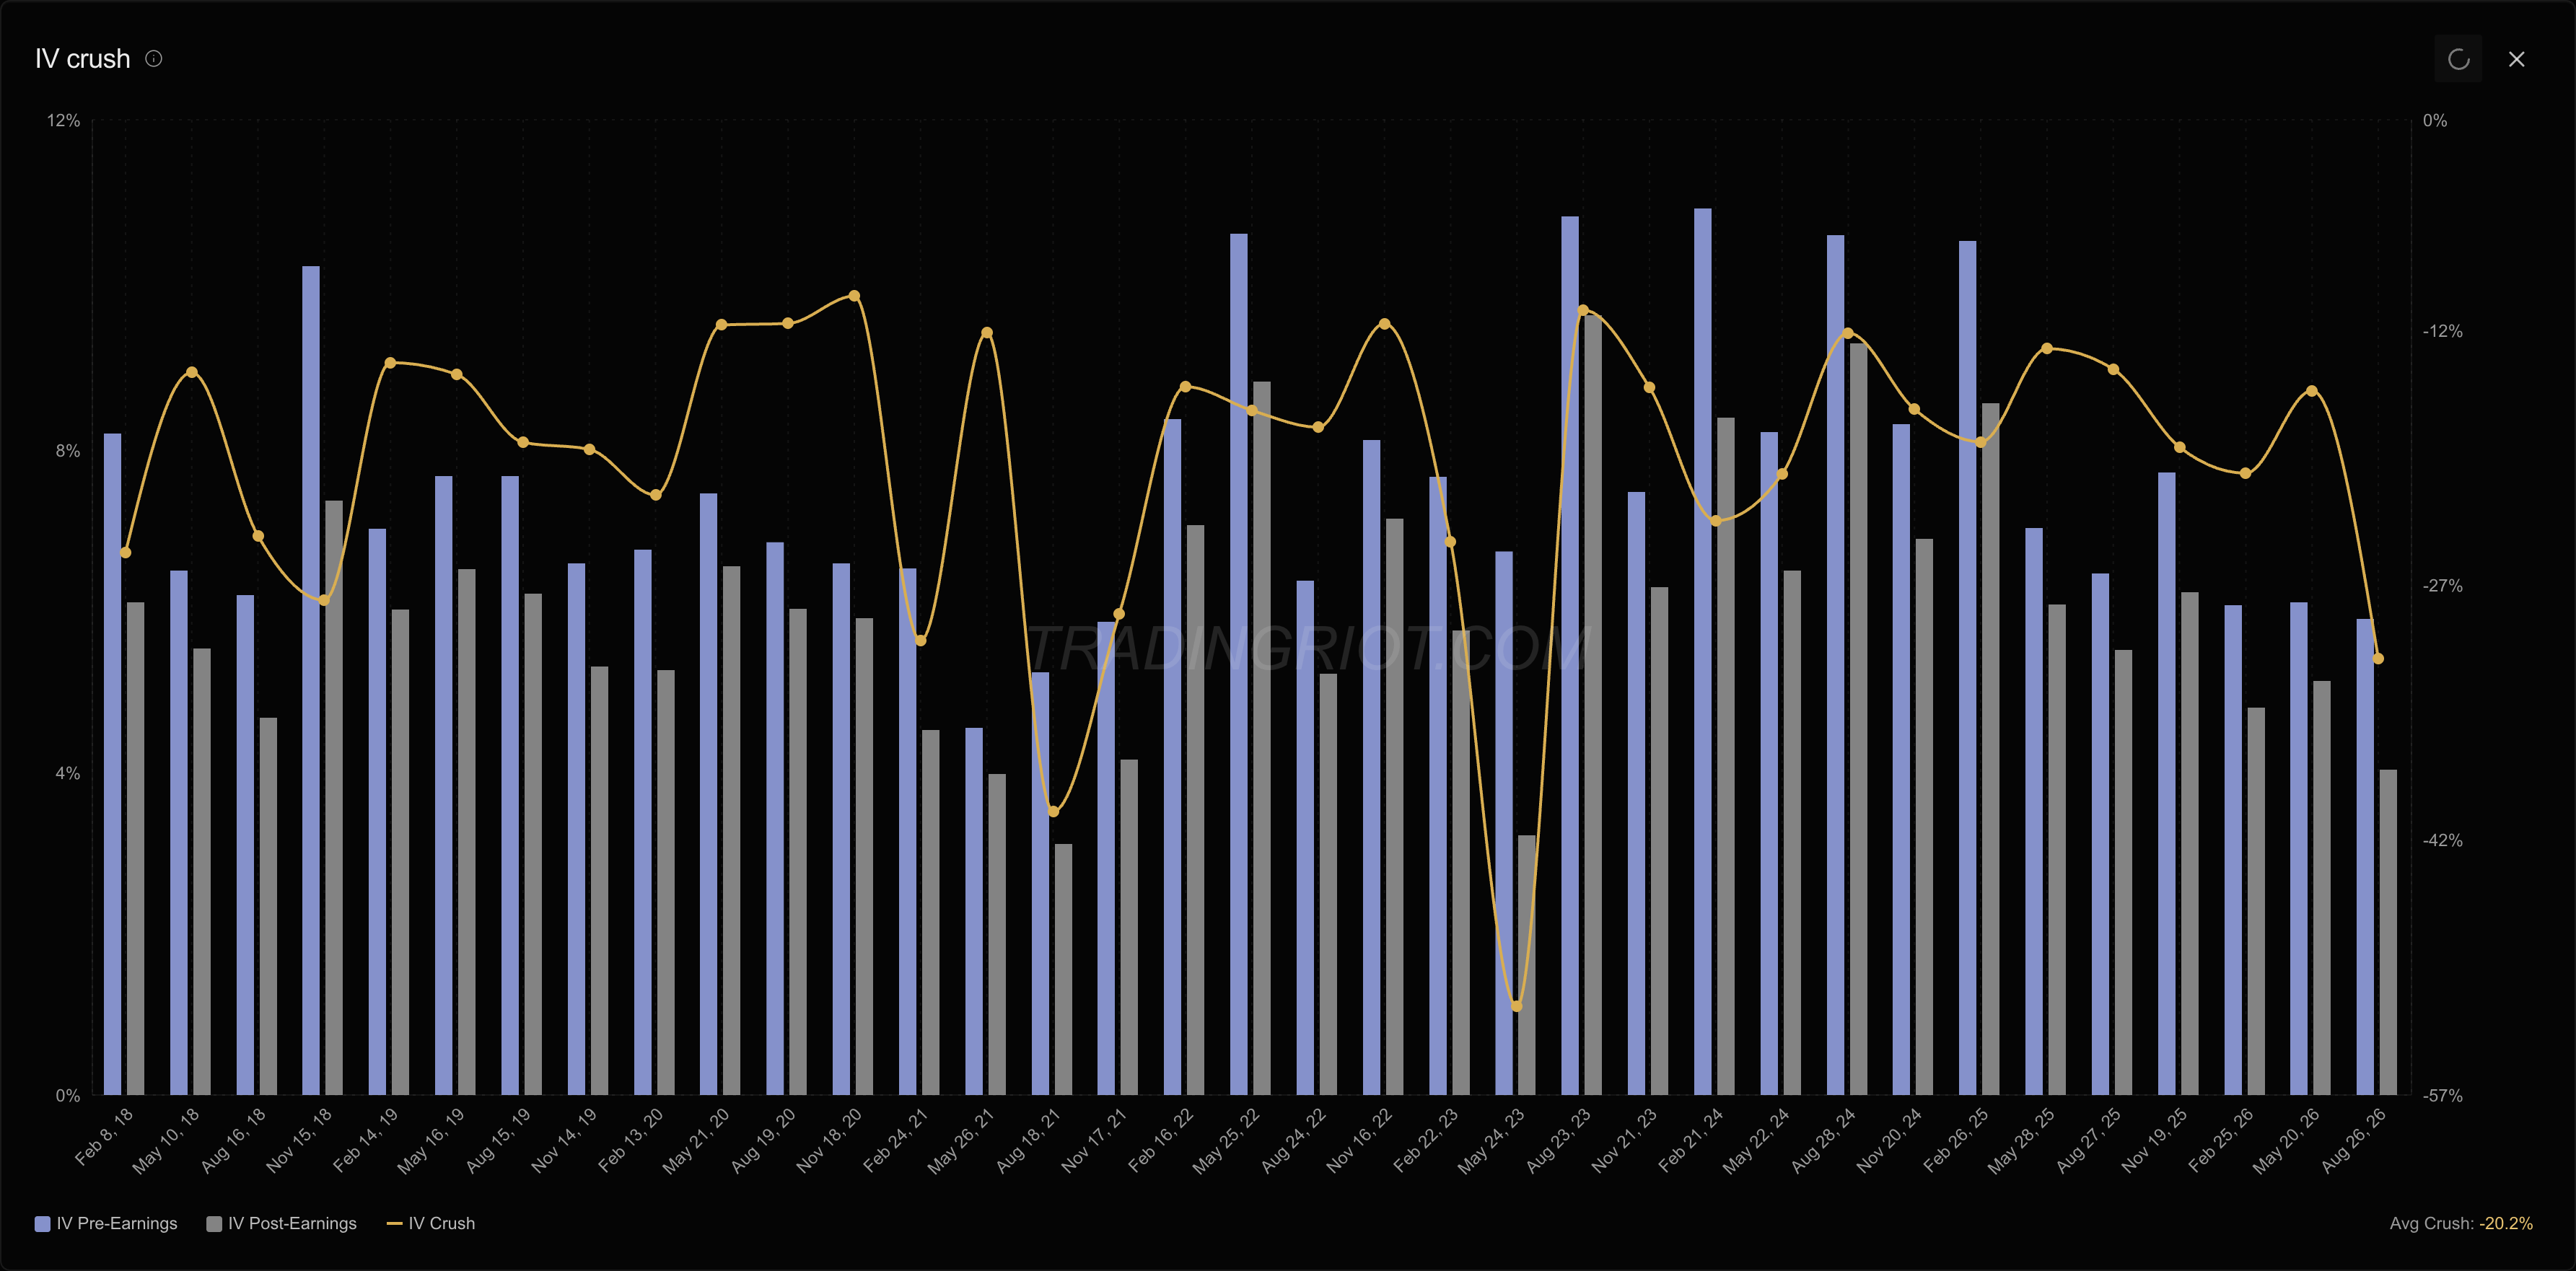
This pattern has been studied since the late 1970s: implied volatility increases in the weeks leading up to an earnings announcement, peaks just before the event, and drops sharply once the numbers drop. This is the famous “IV crush,” and it’s also why it sucks to buy options into the event since the implied volatility is elevated and the market has to deliver a much bigger move to compensate for that crush.
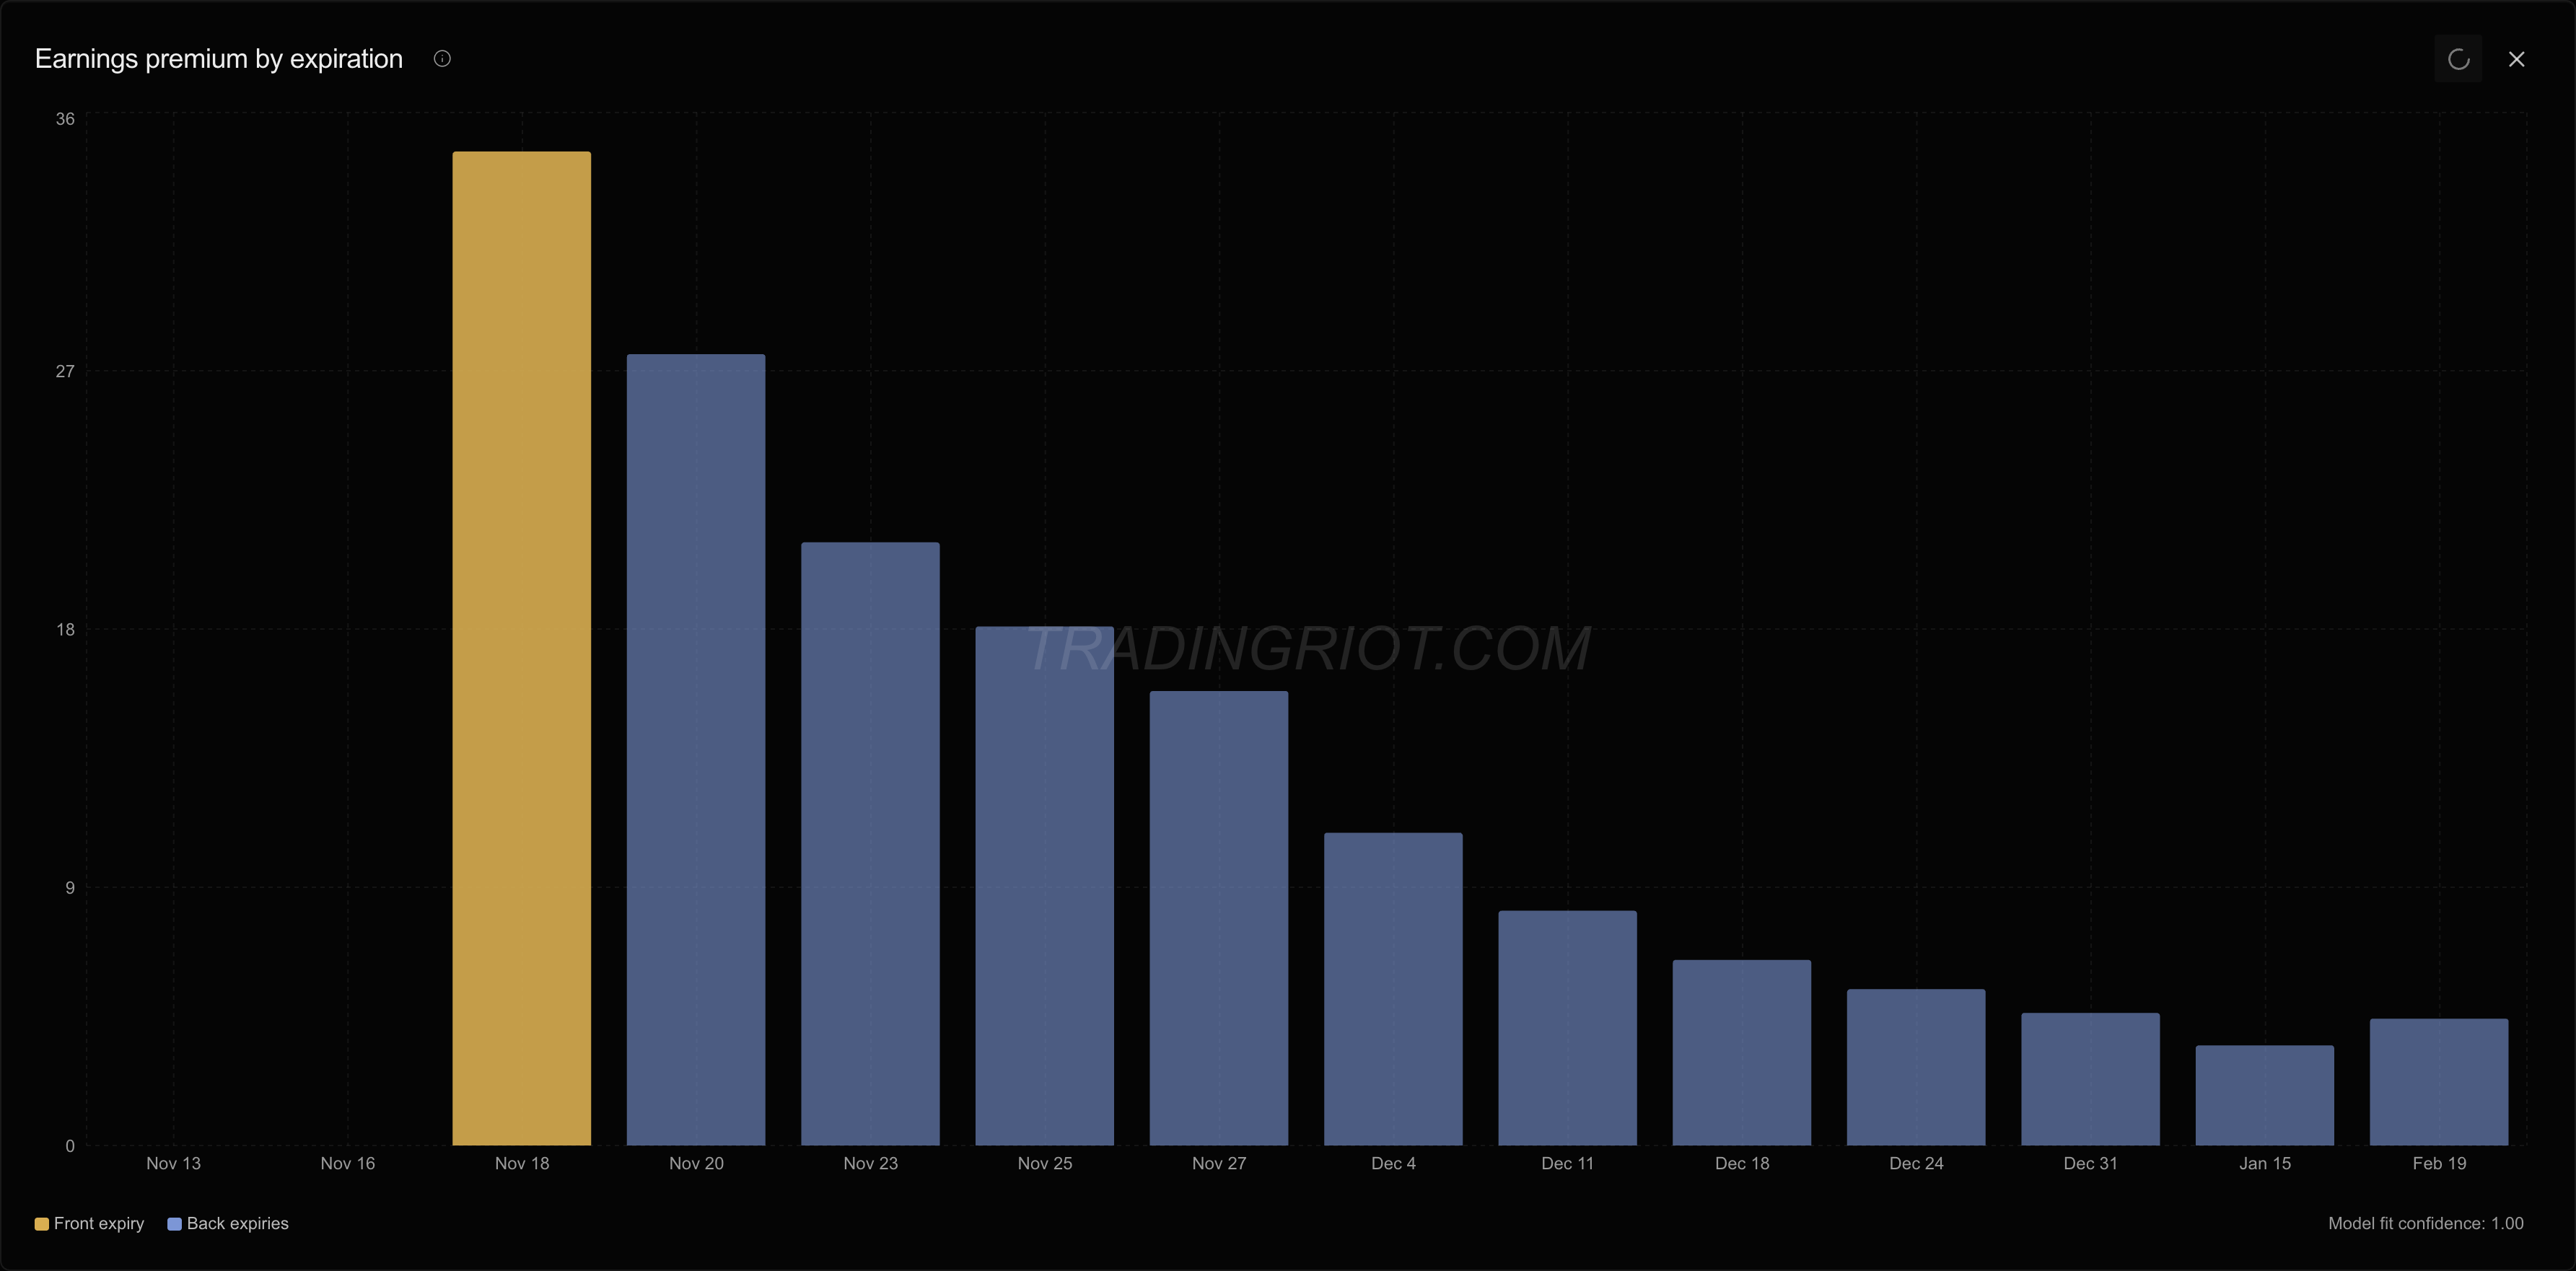
The chart above shows where that premium actually is. The front expiry right after the report carries most of the earnings premium, and every expiry after it carries less, because the same one-day jump is spread over more days. So the crush hits hardest in the front.
On average, about 20% of NVDA’s straddle value is an earnings premium that disappears the morning after. Right now the straddle prices a move of about 8%, while NVDA’s actual moves have averaged 5.5%. That 8% is your breakeven: the crush is already in the price, so the stock has to move at least as much as the market charged for.
Since we now know that options ahead of earnings are on average overpriced, and buying them sucks because you need a massive move to make money, we can start putting this into trading strategy.
The issue is that there are about 5,000 companies on NYSE that report earnings every quarter; therefore, the first logical step is to filter out only those that have liquid options markets and trade at least above $10 so we get rid of all the pennystocks.
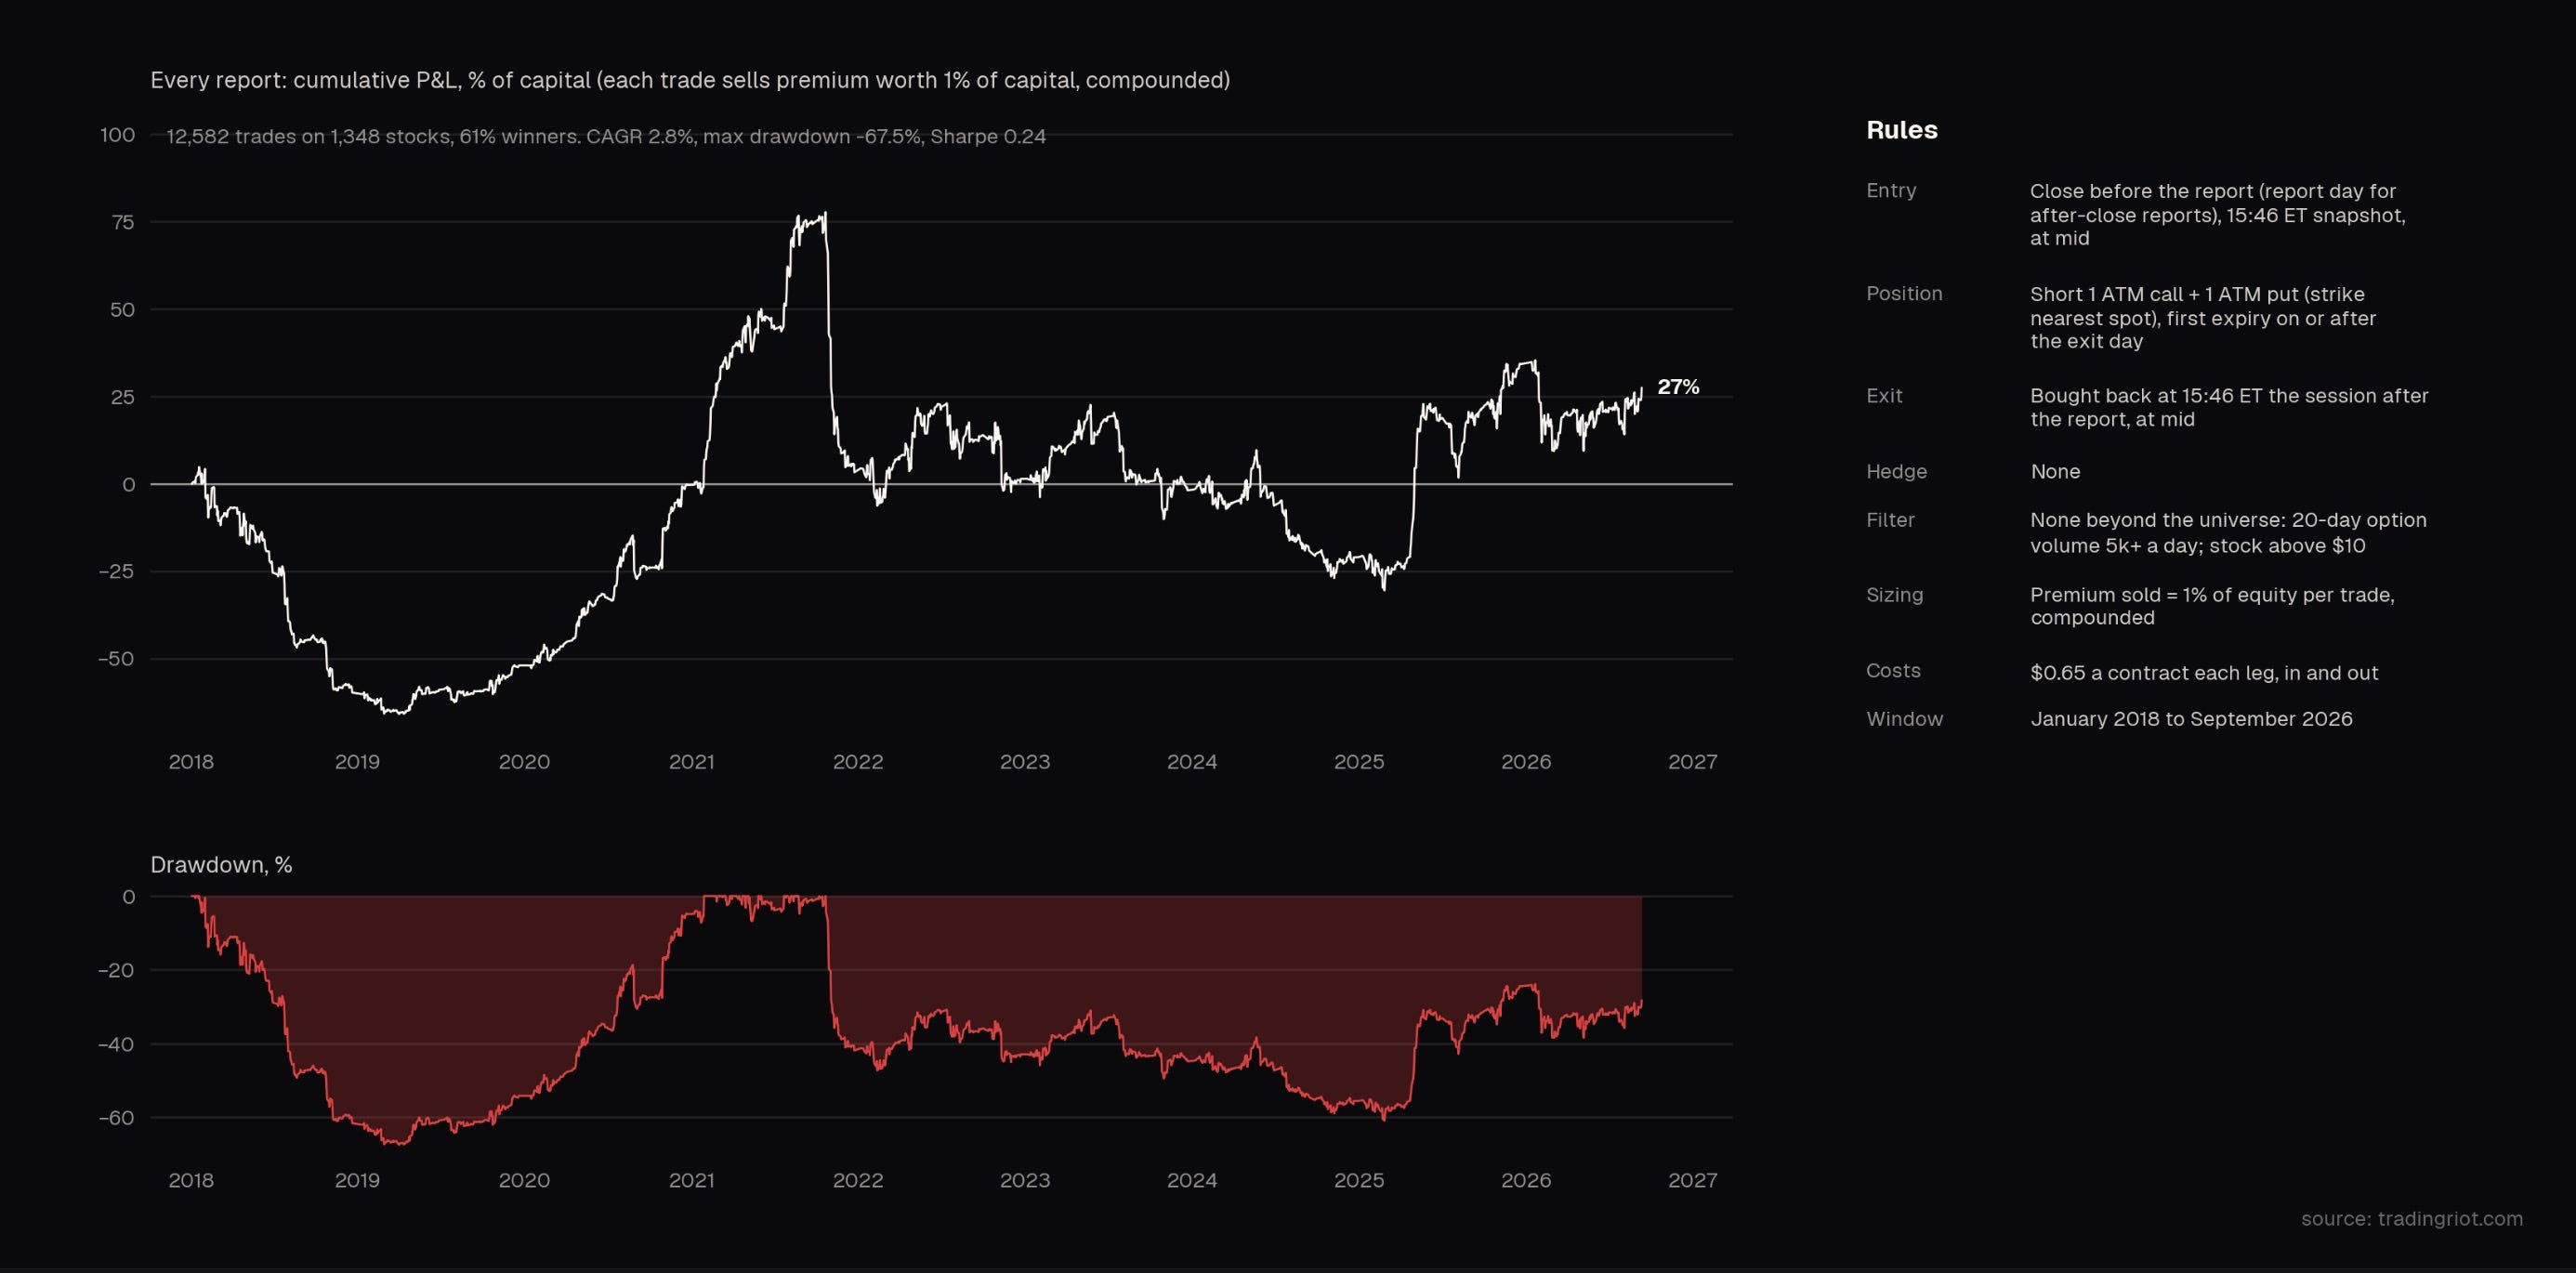
While some literature frames this trade purely as a law-of-large-numbers play where you should sell earnings vol on every single stock. I doubt that’s the best approach; not only does the equity curve look like a rollercoaster, but you are trading excessively much, making this an absolutely tedious job for not much of a return.
Remember the NVDA example? That trade looked reasonable because the implied volatility before the event was higher than the historical realized. While the outcome of any single earnings event is random, high implied volatility can be a signal that there is information we don't have. Selecting stocks that historically show higher implied than realized moves and tend to be profitable to short on earnings beats the approach of just selling volatility on everything with earnings coming up.
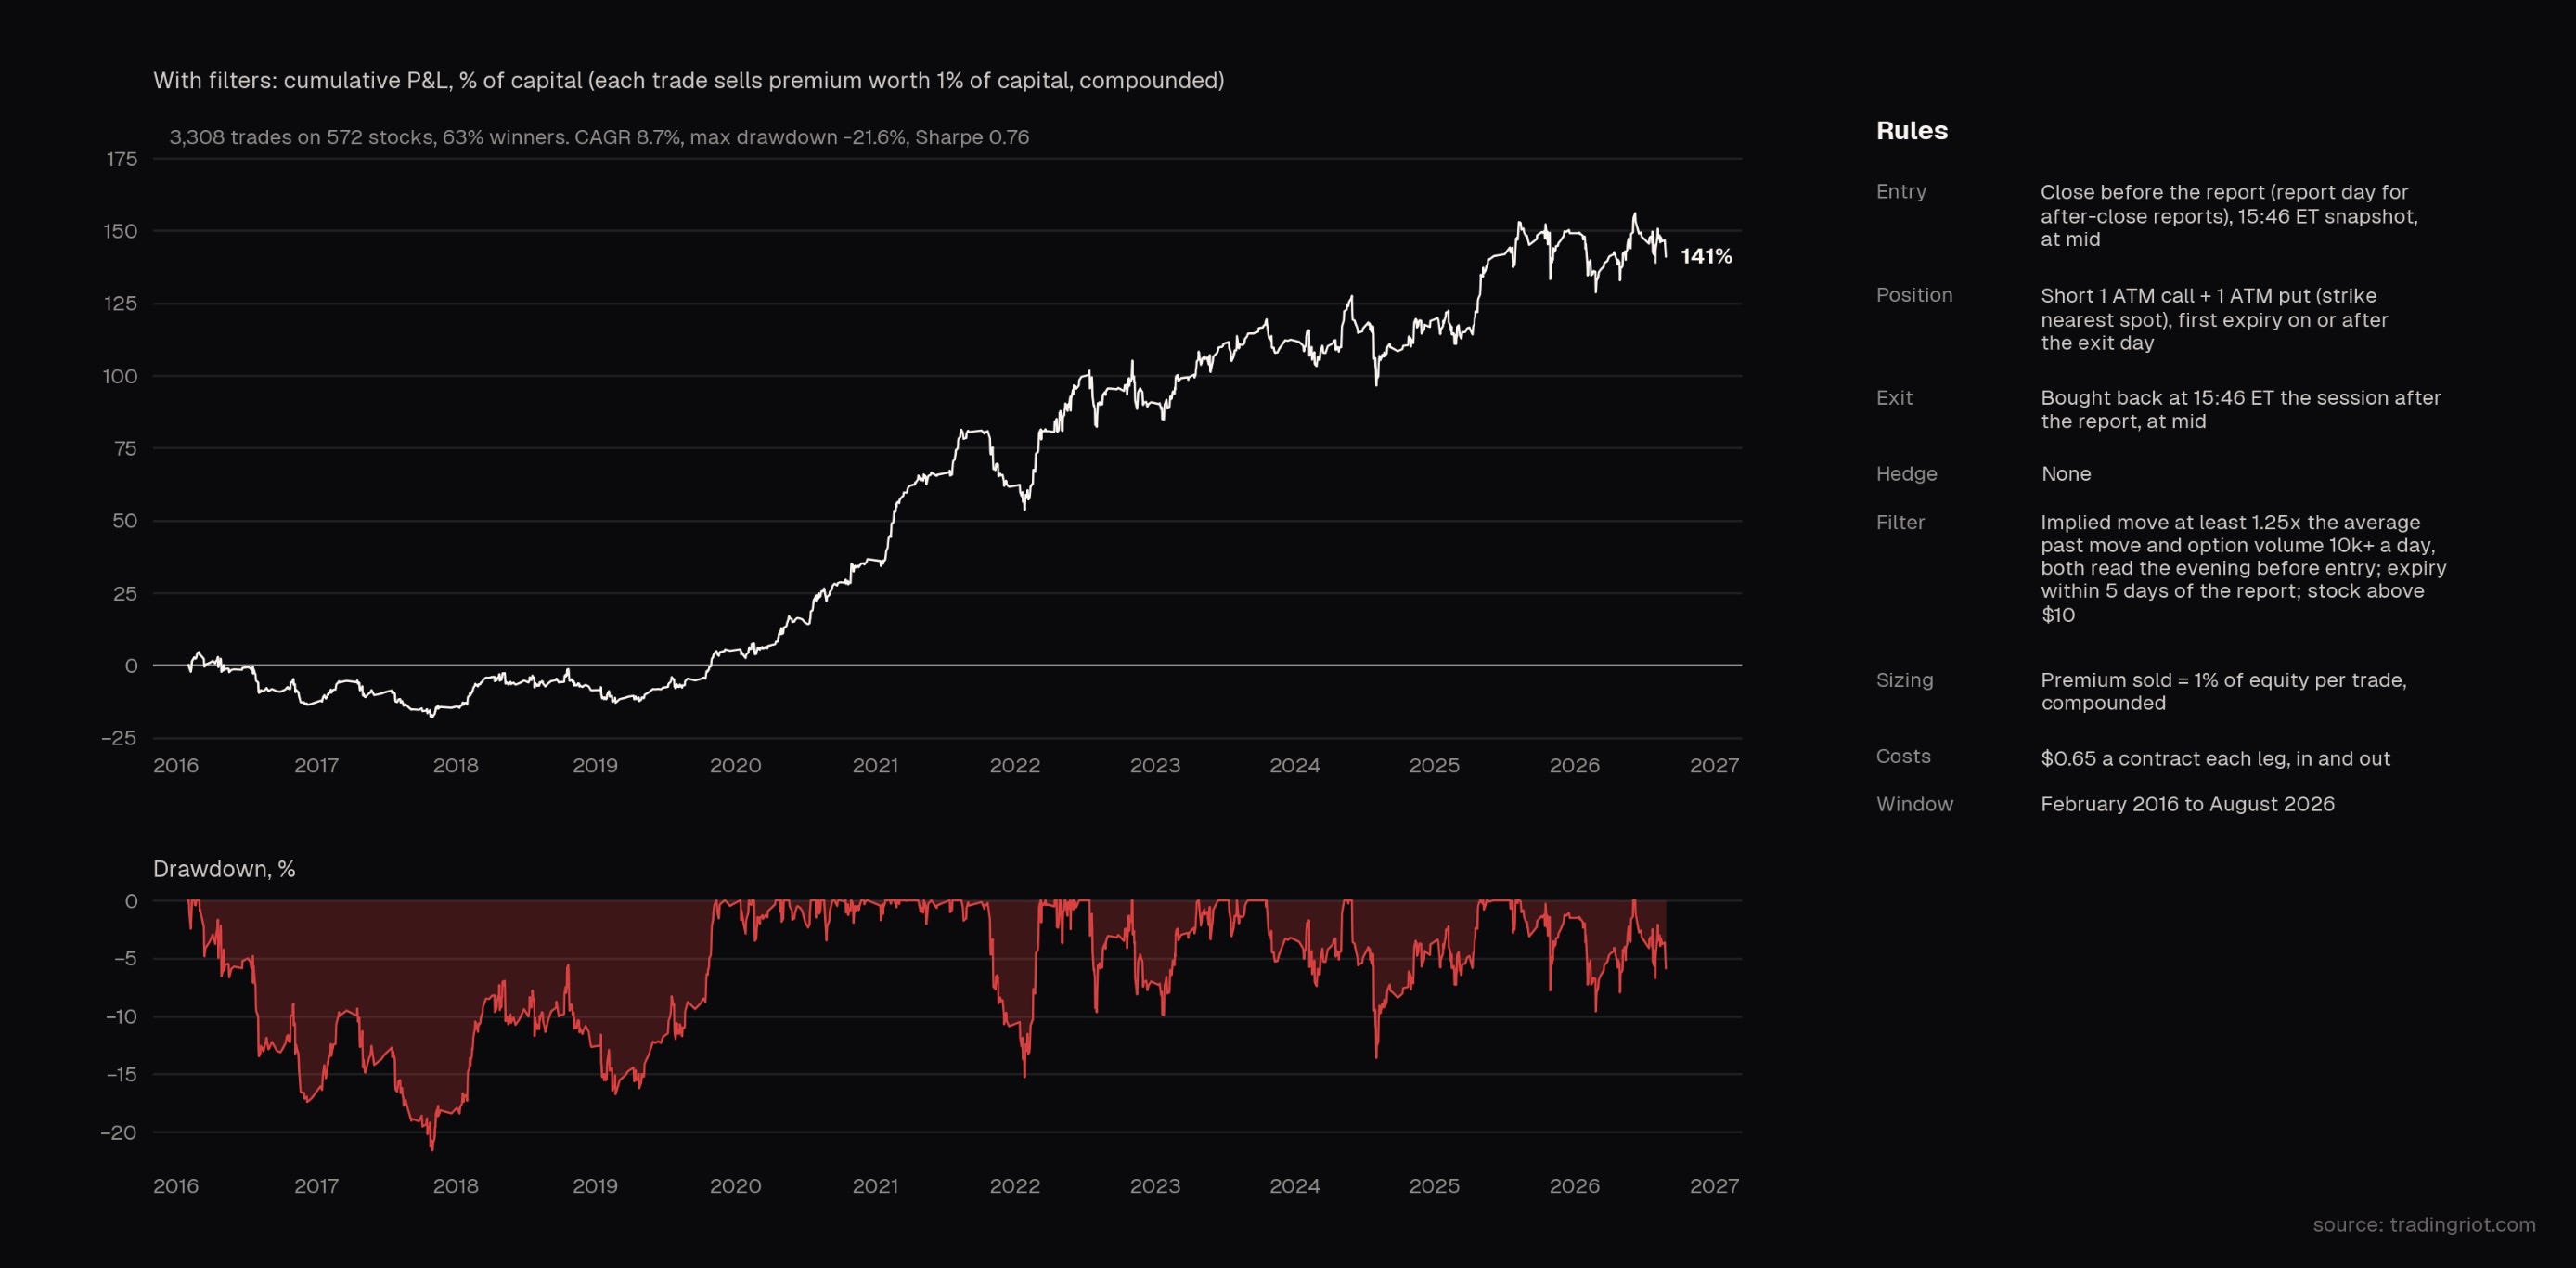
The chart looks much better all of a sudden with just one filter of only trading stocks where implied volatility is higher than the historical realized.
This is still not a free lunch, and single-event blowouts are inevitable. You can notice on the equity curve that it went straight into a drawdown at the start, so it’s completely normal to have losing quarters or even years.
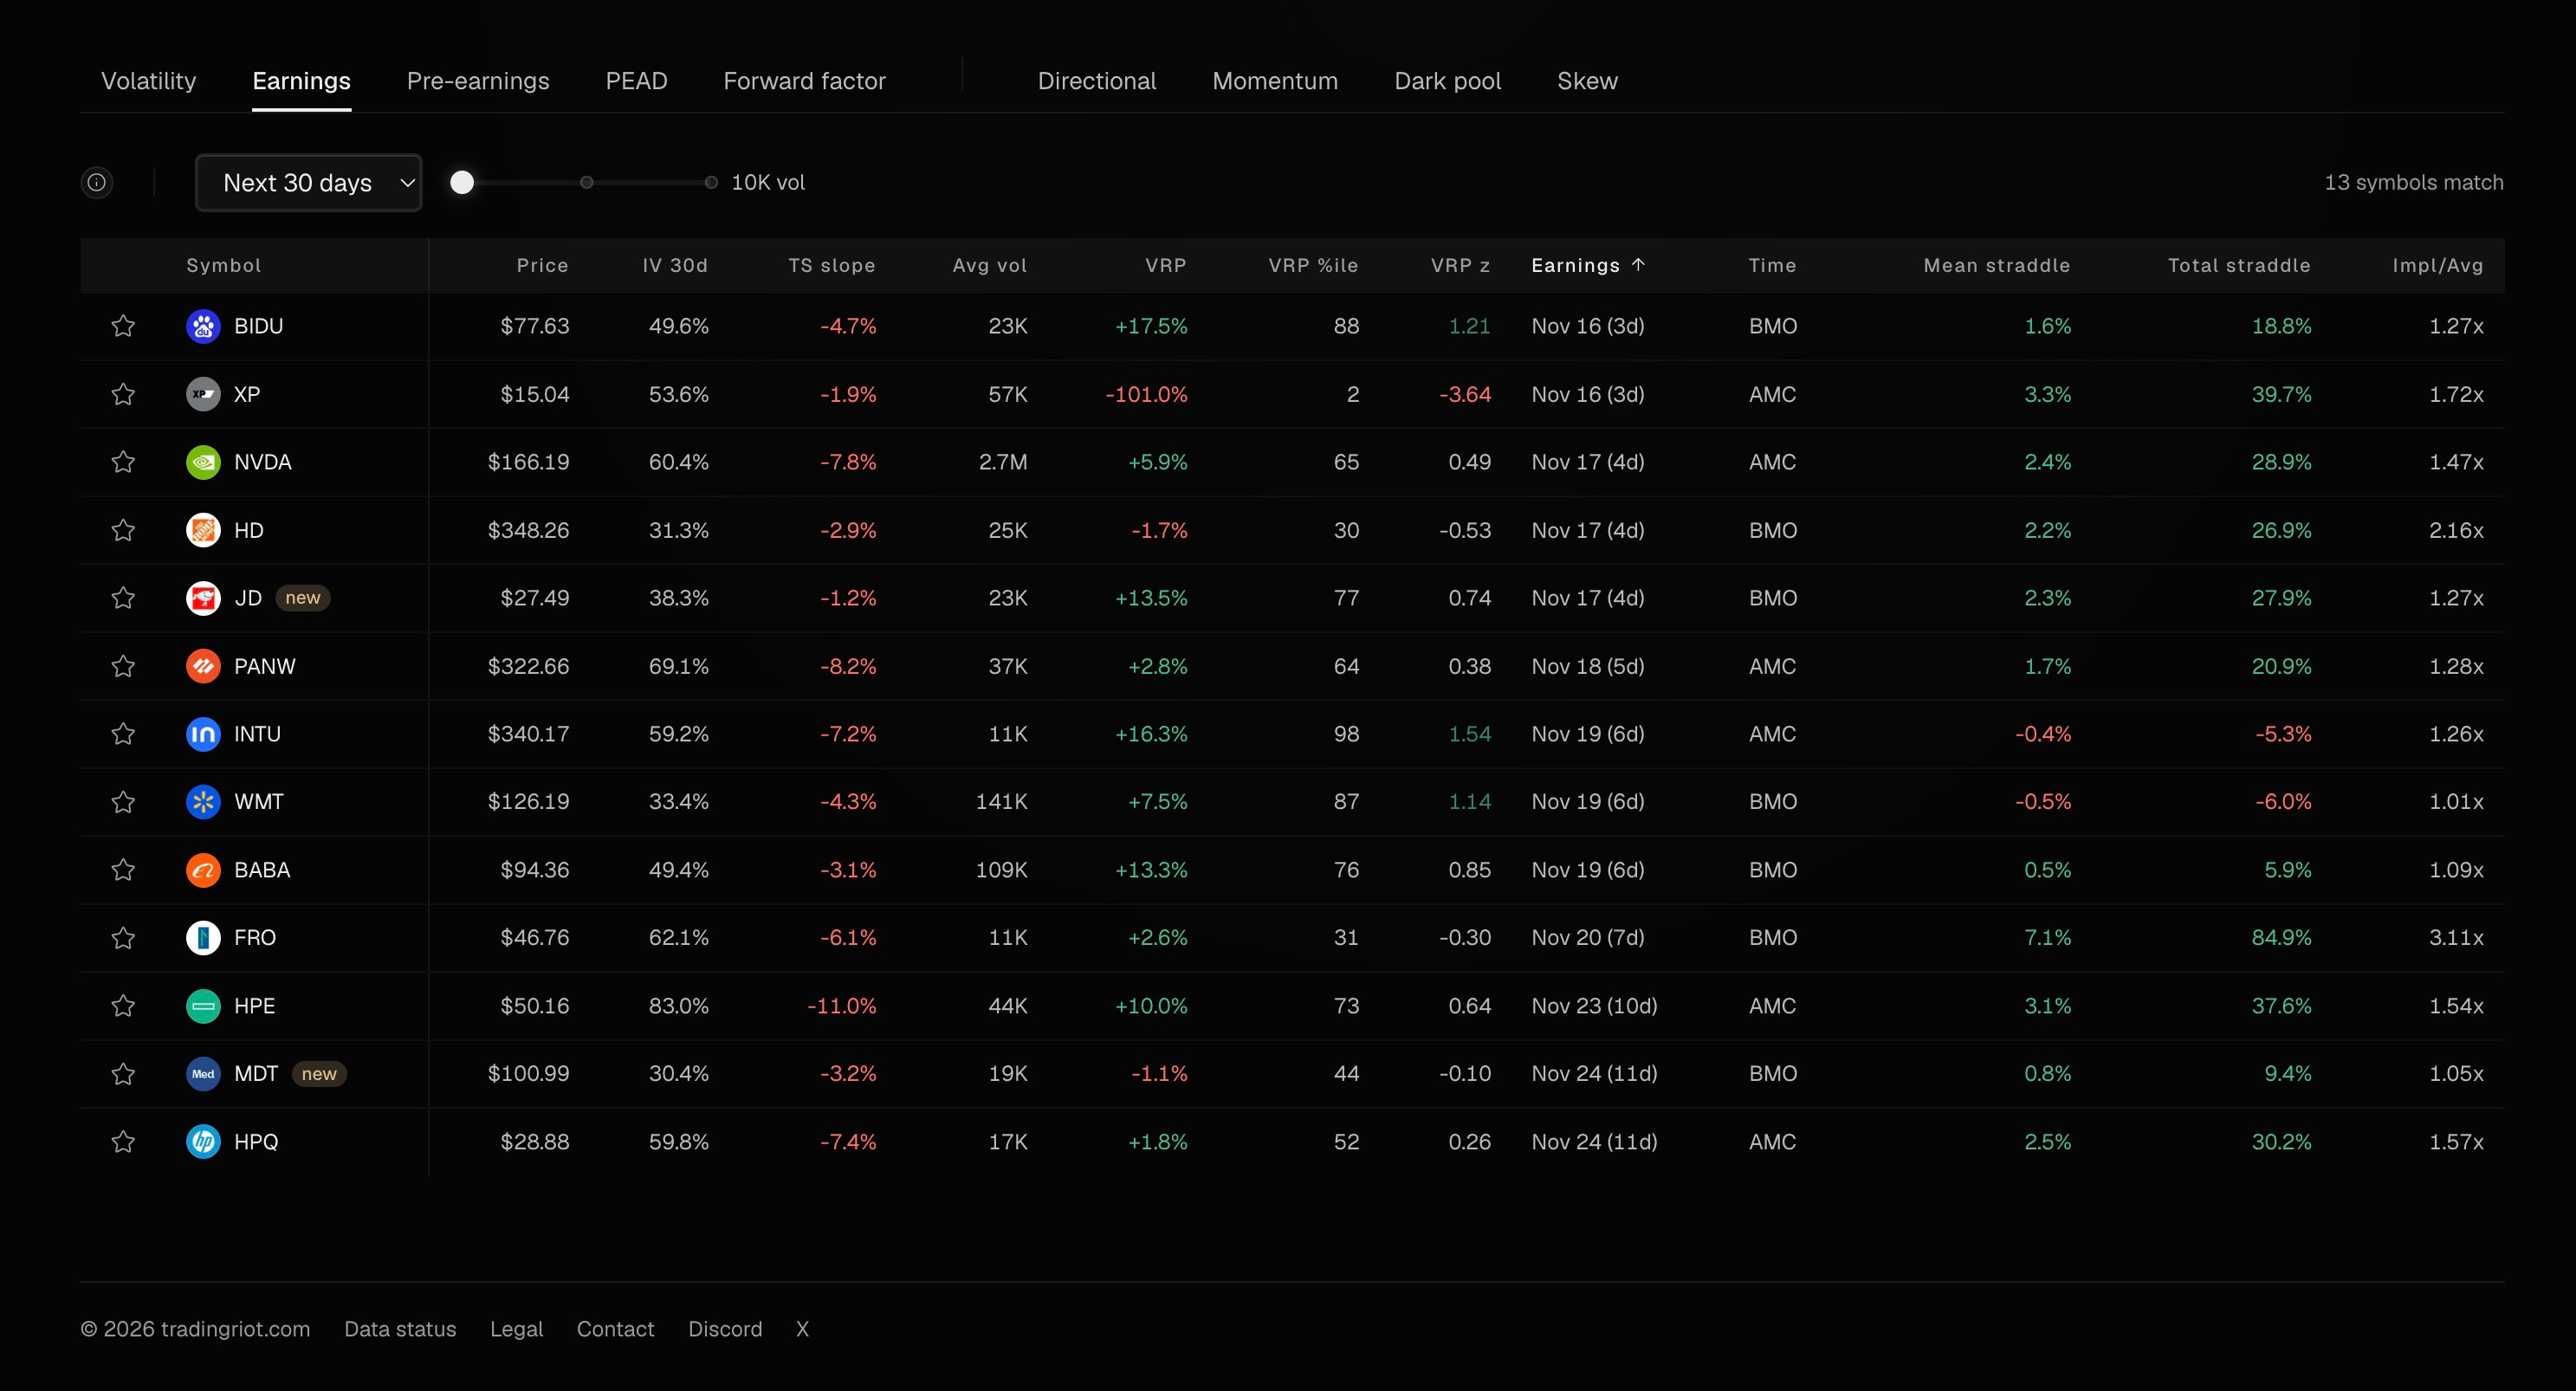
On the Tradingriot.com website, you will be able to find a screener that will show you stocks with an already set-up filter that produced the results above.
I trade these in more of an automated way these days, but I used to manually filter and execute these for quite a while. You might be wondering if it’s best to trade straddles, strangles, or maybe structures like butterflies or condors where your risk is capped.
From my experience I generally don’t like to buy wings, as they make execution much harder, and I would rather look at the largest historical moves or simply plot 2-3 sigma moves from what the market implies to get an idea of what my biggest risk per trade could be.
For structure, straddles will be more liquid and will get you the most premium if stock doesn’t move, while strangles cover more ground, but you will need to open more contracts. From my experience, straddles work best, but you should test whatever structure works best for you, as they all harvest the same risk premium.
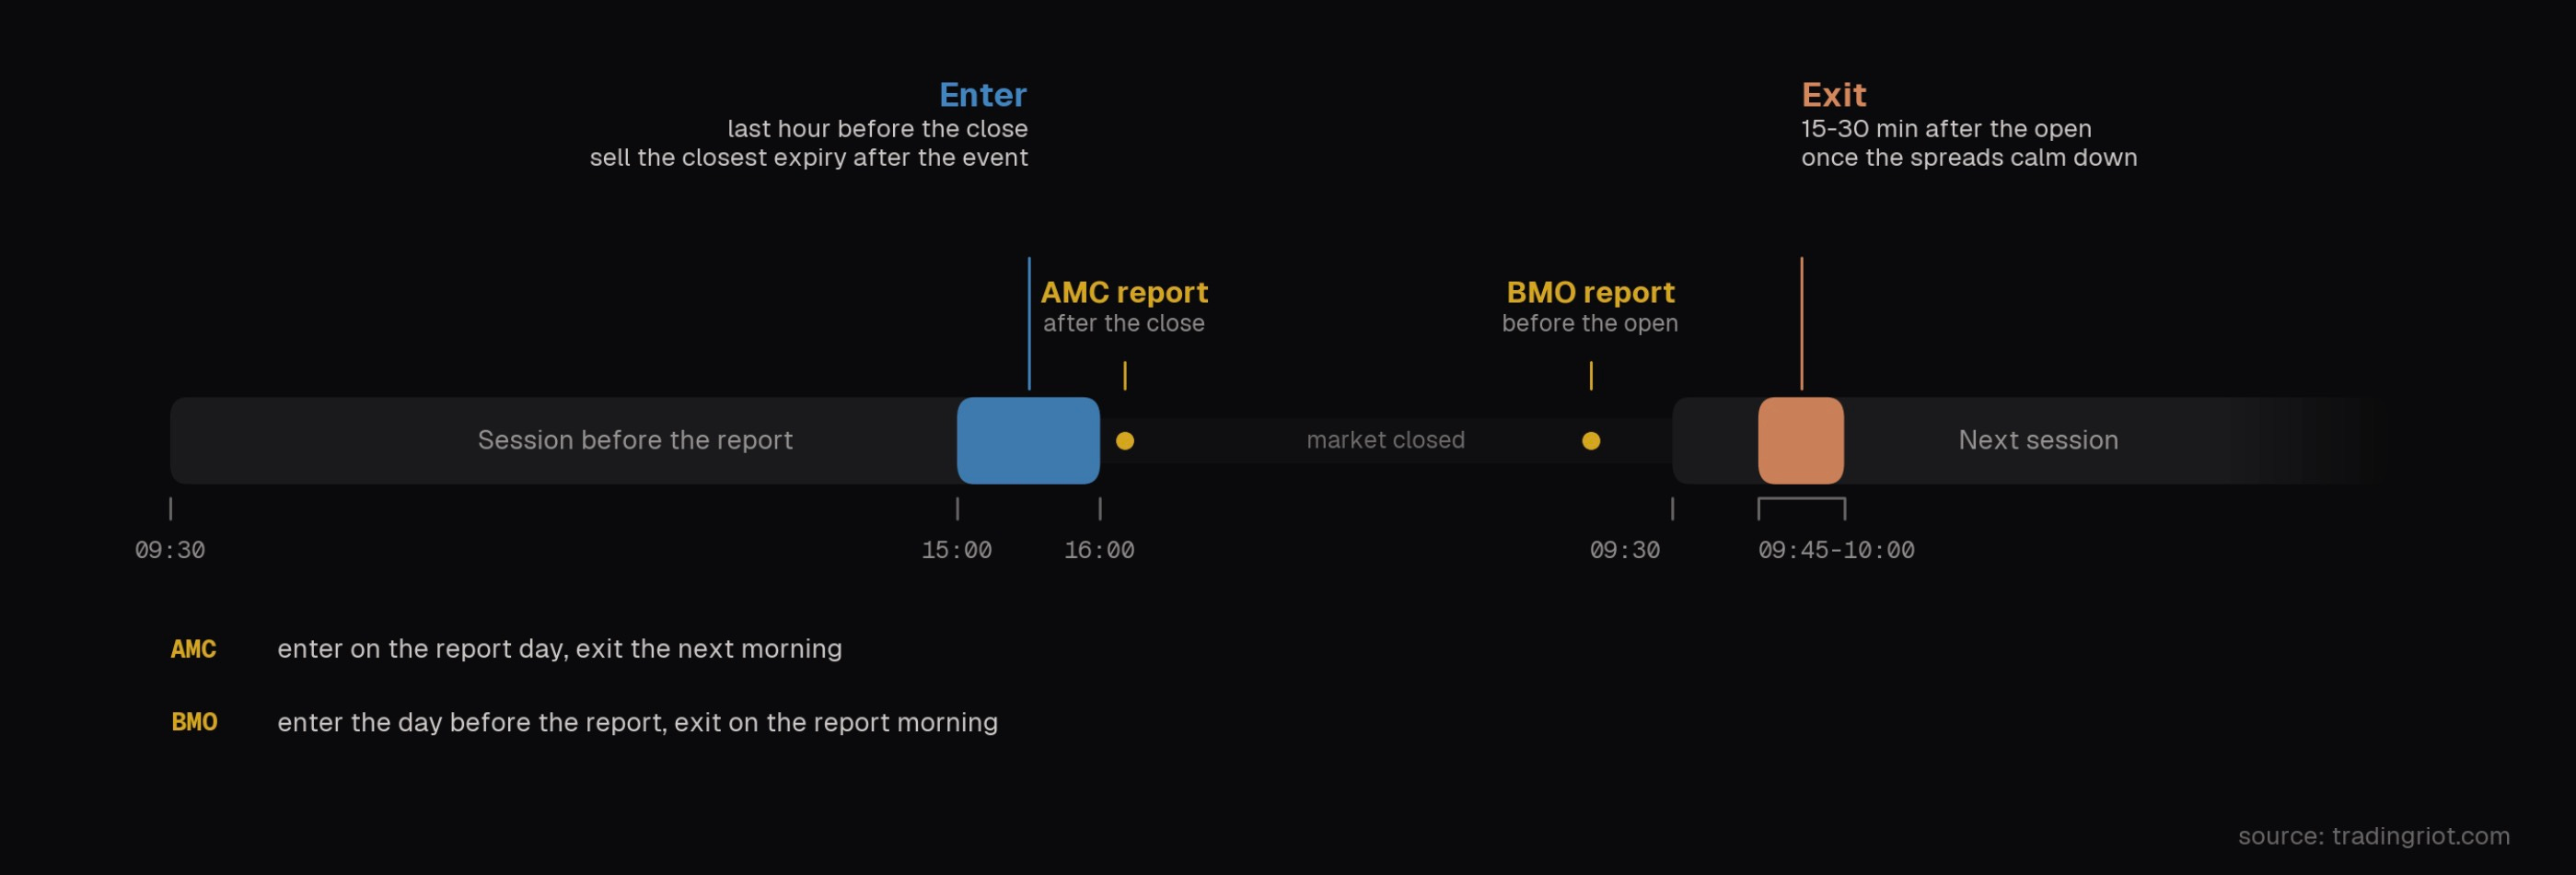
For trade execution, select the closest expiration one after the event, enter the trade in the last hour before the close, and exit 15-30 minutes after the market opens and spreads calm down.
Pre-earnings run-up
After I spent all this time on how options are expensive ahead of earnings, it’s a bit weird to tell you now that buying options ahead of earnings is actually a good idea.
If options are expensive before earnings, why on earth would you buy them?
Because they get more expensive as the date approaches, and you get out before the earnings event.
You are buying insurance when it’s still cheap and sell it to the panicked people the day before the event. Concretely: buy the at-the-money straddle on the first monthly expiry after the report, roughly three weeks out, and sell it at the last close before the company report.
Implied volatility before earnings mixes two things: the stock’s normal day-to-day movement and the one big move everyone expects on the report. Every session that passes uses up one normal day. The earnings move stays the same size, but now it is spread over fewer days left until expiry. Measured as variance, the total actually shrinks every day. IV is quoted per year, though, so dividing the same earnings move by fewer days makes the number go up.
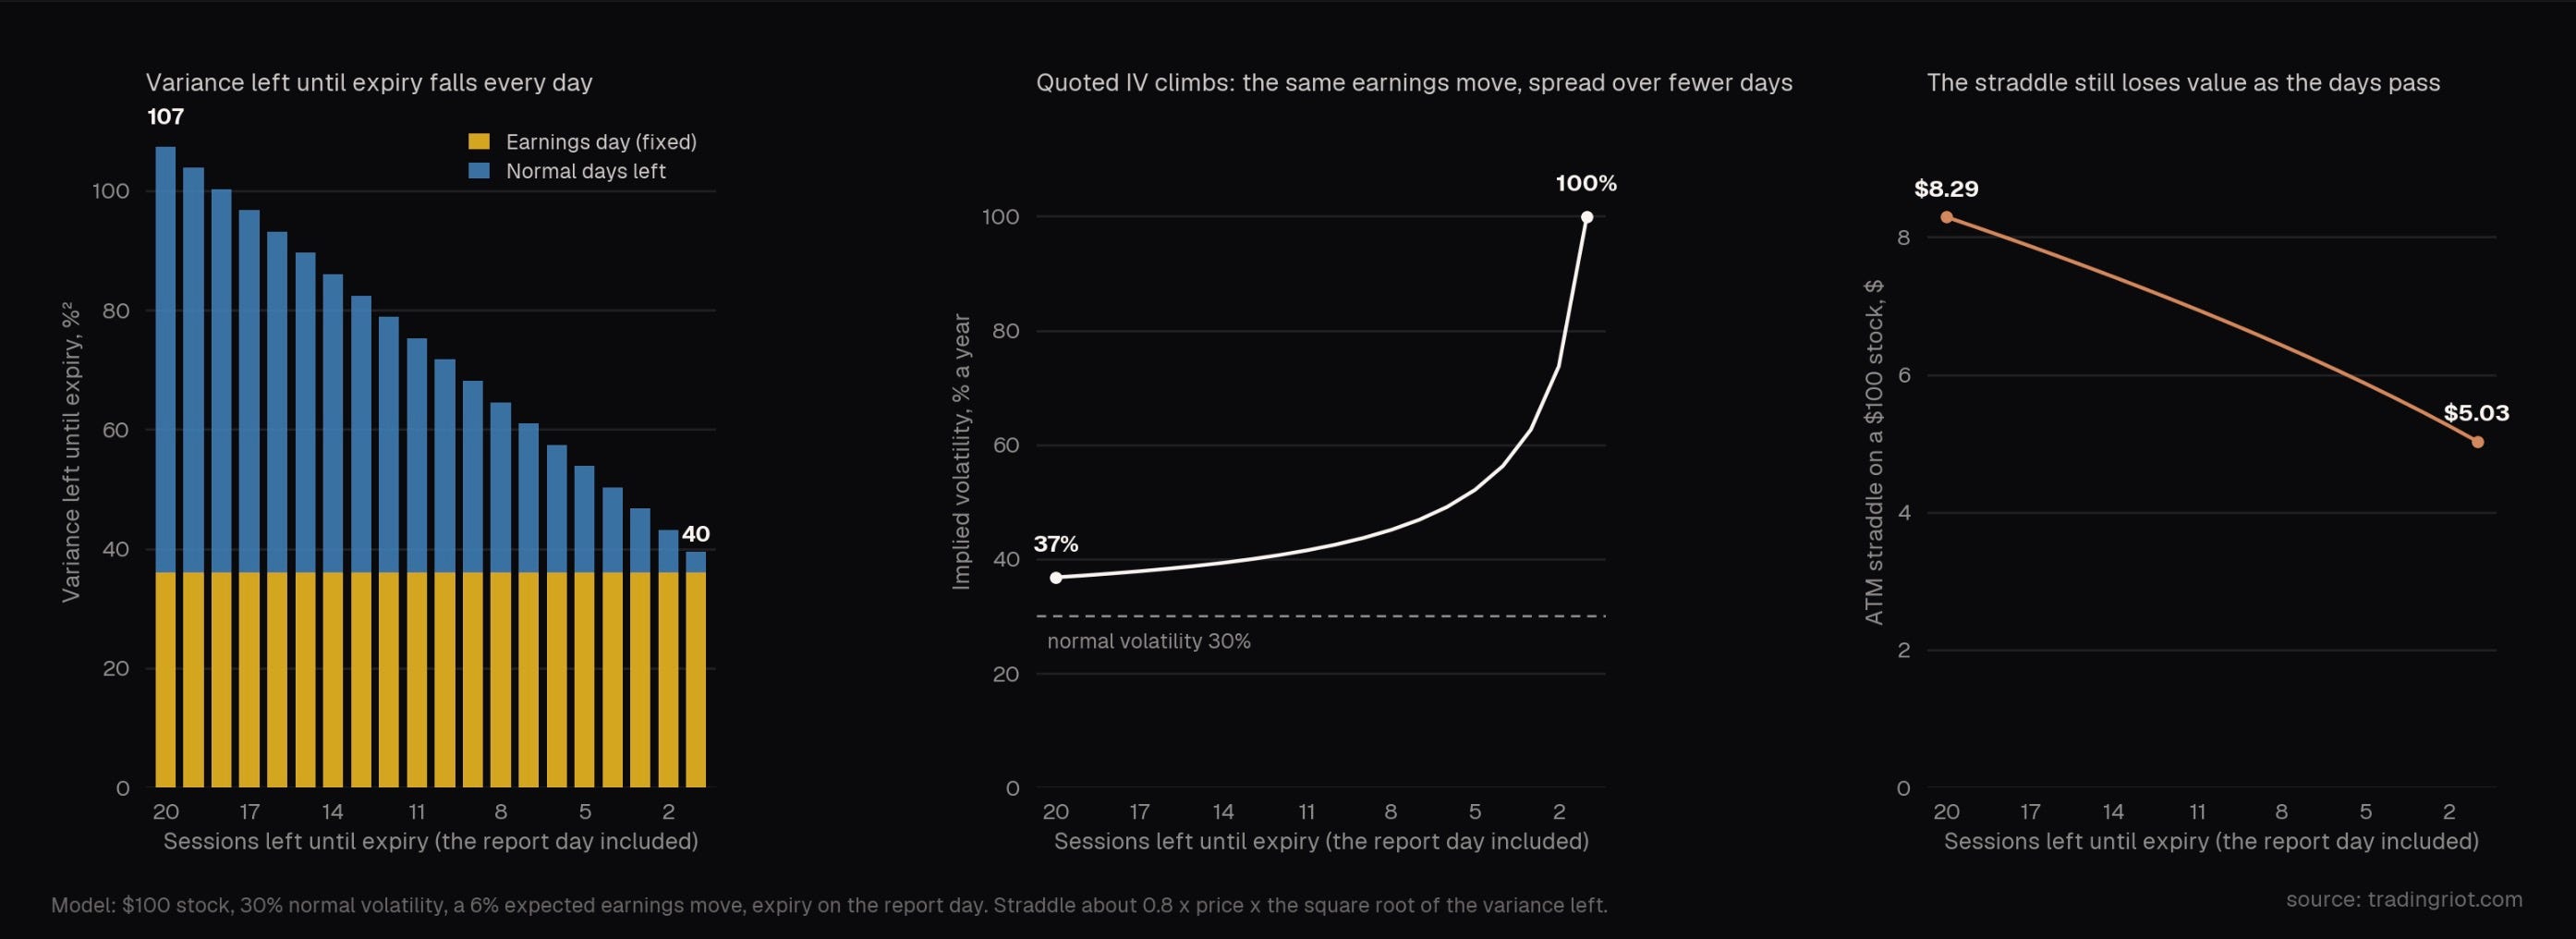
That climb in IV into the report is mostly arithmetic. Buying a straddle and watching IV tick higher does not make money on its own: time decay can easily eat the gain from the higher IV, because the option’s total value may barely move at all.
The actual opportunity is not in the mechanical ramp. It’s in the repricing of event volatility itself.
Occasionally the market underprices a specific earnings event relative to the stock’s historical norms. When the current implied move is cheap compared to past events, there’s room for the market to reprice that event higher as the announcement approaches. That repricing generates genuine vega profits for straddle holders.
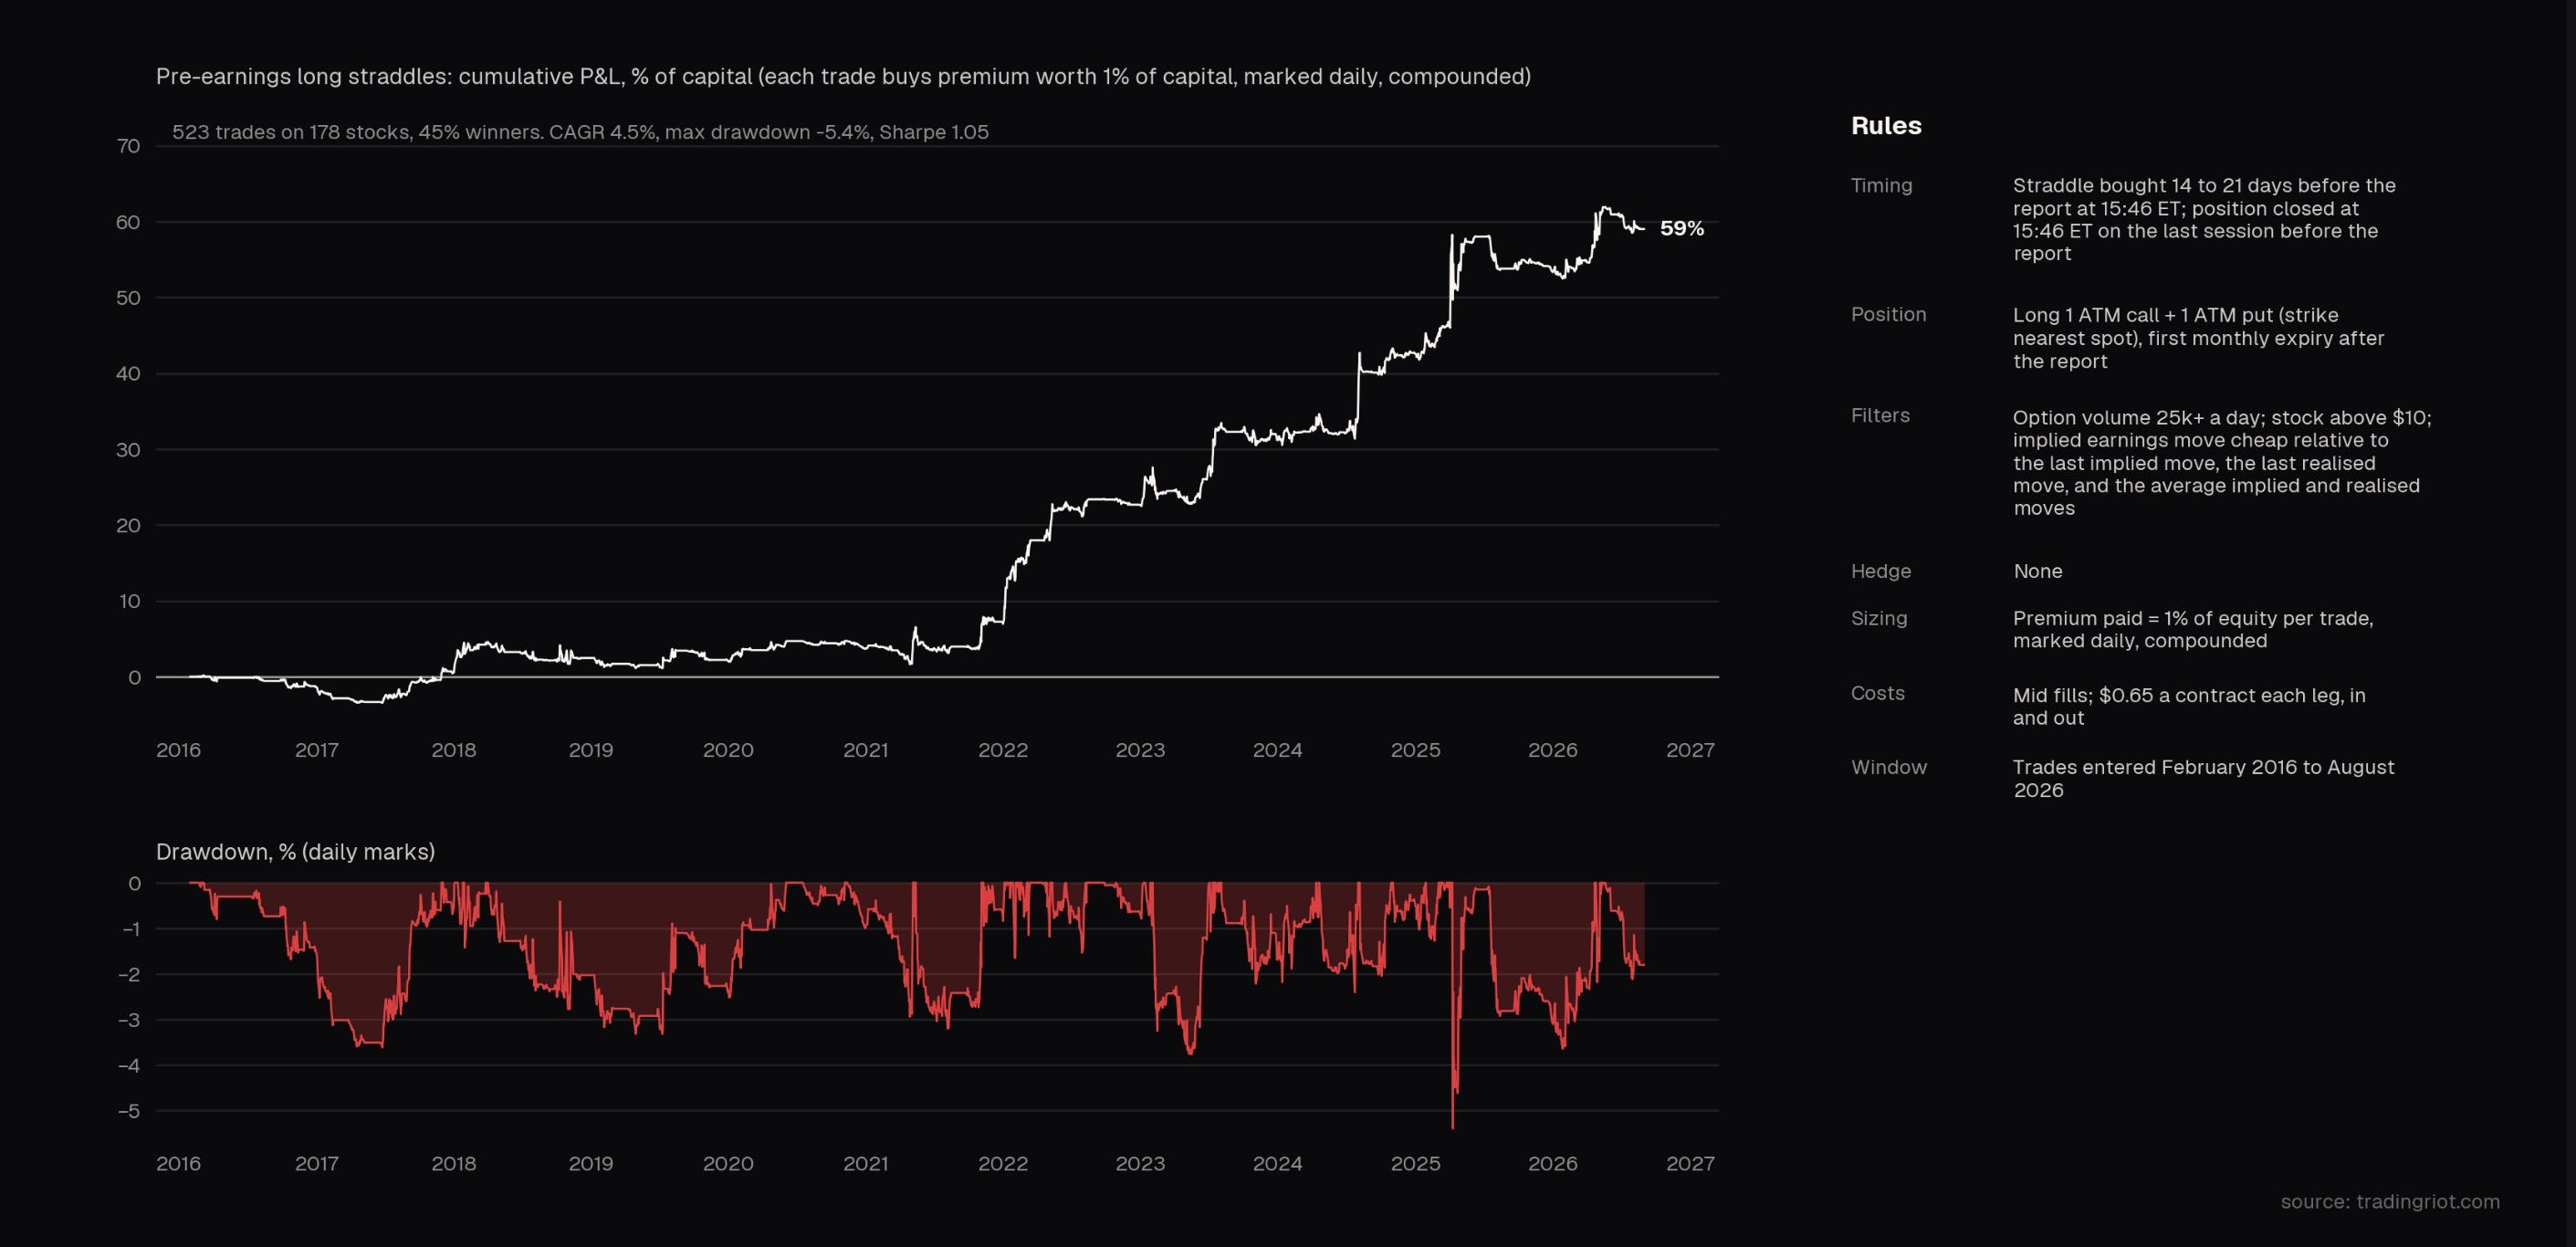
When structuring these trades, we can look to buy straddles 14-21 days ahead of the event and sell before the announcement. These are debit positions, so your risk is fixed; the backtest above uses 1% risk per trade, which is a good number to start with. It’s a convex strategy that has a very similar curve to any trend-following/momentum book, where you sit through long sideways stretches and then catch a large move when markets are trending. You might notice one of the main strengths of this strategy is good performance during 2022, when almost everything else did poorly.
Same as the earnings screener, these names are already filtered out on Tradingriot.com.

Post-earnings announcement drift
Post-earnings announcement drift is one of the oldest anomalies in finance. Stocks that beat keep drifting up for weeks; stocks that miss keep drifting down. It’s been in the academic literature since the late 1960s, and it shows up in every book or course about both options and stocks.
Compared to the previous strategy, it is hard to classify this one as a risk-premia since it’s rather an inefficiency: the market supposedly takes its time digesting the news; therefore, prices continue to drift after the earnings gap.
Inefficiencies have a habit of disappearing once everyone knows about them.
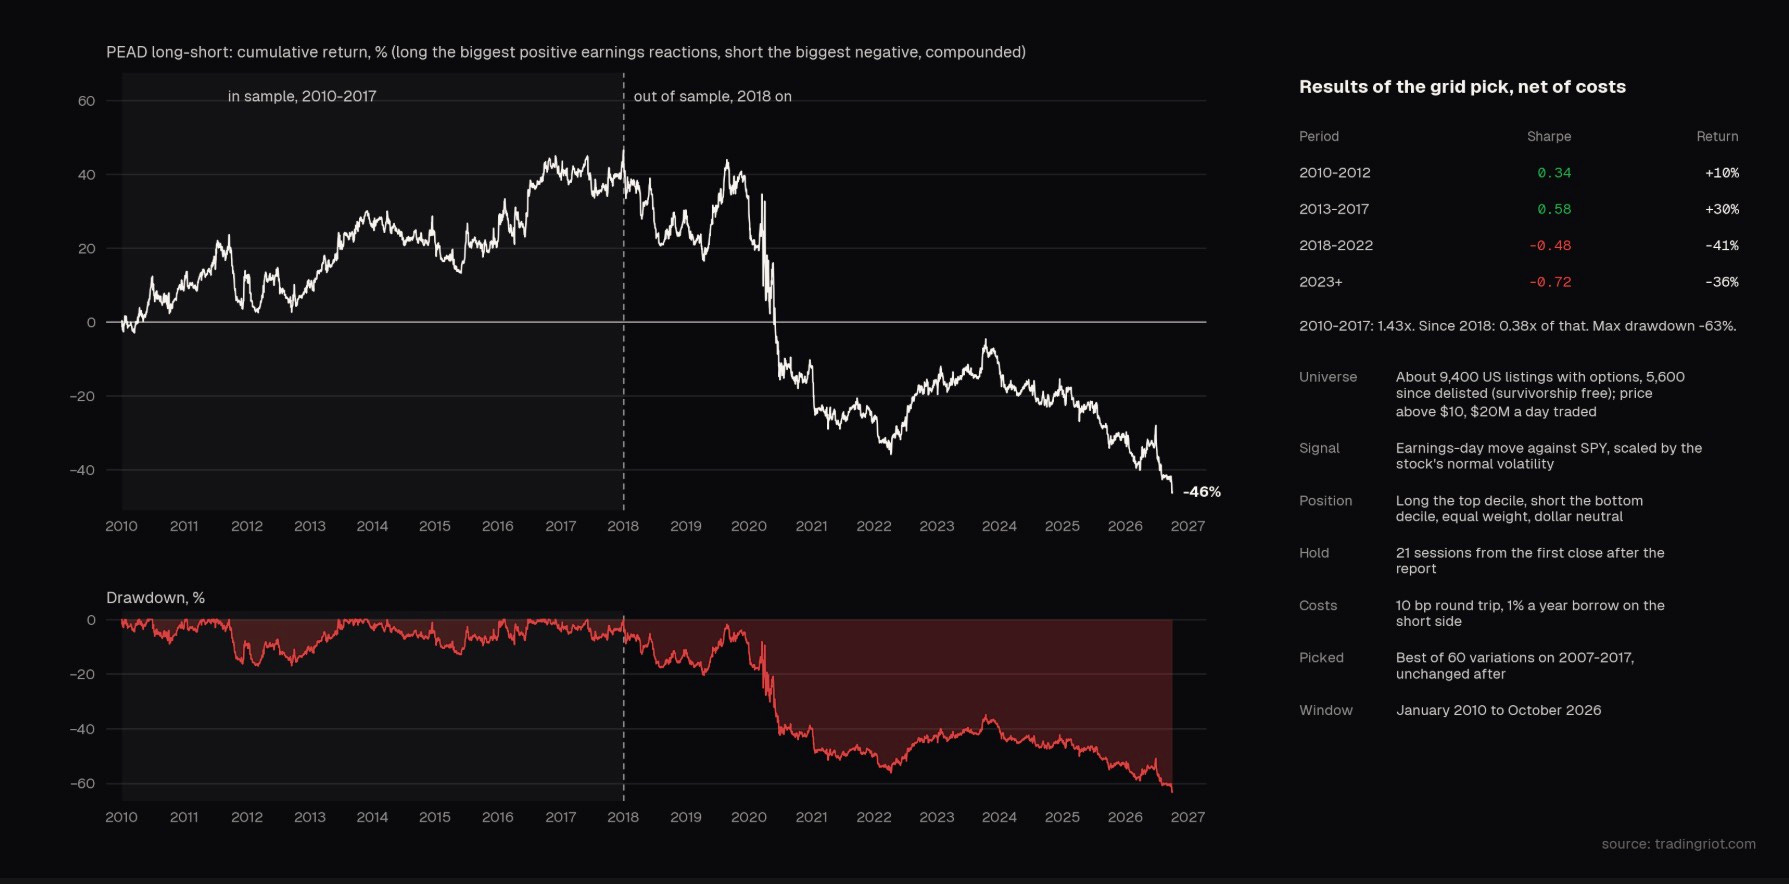
This seems to be the case for the stock version, or at least the version I tried. It measures each stock’s earnings-day move against SPY, scales it by the stock’s normal volatility, goes long the biggest positive surprises, shorts the biggest negative ones, and holds for a month. It made money until 2017 and has lost since 2018, which fits how popular the trade has become.
We can also try this trade in options, buying straddles, calls, or puts when stock moves more than the options priced from the options markets.
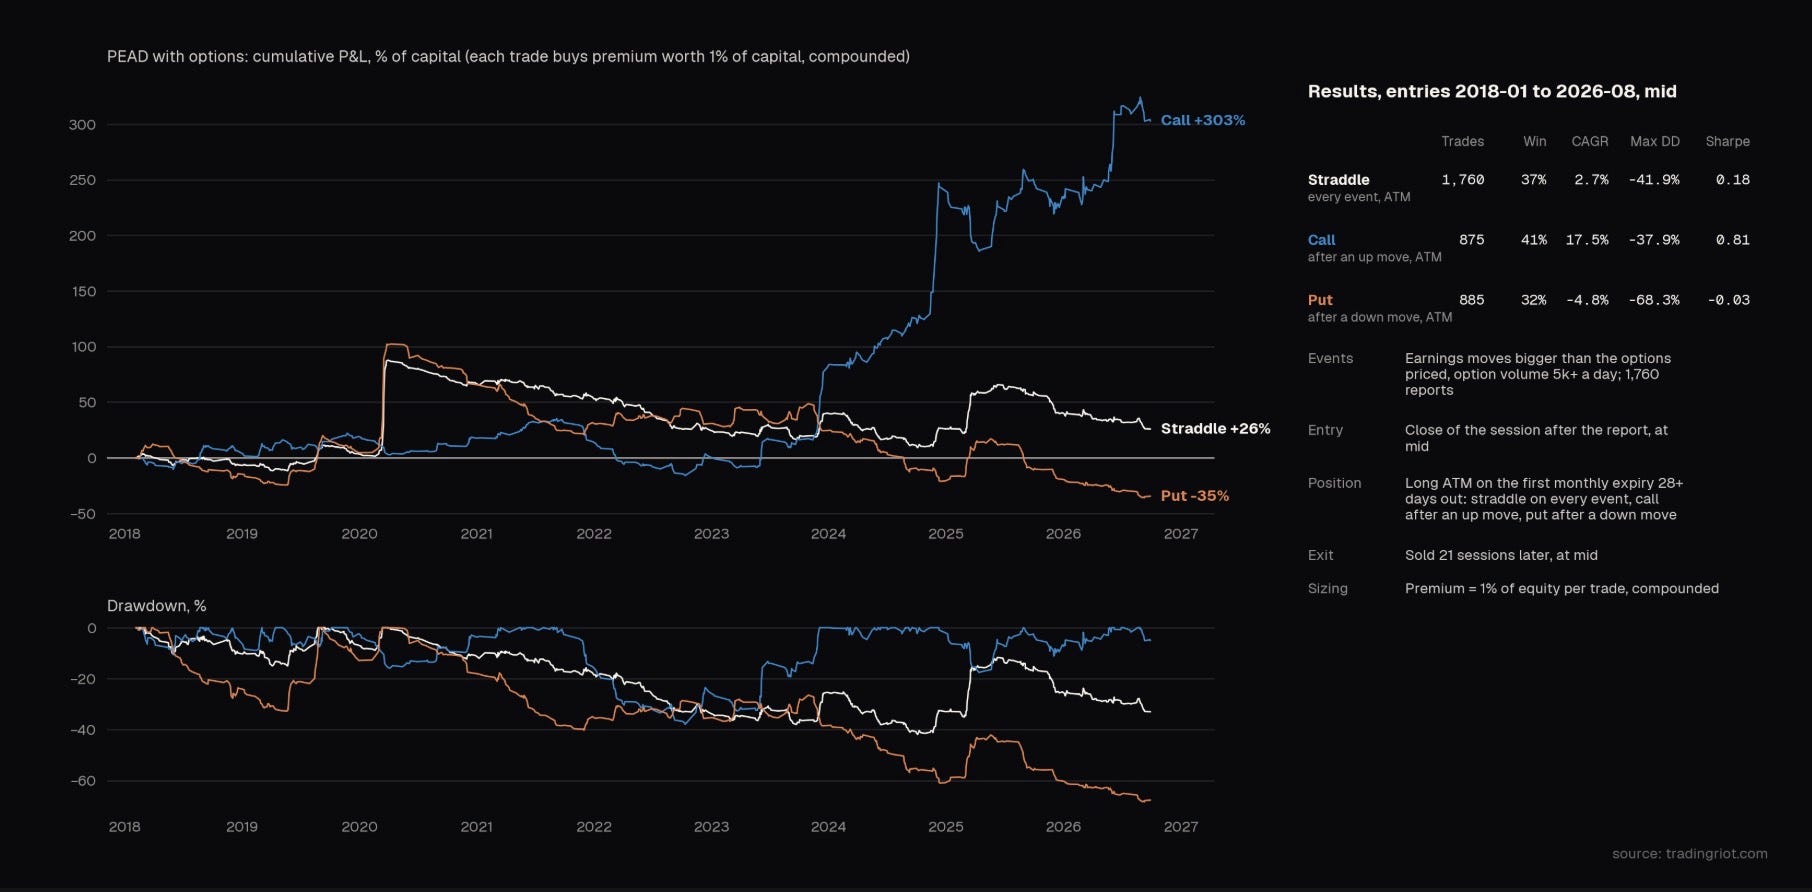
Straddles don’t work: the drift is too small to pay for a month of time decay, and the little they made came from one burst in March 2020. Puts after down moves are even weaker as the market has gone up over the years. Calls after up moves look decent, but some of that is clearly the strong market since 2022. We can test this by buying the same call on the same stocks on different days or on random stocks on the same day.
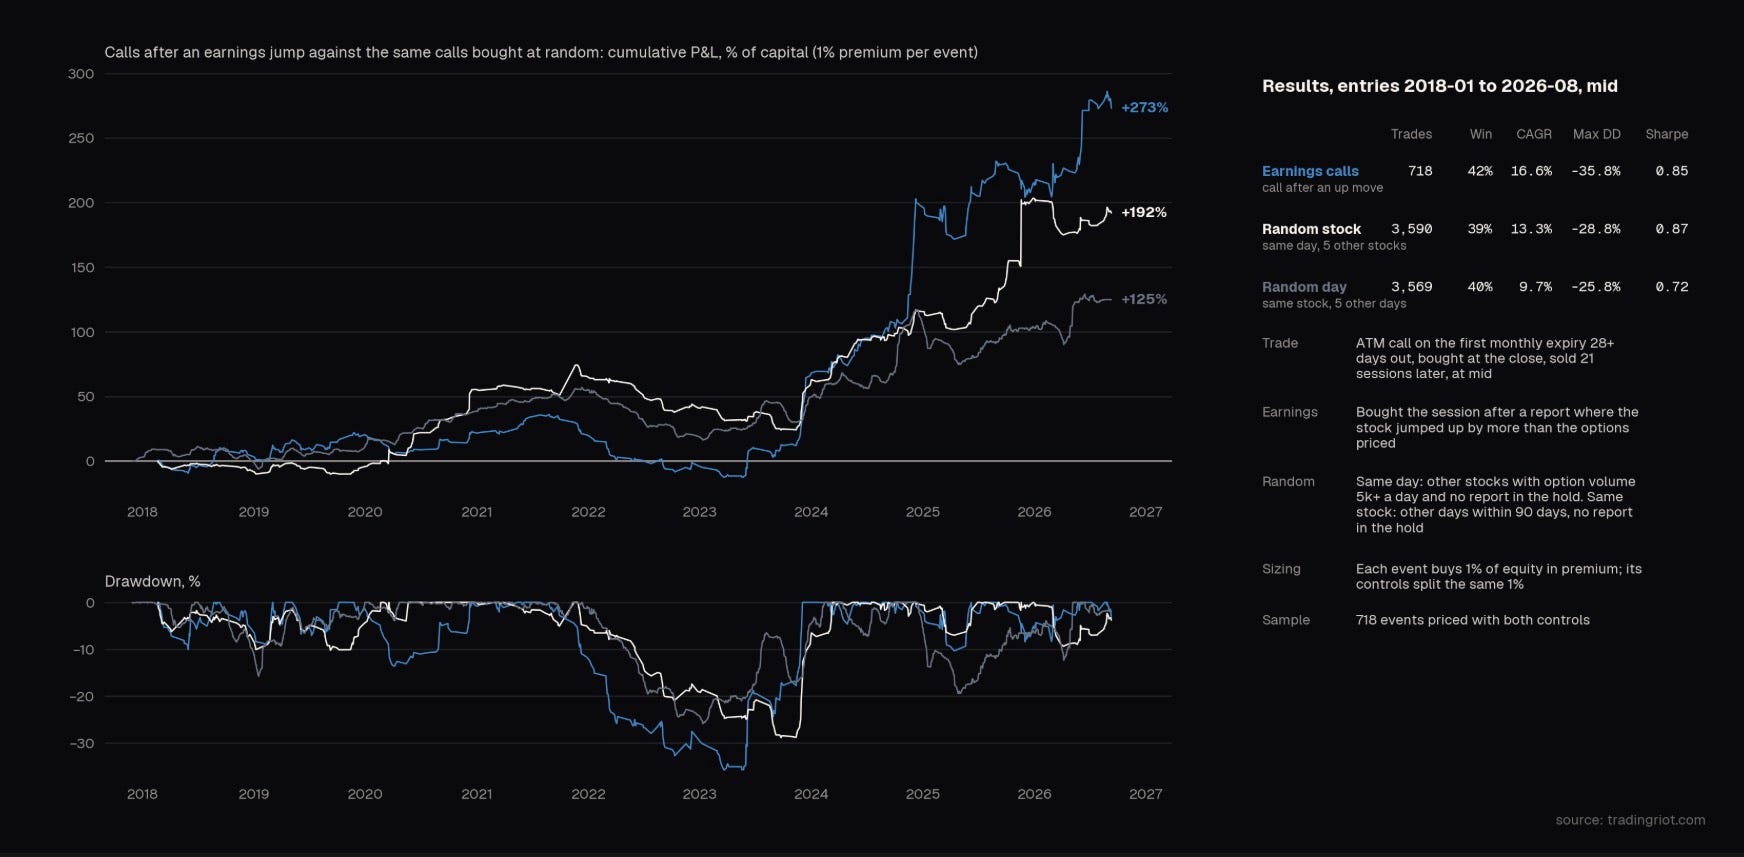
The post-earnings call does win here. If you decide to take these, it is good to be aware that you are basically relying on a strong market performance to get some extra results. For reference, this is the same test on the pre-earnings straddles that clearly shows strategy beating the random market performance.
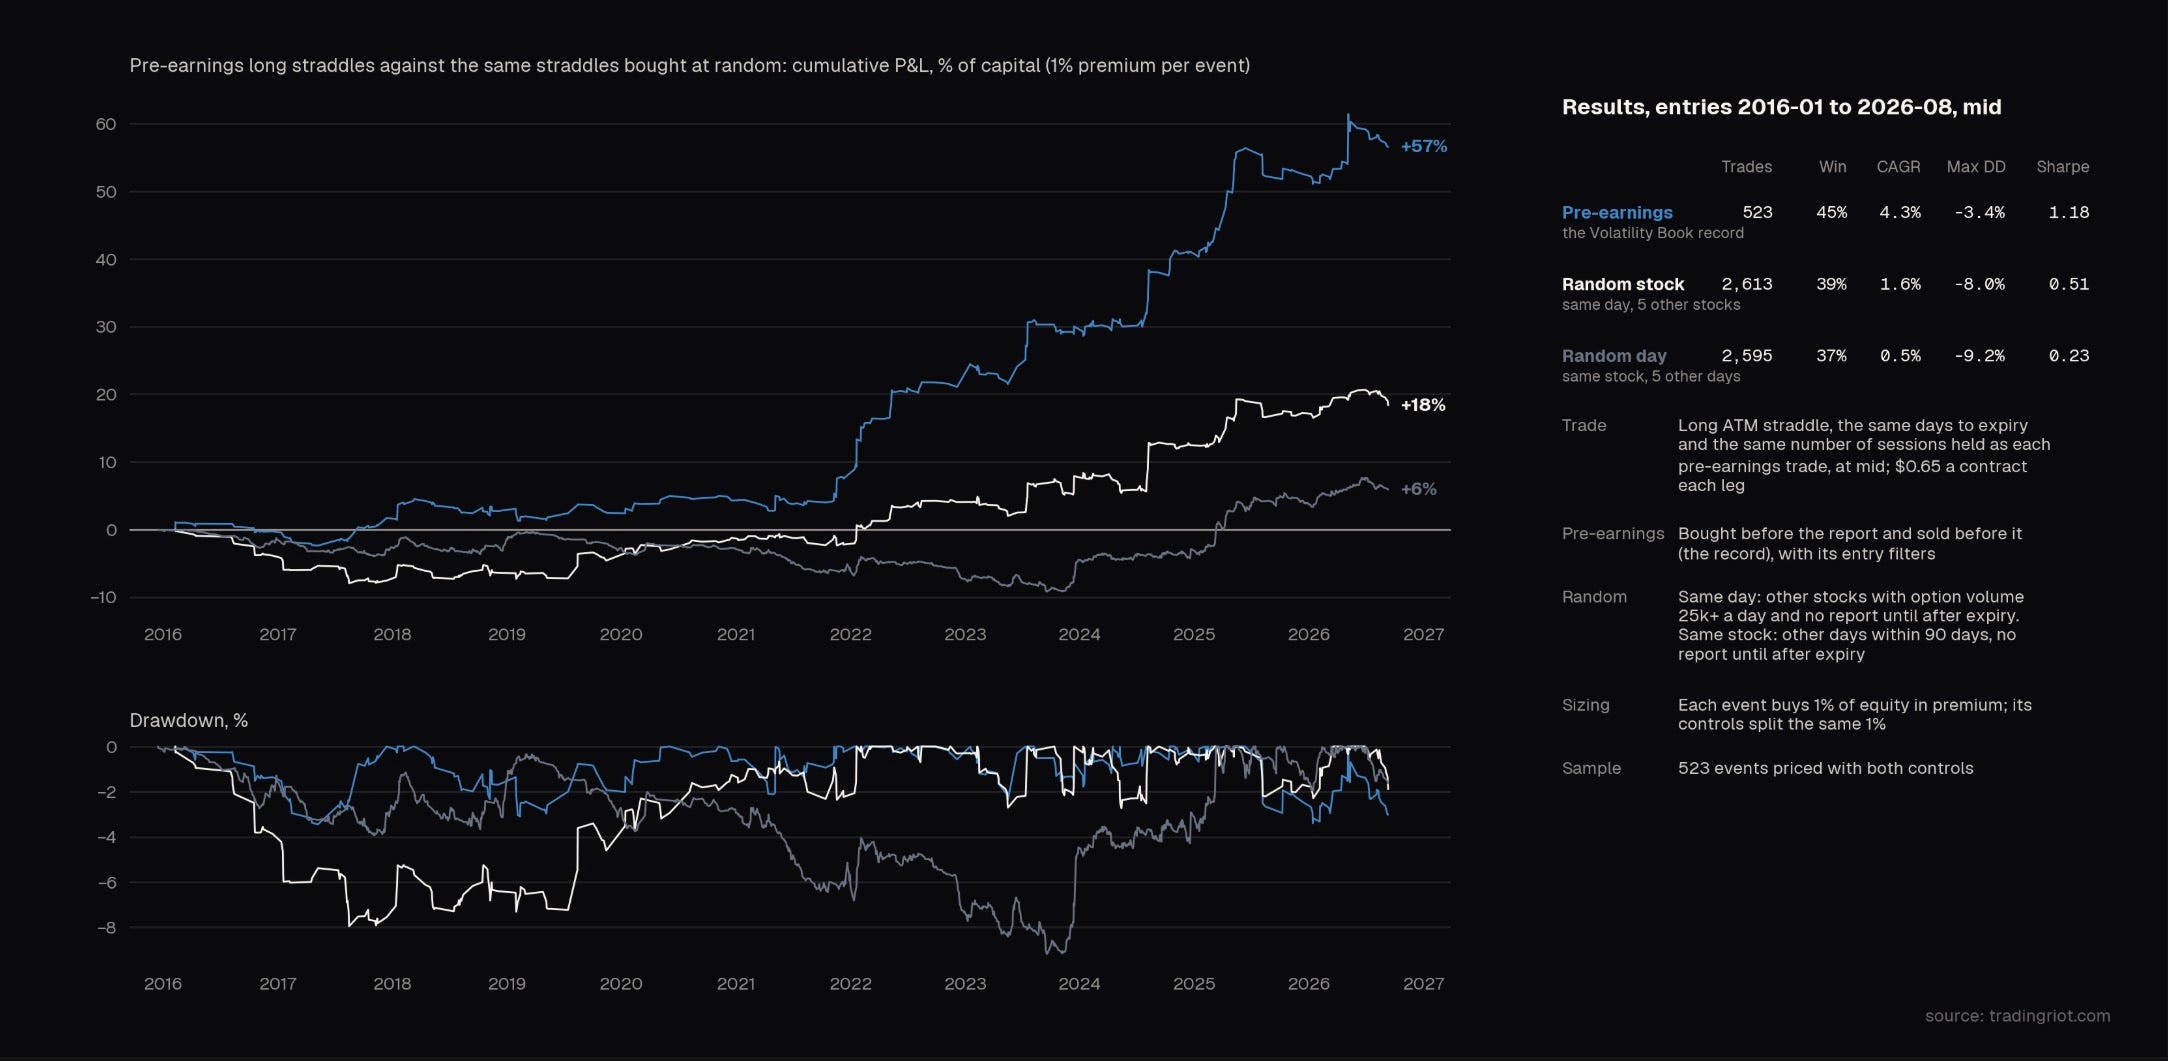
As with all other strategies, there is a PEAD screener on Tradingriot.com which filters out all the markets that produced these results.
Conclusion
These are a few of the ways I trade around scheduled events. On their own, each one goes through long, frustrating stretches. Pre-earnings straddles sit flat for months, the short earnings book gives back a quarter of gains in one bad week, and the drift trade spent two years underwater.
Put them together, and those rough patches mostly land at different times. The four strategies barely move together, so scaled to the same volatility, the combined book returned more than any single one of them.
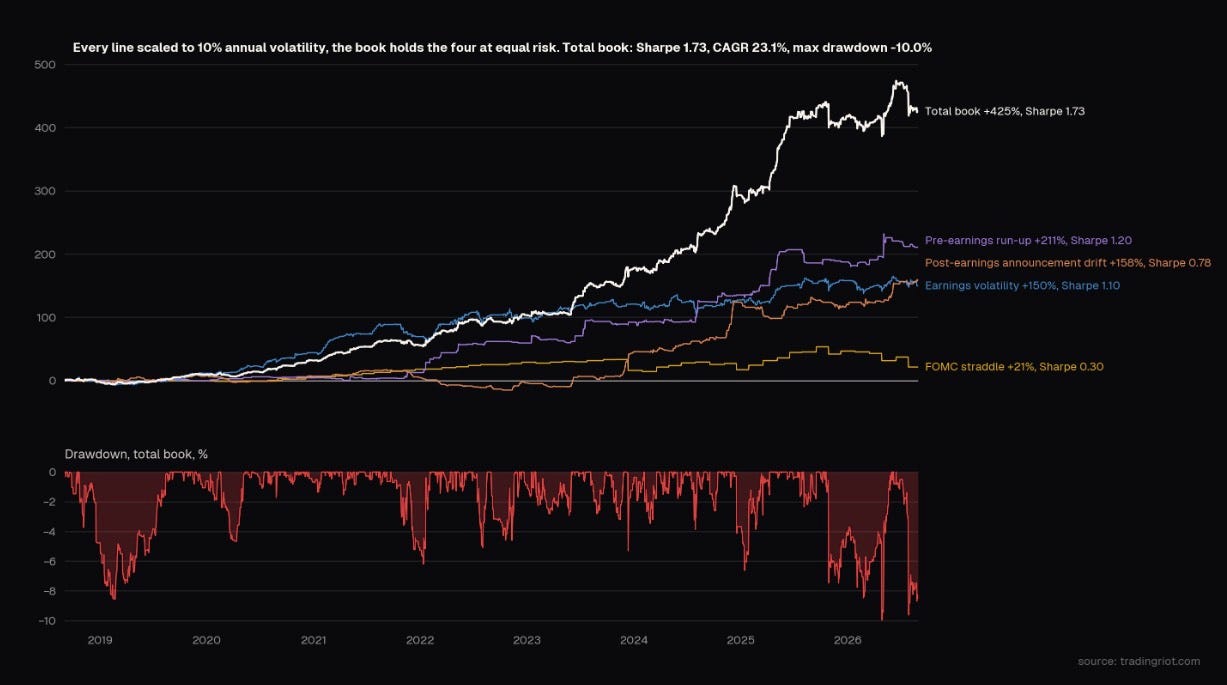
None of this is a free lunch. Event trading means many small wins paid for by the occasional ugly surprise, and the only way to collect the edge is to keep taking the trades through those surprises. Size small, spread across all of them, and let the numbers play out over hundreds of events.
Great article
This is actual market mechanics
I’m going to try Trading Riot
saving it for later, looks interesting, keep up