
What You Should Know About Perpetual Futures
Understanding key dynamics of perpetual swaps.

After all these years of digital assets, we are finally seeing one of the biggest inventions coming to life: TradFi markets.
Jokes aside, we are seeing a major shift in perpetual futures markets. Binance just launched gold and silver perpetual contracts settled in USDT.
Their API suggests stock perpetuals are next.
Decentralized exchanges like Hyperliquid, Ostium, or Lighter already offer perpetual contracts on equities, commodities, and forex. Traditional players are watching closely, with TD Securities publishing research on how perpetuals could reshape tokenized equity markets.
This creates new opportunities. It gives crypto-native traders access to new markets and TradFi natives access to new derivatives.
It also creates new ways to lose money if you do not understand what you are trading.
Perpetual futures are not complicated, but they have mechanics that differ from spot markets and traditional futures.
This guide covers everything you need to know, from the basic structure to the data that actually matters for trading decisions.
The knowledge shared applies to all perpetual futures.
One thing I would note is the liquidity issues of newly listed TradFi markets. You should be careful trading those, as this is still very fresh innovation.
All analytics in this article are powered by TradingRiot Analytics. Sign up to access data for 1,000+ futures, crypto, stocks, and ETFs, plus education on turning data into strategies.
What Are Perpetual Futures
Perpetual futures are derivative contracts that let you trade an asset with leverage without ever taking delivery.
Unlike traditional futures, they have no expiration date. You can hold a position indefinitely, as long as you maintain sufficient margin.
They function similarly to Contracts for Difference (CFDs), which are popular in forex and equity markets outside the US. The key difference is that perpetual futures trade on exchanges with standardized contracts, rather than directly with a broker who sets their own terms.
Because there is no expiration, perpetual futures need a mechanism to keep their price aligned with the underlying spot market. This is where the funding rate comes in, which I will cover in detail below.
A Brief History
Many people think perpetual futures are a crypto invention. They are not.
The concept was proposed by economist Robert Shiller in 1992. His idea was to enable derivatives markets for illiquid assets like real estate, where traditional futures with expiration dates would not work well.
The problem was that nobody actually built them for those markets.
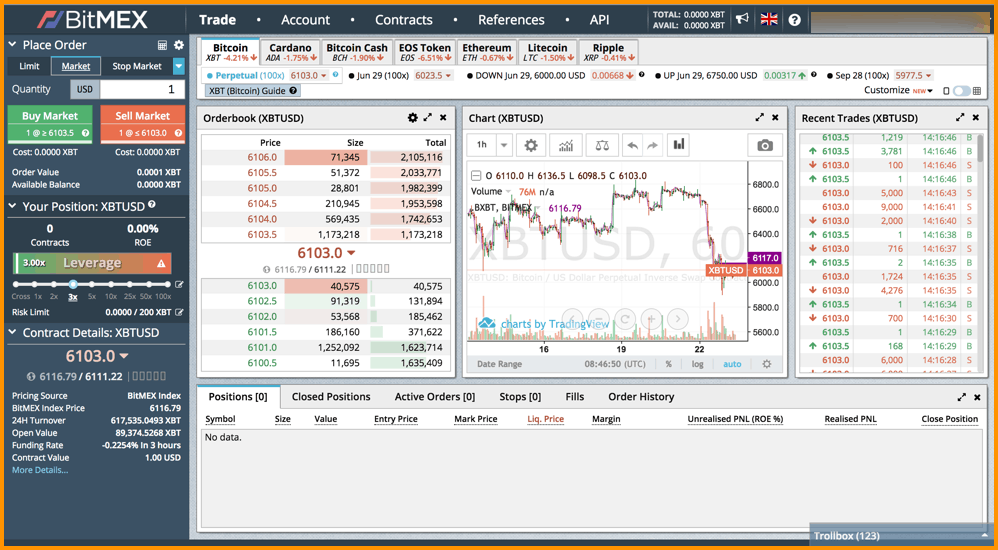
In 2011, Alexey Bragin developed an early version for ICBIT, a Bitcoin derivatives platform. But perpetual futures truly became popular in 2016 when BitMEX launched them for Bitcoin.
BitMEX’s innovation was combining three things: inverse contracts denominated in Bitcoin, a funding rate mechanism to anchor prices, and high leverage accessible to anyone. This combination turned out to be extremely popular with retail traders.
By 2020, most volume had shifted from inverse contracts to linear contracts denominated in stablecoins. Binance and FTX (rest in piss) drove this transition.
Today, perpetual futures account for roughly 75% of all crypto volume, with over 90% of that activity happening on offshore exchanges.
Now we are seeing the model expand beyond crypto. The same structure that works for Bitcoin is being applied to gold, silver, oil, equities, and forex.
The appeal is straightforward: 24/7 trading, high leverage, and no expiration dates.
Linear Contracts
Linear contracts are the simpler version and where most volume sits today.
They are both settled and quoted in the same currency, typically a stablecoin like USDT. If you have $100,000 USDT in your account and want to go long 1 BTC at $100,000, you provide $100,000 as margin.
Your profit and loss is calculated in USDT.
If Bitcoin rises to $101,000, you make $1,000 USDT. If it falls to $99,000, you lose $1,000 USDT.
Inverse Contracts
Inverse contracts are more confusing but were actually the original design.
They are settled in the underlying coin but quoted in USD. For an inverse BTCUSD contract, your collateral is Bitcoin, but the chart shows prices in dollars.
This creates non-linear P&L. If you are long, you make Bitcoin when the dollar price goes up and lose Bitcoin when it goes down.
But because Bitcoin itself is changing in dollar value, the math gets complicated.
if you hold 1 BTC and open a 1x short on an inverse BTCUSD contract, you are effectively hedged in dollar terms.
If Bitcoin falls from $100,000 to $90,000, you lose $10,000 of value on your BTC holding but gain roughly $10,000 equivalent on your short position (denominated in BTC).
Inverse contracts used to dominate when BitMEX and early Bybit were the main venues.
They have fallen out of favor because linear contracts are easier to reason about, and stablecoin availability removed the need to keep all your capital in volatile assets.
There are also Quanto contracts, but nobody really trades them, and they are confusing enough that we can pretend they do not exist.
Nowadays, inverse contracts (also often called coin-margined) are still traded here and there, but are mostly used by those who want to denominate their whole portfolio in a chosen coin. BTC is the most popular, obviously.
The Funding Rate Mechanism
The funding rate is what makes perpetual futures work. Without it, the price of a perpetual contract would drift away from the spot price over time, since there is no expiration forcing convergence.

The mechanism is straightforward: every eight hours (on most exchanges), one side of the market pays the other.
If the perpetual price is trading above spot, funding is positive. Longs pay shorts.
If the perpetual price is trading below spot, funding is negative. Shorts pay longs.
This creates an incentive. If funding is very positive, there is money to be made by shorting the perpetual and buying spot (this is the cash-and-carry or basis trade).
Arbitrageurs doing this push the perpetual price back down toward spot.
How Funding Rate Is Calculated
The funding rate formula varies slightly between exchanges, but the core structure is the same:
Funding Rate = Interest Rate + Premium IndexThe Interest Rate is typically a fixed component, usually 0.01% per 8-hour period on most exchanges (equivalent to roughly 10.95% annualized) which exists as crypto-natives prefer long side over the short.
This represents the cost difference between holding the base currency (e.g., BTC) versus the quote currency (e.g., USD).
The Premium Index measures how far the perpetual price deviates from the spot price:
Premium Index = (Perpetual Price - Spot Price) / Spot PriceMost exchanges apply a dampener or clamp to prevent extreme funding rates.
Binance, for example, caps the premium component and uses a time-weighted average price (TWAP) over the funding interval rather than a single snapshot.
The final funding payment you pay or receive is:
Funding Payment = Position Size × Funding RateIf you are long 10 BTC and the funding rate is 0.01%, you pay 0.001 BTC to shorts. If funding is -0.01%, you receive 0.001 BTC from shorts.
Funding Rates as a Directional Trading Signal
Many traders treat funding rates as a contrarian indicator. Funding is very positive? Everyone must be long. Time to short.
This is too simple.
High funding can persist for extended periods during strong trends. During crypto rallies, funding often stays positive for weeks or months. Traders who shorted just because funding was high got run over.
Think of funding as the cost of doing business. If I believe the market will rise significantly, I do not mind paying funding every eight hours to maintain my position. The expected gain from the move exceeds the funding cost.
Funding becomes more useful as a contrarian signal when it reaches extremes and persists there. Historically, we saw extreme funding rates during all major tops and bottoms in Bitcoin over the years.
But with the introduction of ETFs and more institutional players coming in, funding rates are not what they used to be. Yield has gotten much lower than it was just few years ago.
This can be an issue for those who expect markets to top on 2021 levels of euphoric funding rates or bottom on 2022 FTX crash levels of yield.
Funding Rate Arbitrage
The basis trade (also called cash-and-carry) is one of the most common strategies in crypto. The setup is simple: when funding is positive, you buy spot and short the perpetual. You collect funding payments while being delta neutral.

Here is a concrete example:
You notice that ETH funding on Binance is running at 0.05% per 8 hours (about 55% annualized). You buy 10 ETH spot on Binance at $3,000 and simultaneously open a 10 ETH short perpetual position.
Your net exposure to ETH price is zero. Every 8 hours, you collect 0.05% on your short position, paid by the longs.
If funding stays at this level for a week, you collect roughly 1.05% return on a delta-neutral position. Scale this up and it becomes real money.
Some traders run this across exchanges. For example, you might hold spot ETH on Coinbase (where you can earn staking yield) and short perpetuals on Bybit (where funding is highest). This adds complexity but can improve returns.
Huge rise of decentralized exchanges also popularized the cross-exchange funding rate arbitrage.
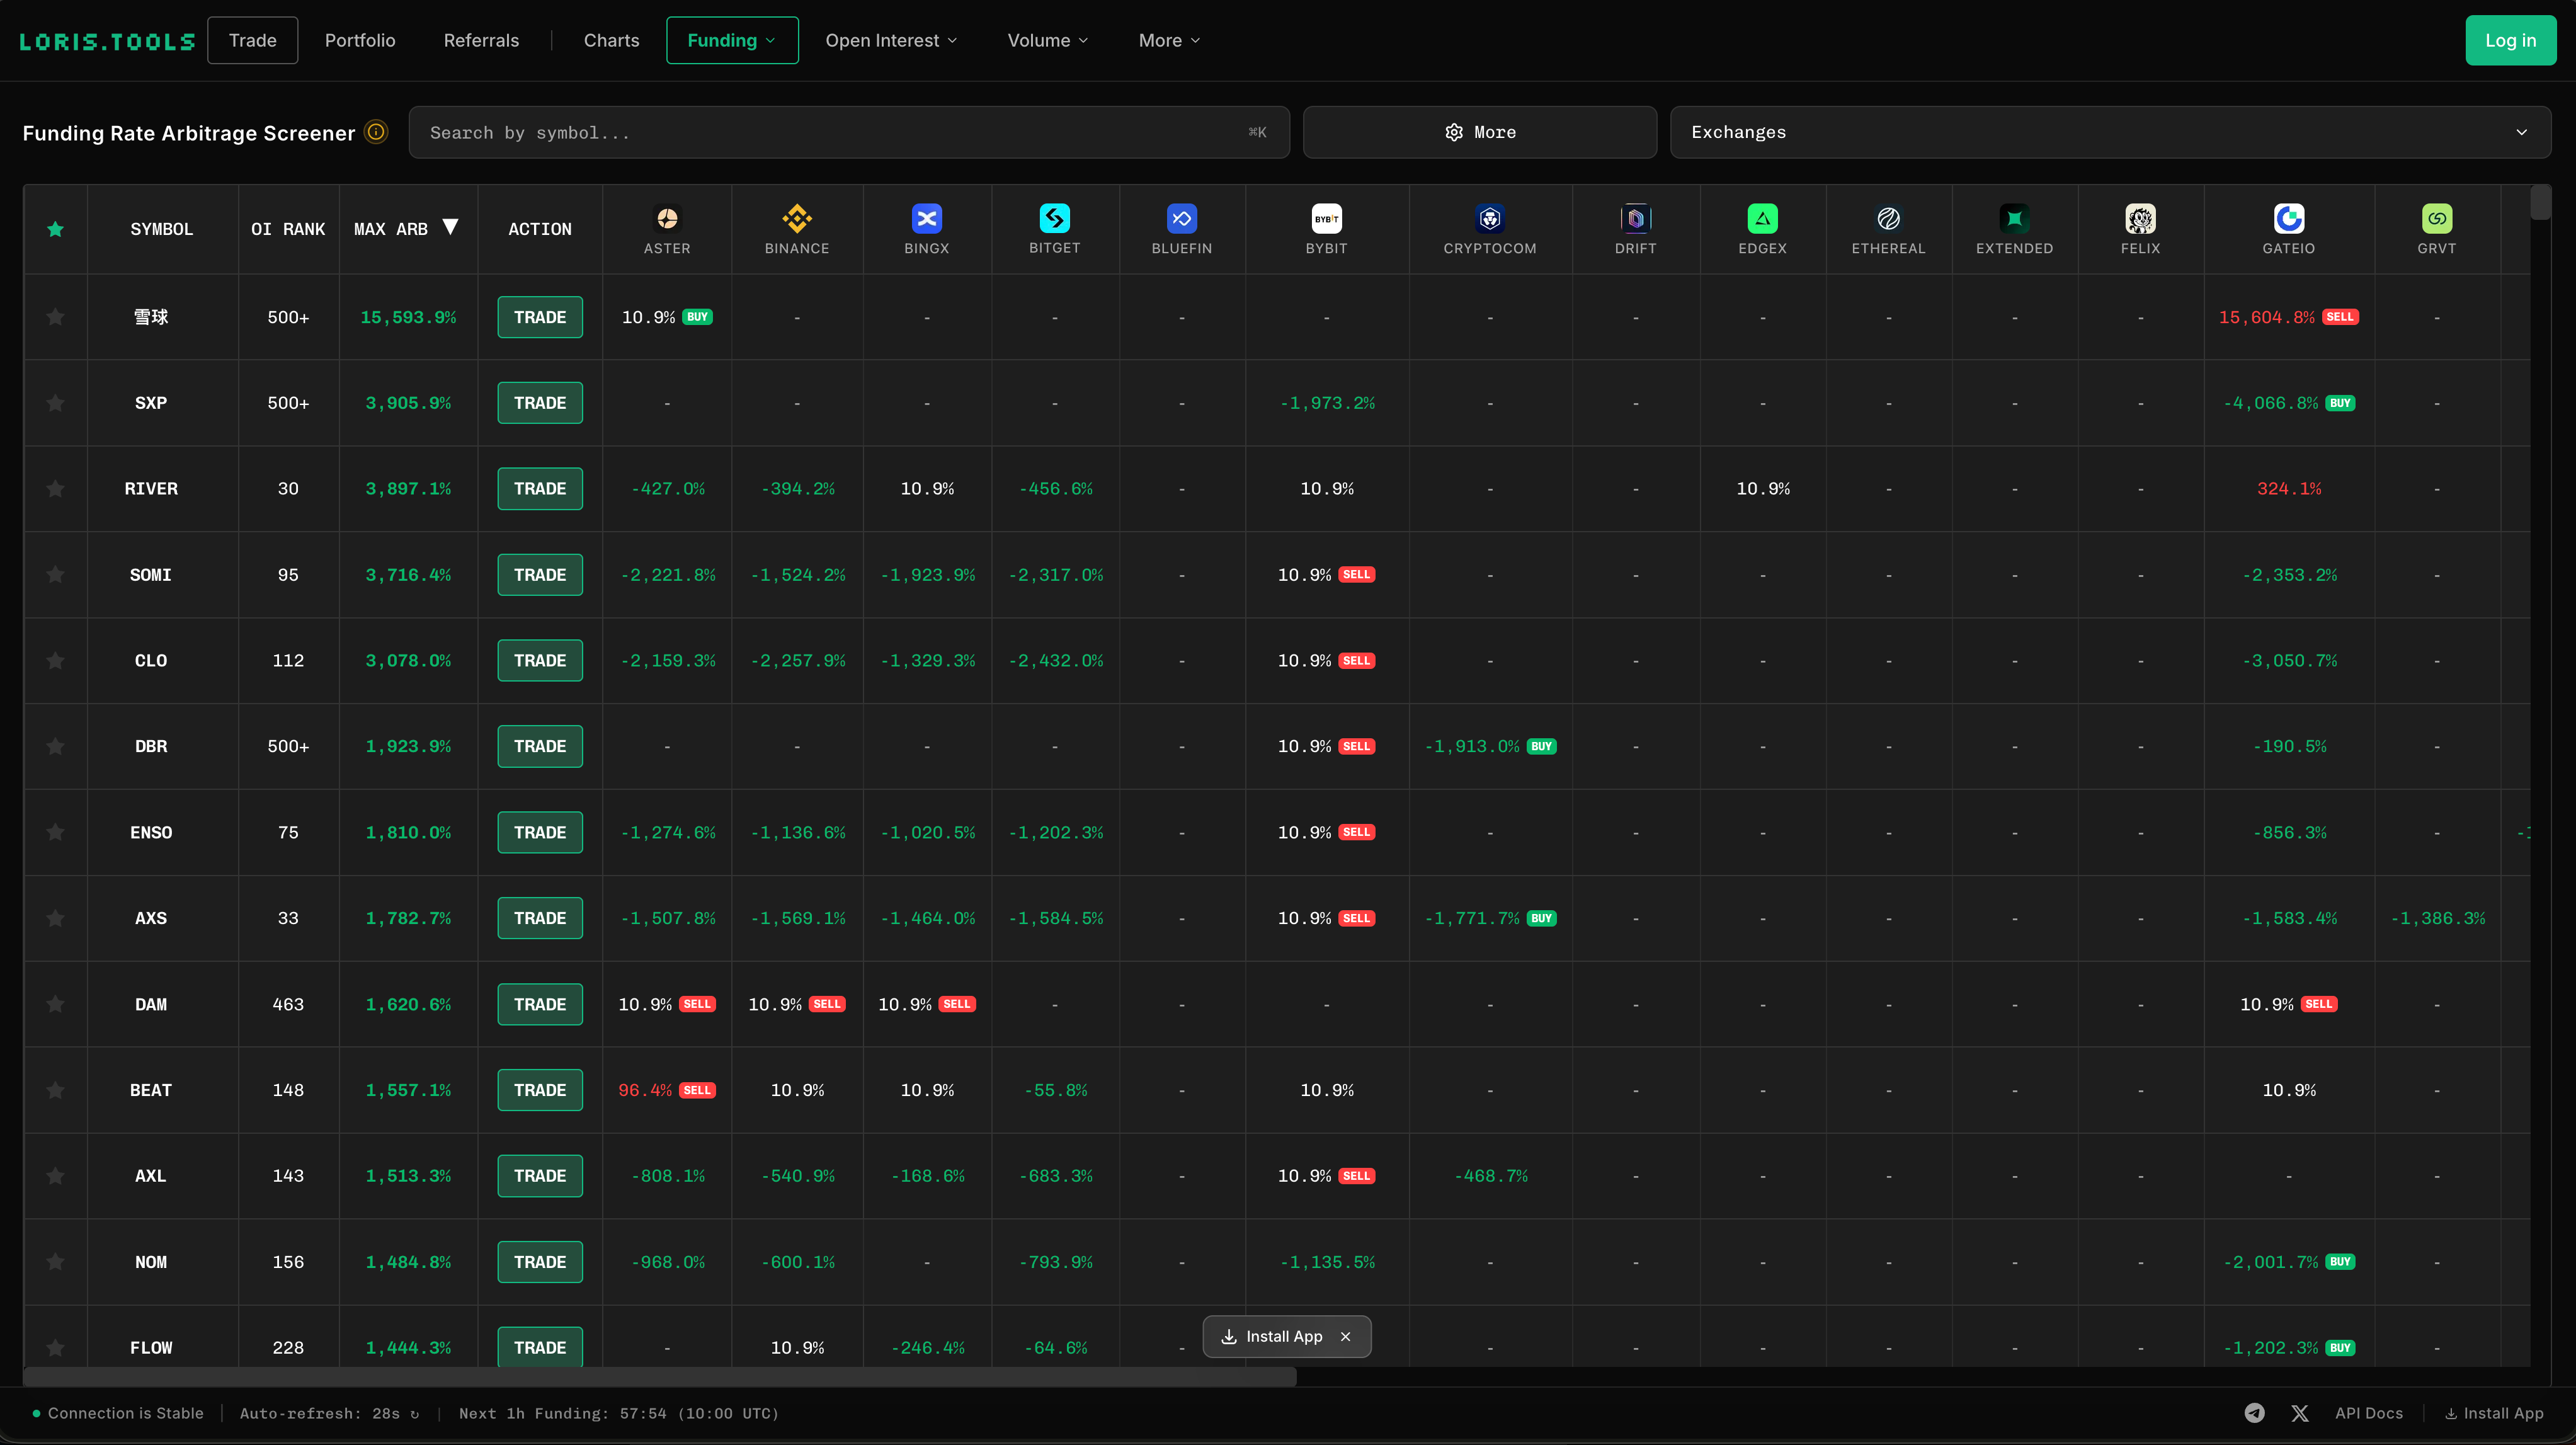
As you might notice on screenshot above, the same perpetual contract often has different funding rates across exchanges.
This creates arbitrage opportunities where you can collect funding on one exchange while paying less (or receiving funding) on another.
These opportunities often provide much higher yield, but also much greater risks.
For example, 雪球 (Snowball token) shows +10.9% on Aster and +15,604.8% on Gate.io.
If those numbers are accurate, you could short the perpetual on Gate.io (collecting massive funding) and long the perpetual on Aster (paying much smaller funding).
Your net position is delta neutral, but you pocket the funding differential.
The math on an extreme case like this:
You short 1,000 USDT notional on Gate.io at +15,604% annualized funding. You long 1,000 USDT notional on Aster at +10.9% annualized funding. Your net funding is roughly (15,604% - 10.9%) / 365 = ~42% per day.
These funding rates obviously do not last for the whole year, but can still yield nice returns as the spreads are massive.
Why These Spreads Exist
Funding rates reflect supply and demand on each specific exchange. A token might have heavy short interest from hedgers on one venue and heavy long interest from speculators on another.
Low liquidity altcoins show the widest differentials because arbitrageurs cannot easily move size between venues to close the gap.
Additional Risks of Cross-Exchange Arbitrage
Beyond the standard basis trade risks, cross-exchange funding arbitrage adds:
Capital inefficiency. You need margin deposited on both exchanges. Your capital is split, reducing overall returns and creating rebalancing headaches.
Transfer delays. If one leg gets liquidated or funding flips, you cannot instantly move funds to rebalance. Blockchain transfers take time, and some exchanges have withdrawal delays.
Price divergence. The perpetual price itself can differ between exchanges. You might enter at slightly different prices, creating unintended directional exposure. During volatile moves, this divergence can widen significantly.
Counterparty concentration. Many of the exchanges showing extreme funding rates are smaller, less established venues. The highest yields often come with the highest counterparty risk.
Liquidity on exit. Getting into a position is easy. Exiting a large position on a low-liquidity exchange during a volatile move is where the trade falls apart. Slippage on exit can erase weeks of funding.
The tokens showing -2,000% annualized funding exist for a reason.
The market is paying you that rate because holding long exposure is painful, whether from constant price decline, upcoming unlocks, or structural selling pressure.
Funding arbitrage is a risk premia which works until the moment it does not.

Risks of the Basis Trade
Even if you only focus on “safer” basis trades, they are still not risk-free, despite being delta neutral.
Funding rate reversal. Funding can flip negative. If you are short perpetual and funding turns negative, you start paying instead of collecting. Unwinding the position during a funding reversal often means taking a loss.
Liquidation risk. Your short perpetual requires margin. If the spot price spikes hard and fast, your short can get liquidated before you can add margin, even though your spot position gained value.
This is especially dangerous if you are running the trade across exchanges, since your spot collateral on one exchange cannot cover your margin on another.
Exchange risk. Running the trade across venues means you have counterparty exposure to multiple exchanges. If one exchange freezes withdrawals or goes down (we have seen this happen), you are stuck with a one-sided position.
Execution risk. You need to enter and exit both legs simultaneously. In volatile markets, slippage on one leg can eat into your profits or create unintended directional exposure.
What Drives Extreme Funding Rates
Extreme positive funding happens during euphoric rallies when everyone wants to be long. The demand for long exposure exceeds the available supply of shorts, so longs pay a premium to maintain their positions.
Extreme negative funding is more interesting and happens frequently in altcoins.
A few dynamics drive this:
Market makers hedging. When market makers sell tokens to retail buyers in spot markets (during token unlocks, airdrops, or just normal selling), they often hedge by shorting perpetuals. This creates selling pressure on the perpetual side, pushing funding negative.
Anticipated unlocks or sell pressure. If a large token unlock is approaching, traders front-run the expected selling by shorting perpetuals. This drives funding deeply negative even before the actual selling happens.
Lack of organic long demand. Many altcoins simply do not have enough buyers who want leveraged long exposure. The short side is dominated by hedgers and speculators betting on the project failing, while the long side is thin. This structural imbalance keeps funding persistently negative.
Spot premium dynamics. Sometimes altcoins trade at a premium on spot markets (due to low float, exchange listing differences, or withdrawal issues) while perpetuals trade closer to fair value. This creates persistent negative funding.
You will often see altcoins with funding rates of -0.1% to -0.5% per 8 hours (that is -100% to -500% annualized).
This is the market paying you to be long, which sounds attractive until you realize the token might drop 80% anyway.
The funding income rarely compensates for the directional risk, but these trades are still worth exploring.
If I am being honest, I do not really trade low market cap altcoins anymore.
But what I used to do a lot was look at these extremely negative funding rate flips very early on to try to find the next “scam pump”.
At the end of the day, it does not really matter what causes funding to go extremely negative.
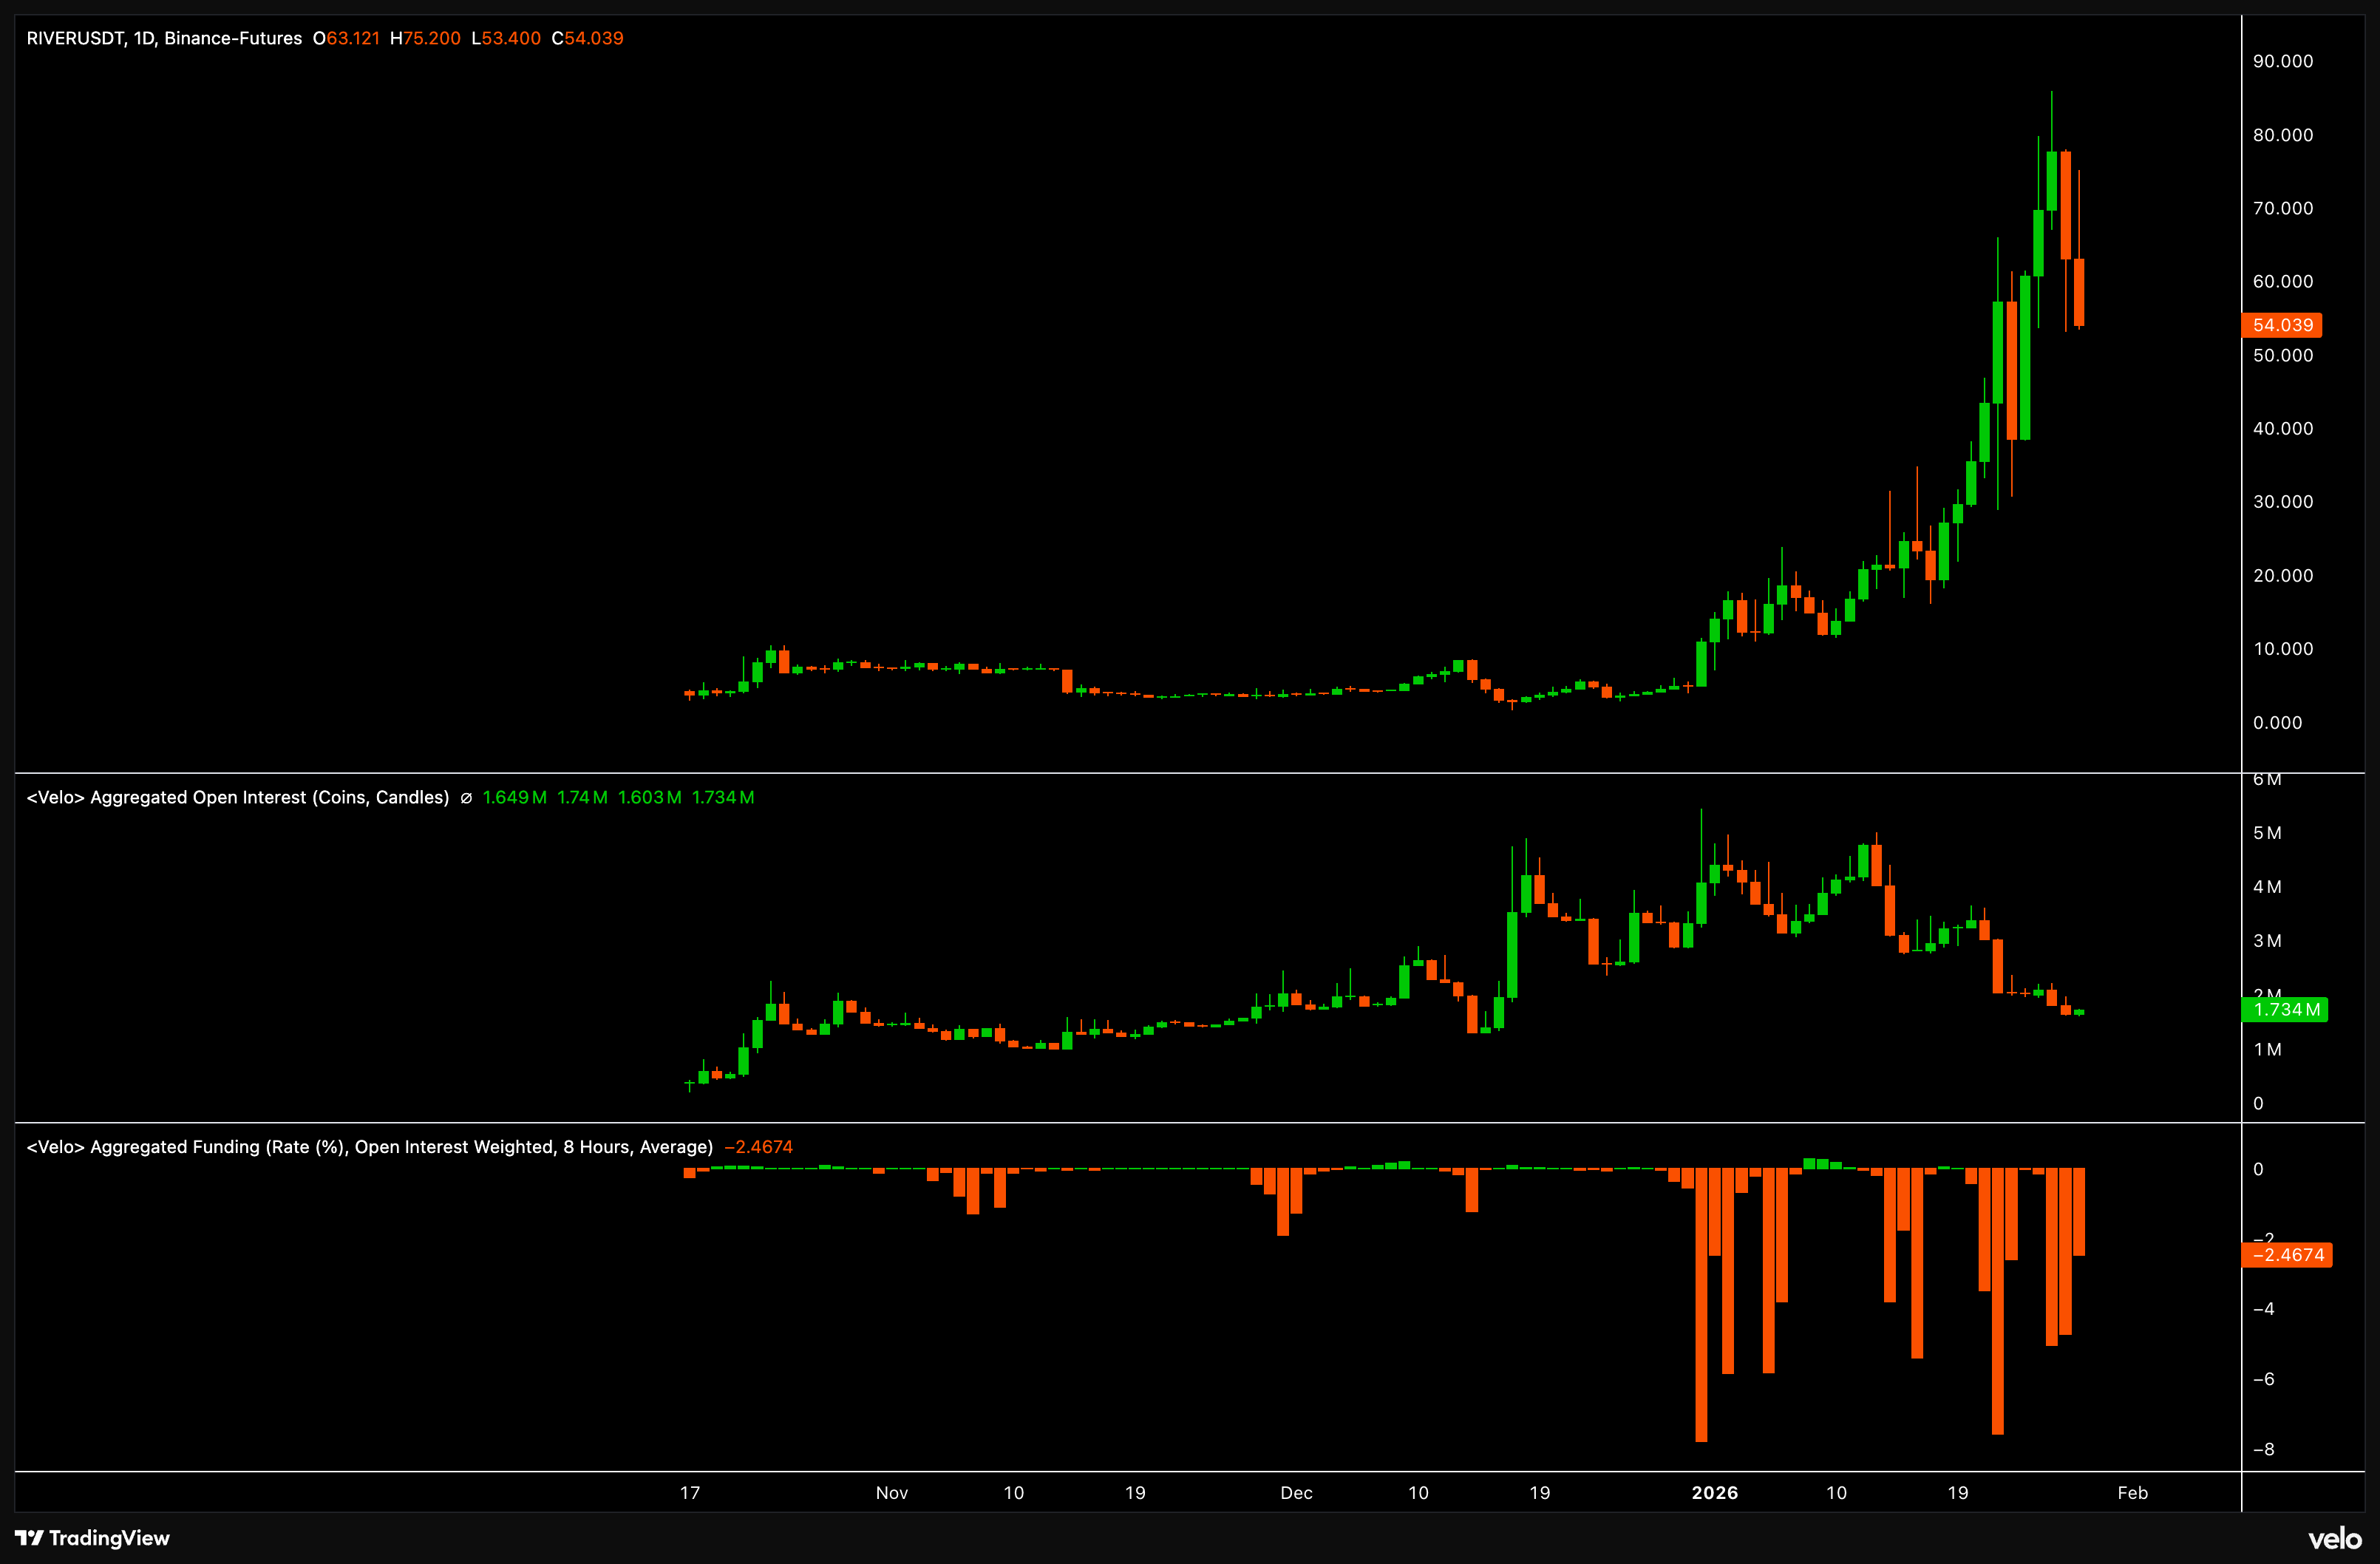
What matters is seeing large open interest rise alongside negative funding.
This tells you that while perpetual traders are opening positions, the discount against spot persists.
Someone is aggressively shorting perpetuals while spot buying happens elsewhere, often market makers hedging spot accumulation or insiders positioning before a move.
You will often see this at the very early stages of these pumps, with price action still looking muted.
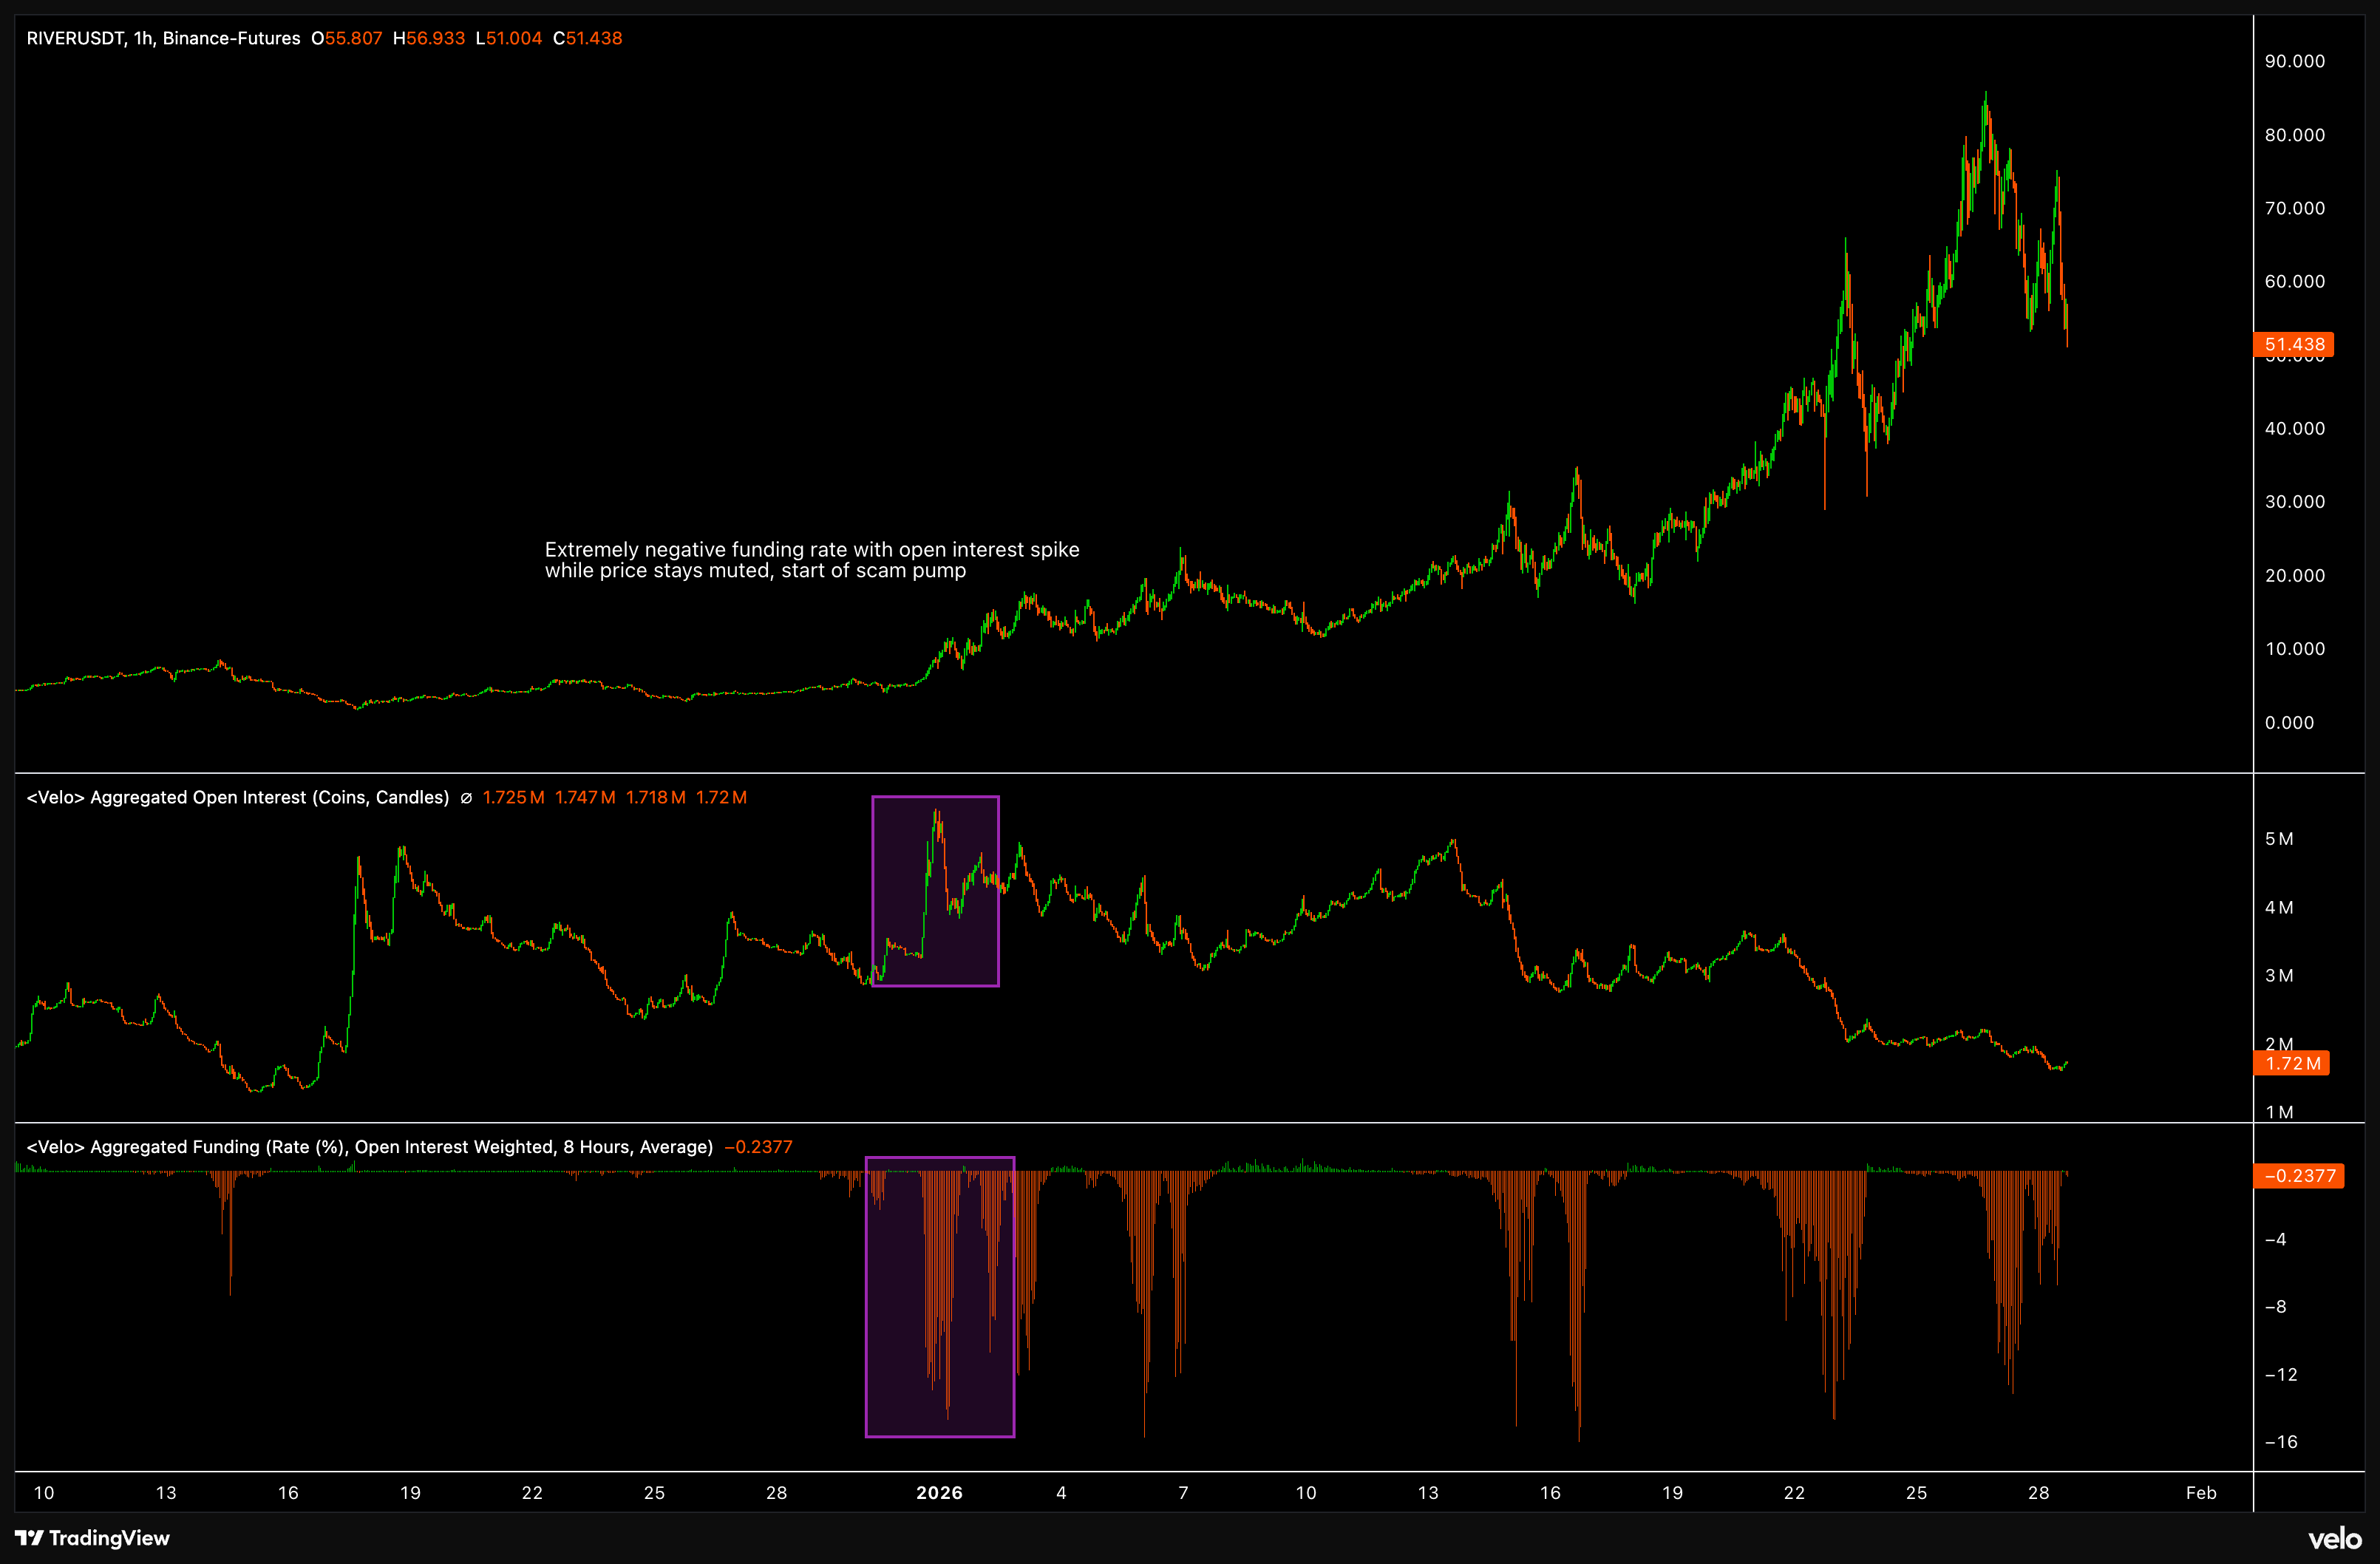
The chart of RIVER shows this pattern clearly: open interest spiked while funding went deeply negative, all while price barely moved. What followed was a multi-hundred percent rally.
While funding often stays negative even at the top, by the time prices are trading at several multiples of their daily ATR, you are already too late to enter.
The edge is in spotting the setup early, when the data looks unusual but the price chart looks boring.
You can obviously also try to short the top, as these almost always dump back down.
But I would argue that trade is extremely hard to time.
At the highs the trade is already very crowded, you are paying funding on the short side, and the market can stay silly longer than you can stay solvent.
Open Interest
Open interest measures the total number of outstanding contracts that have not been closed. It tells you how much money is committed to positions in a given market.
For every buyer, there has to be a seller.
This is important to understand. When people say “more buyers than sellers,” they are not speaking precisely. In derivatives markets, the number of long contracts always equals the number of short contracts.

What changes is the composition of who is taking those positions.
Consider three traders in a new market with zero open interest:
Trader A thinks the market will rise and places a limit buy at $100. Trader B thinks it will fall and sells into that bid. Open interest is now 1.
The market rises to $150. Trader C wants to go long. Trader A decides to exit by selling his position. Trader C buys it. Did open interest change? No.
One long exited, one long entered. Still 1 contract open.
At $200, Trader B has had enough and buys to close his short. Trader C sells to close his long. Both sides exit. Open interest goes back to 0.
The three scenarios:
Both sides open new positions → Open interest increases
Both sides close positions → Open interest decreases
One side opens while the other closes → Open interest stays flat
So why do prices move if every buyer needs a seller?
Market makers. They provide liquidity by quoting both sides of the market and collecting the spread. They want to stay delta neutral, meaning they do not care which direction the market goes.
When directional traders (people who have an opinion) want to get long, they buy from market makers who take the short side.
The market makers then hedge by buying spot or other venues. This buying pressure moves prices up.
If many directional traders want to go long on rising prices, open interest increases alongside price. This tells you new demand is entering the market.
If open interest decreases while prices move, it means traders are closing positions rather than opening new ones.
Large decreases in open interest often coincide with liquidation cascades.
The areas where significant open interest builds often act as important price levels.
Think of it as money committed at specific prices that traders will defend or be forced out of.
Open interest is obviously not a unique crypto concept.
What is unique, though, is that changes in open interest are shown live compared to venues like CME, which updates them once per day with open interest scattered between different expirations.
I would say that this feature alone gives you a large advantage in trading perpetuals instead of any other derivative.
The directional flow, especially in altcoins, is still very much retail driven, and there are many platforms that aggregate data across multiple venues. It is very easy to see what is happening across exchanges in real time.
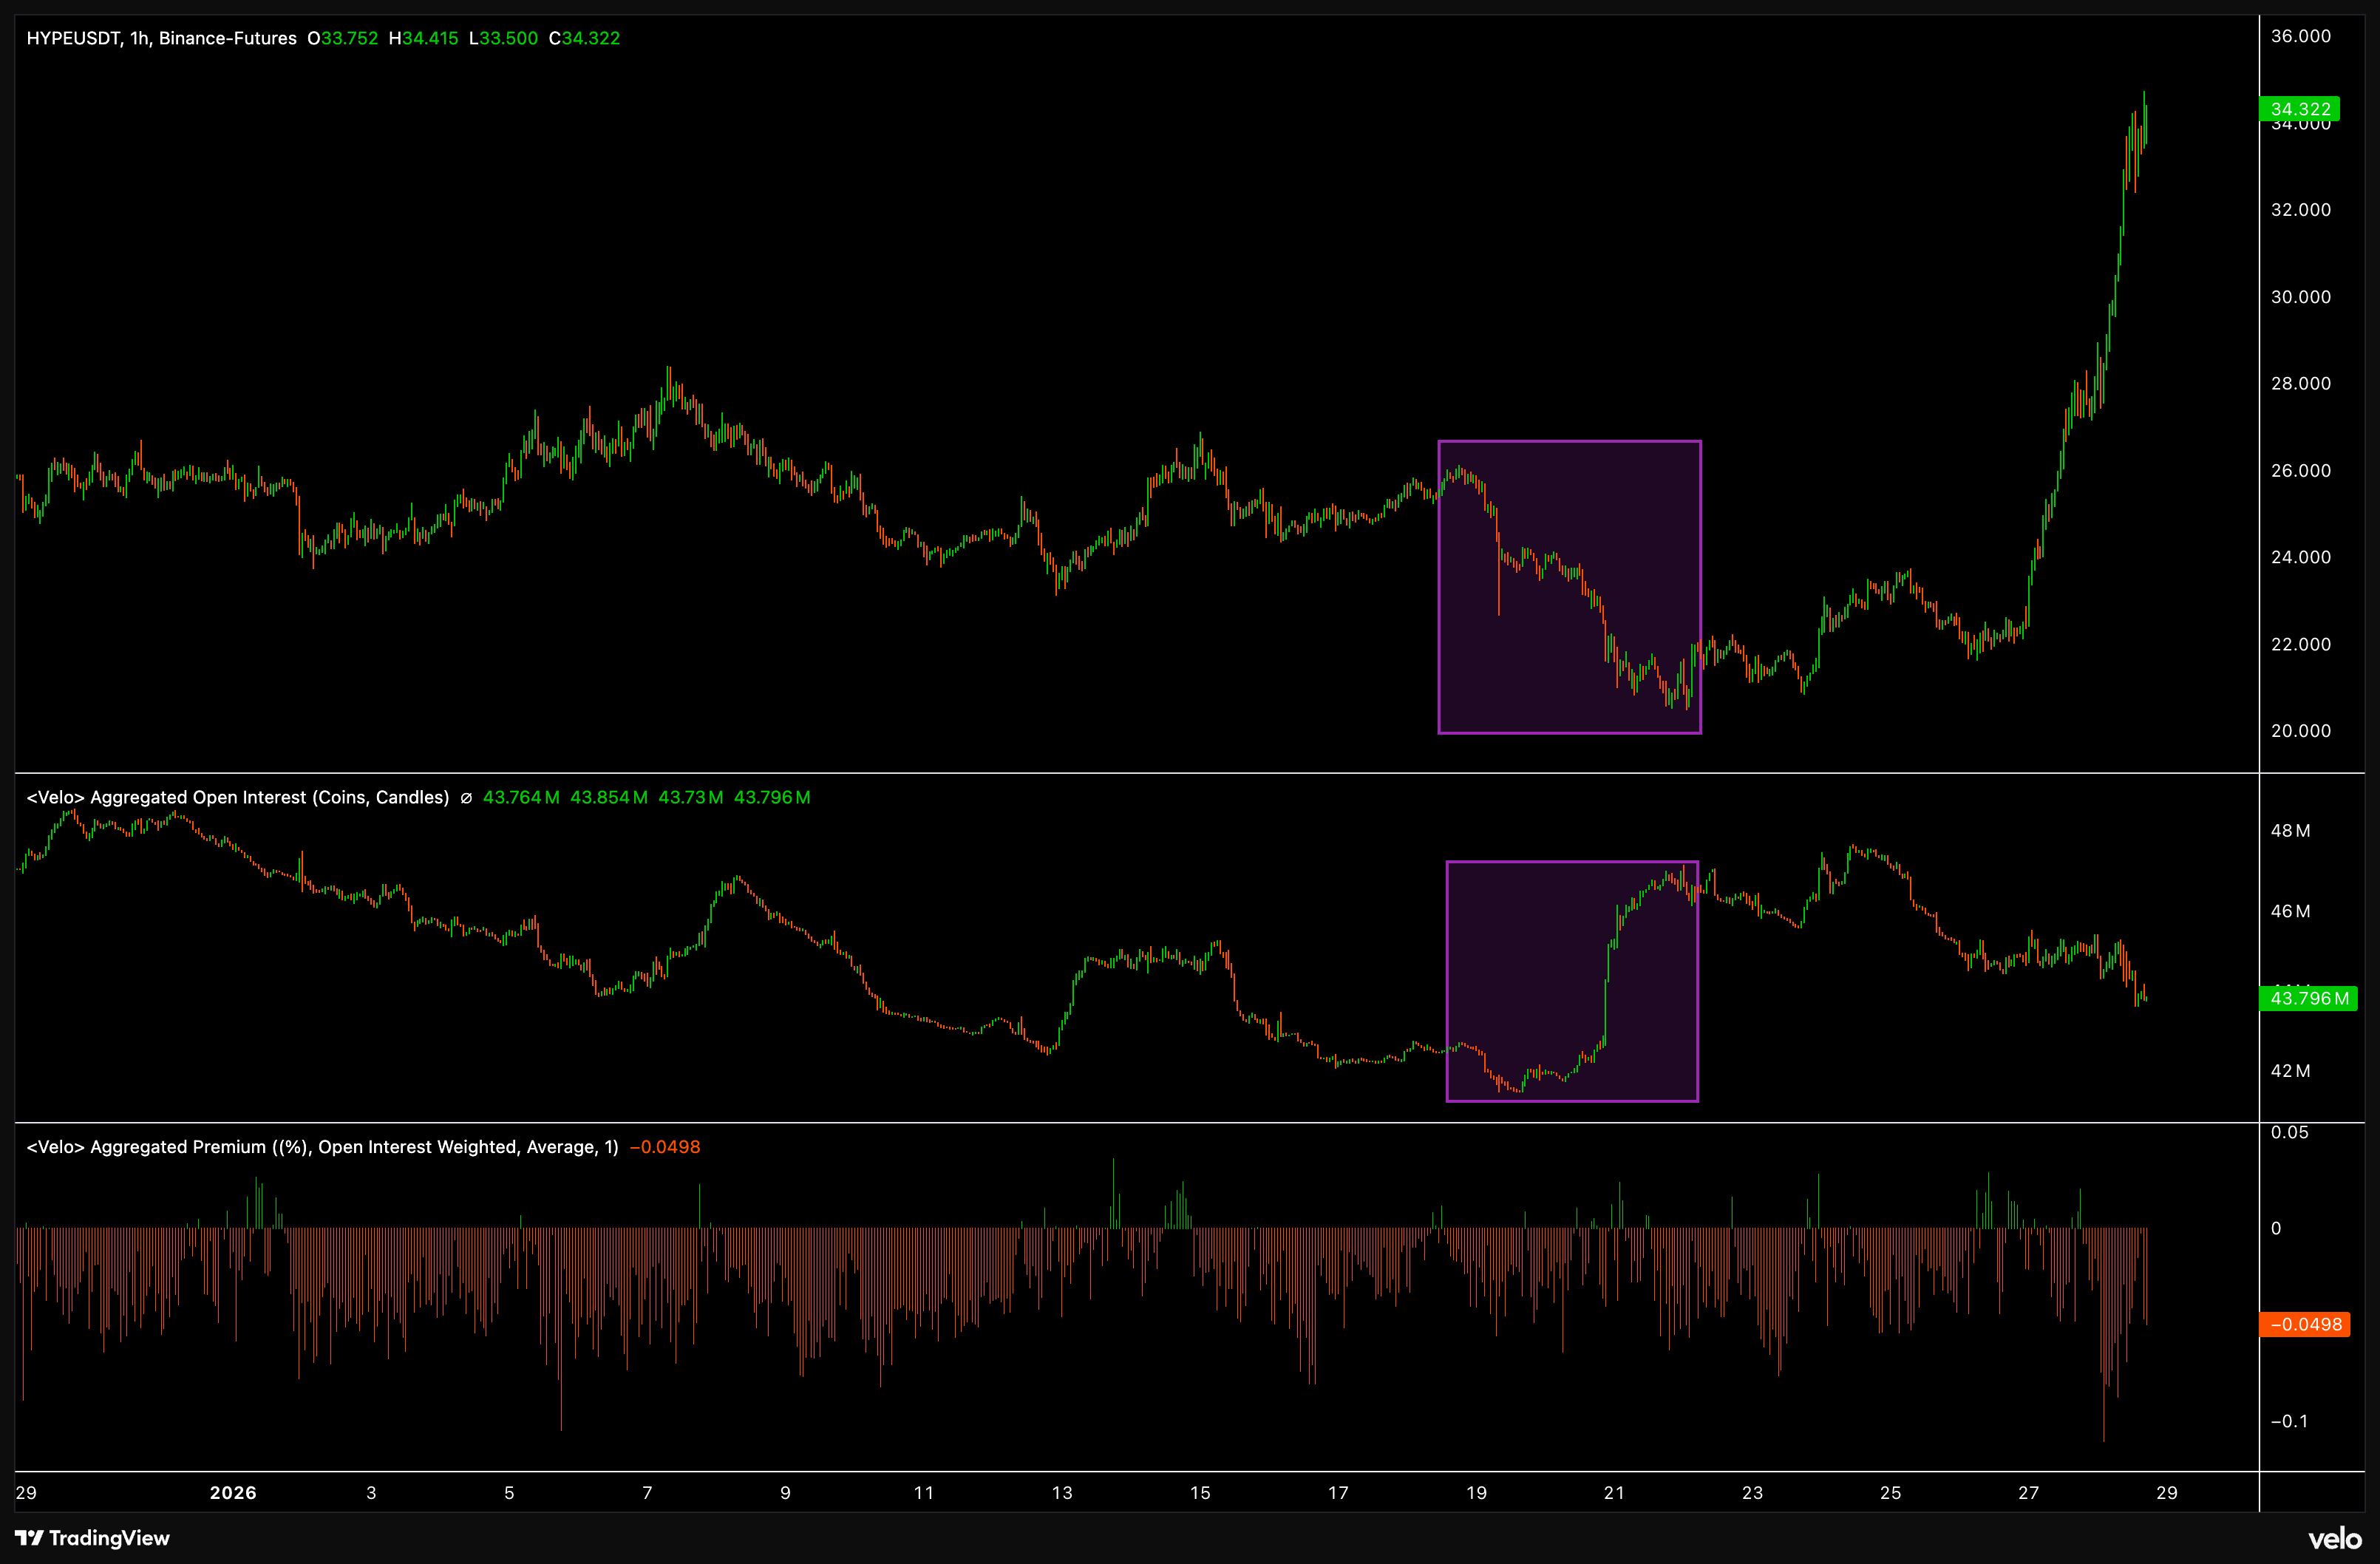
As you can see in example above, price dropping down while open interest rising in Hype with consistently negative premium (funding rates stripped off interest rate), followed by a classic short squeeze.
Open Interest as a Positioning Indicator
Open interest can work well as a sentiment indicator on larger lookbacks, considering that most participants are long and rarely short.
This is why open interest is almost always elevated at highs and depressed at lows.
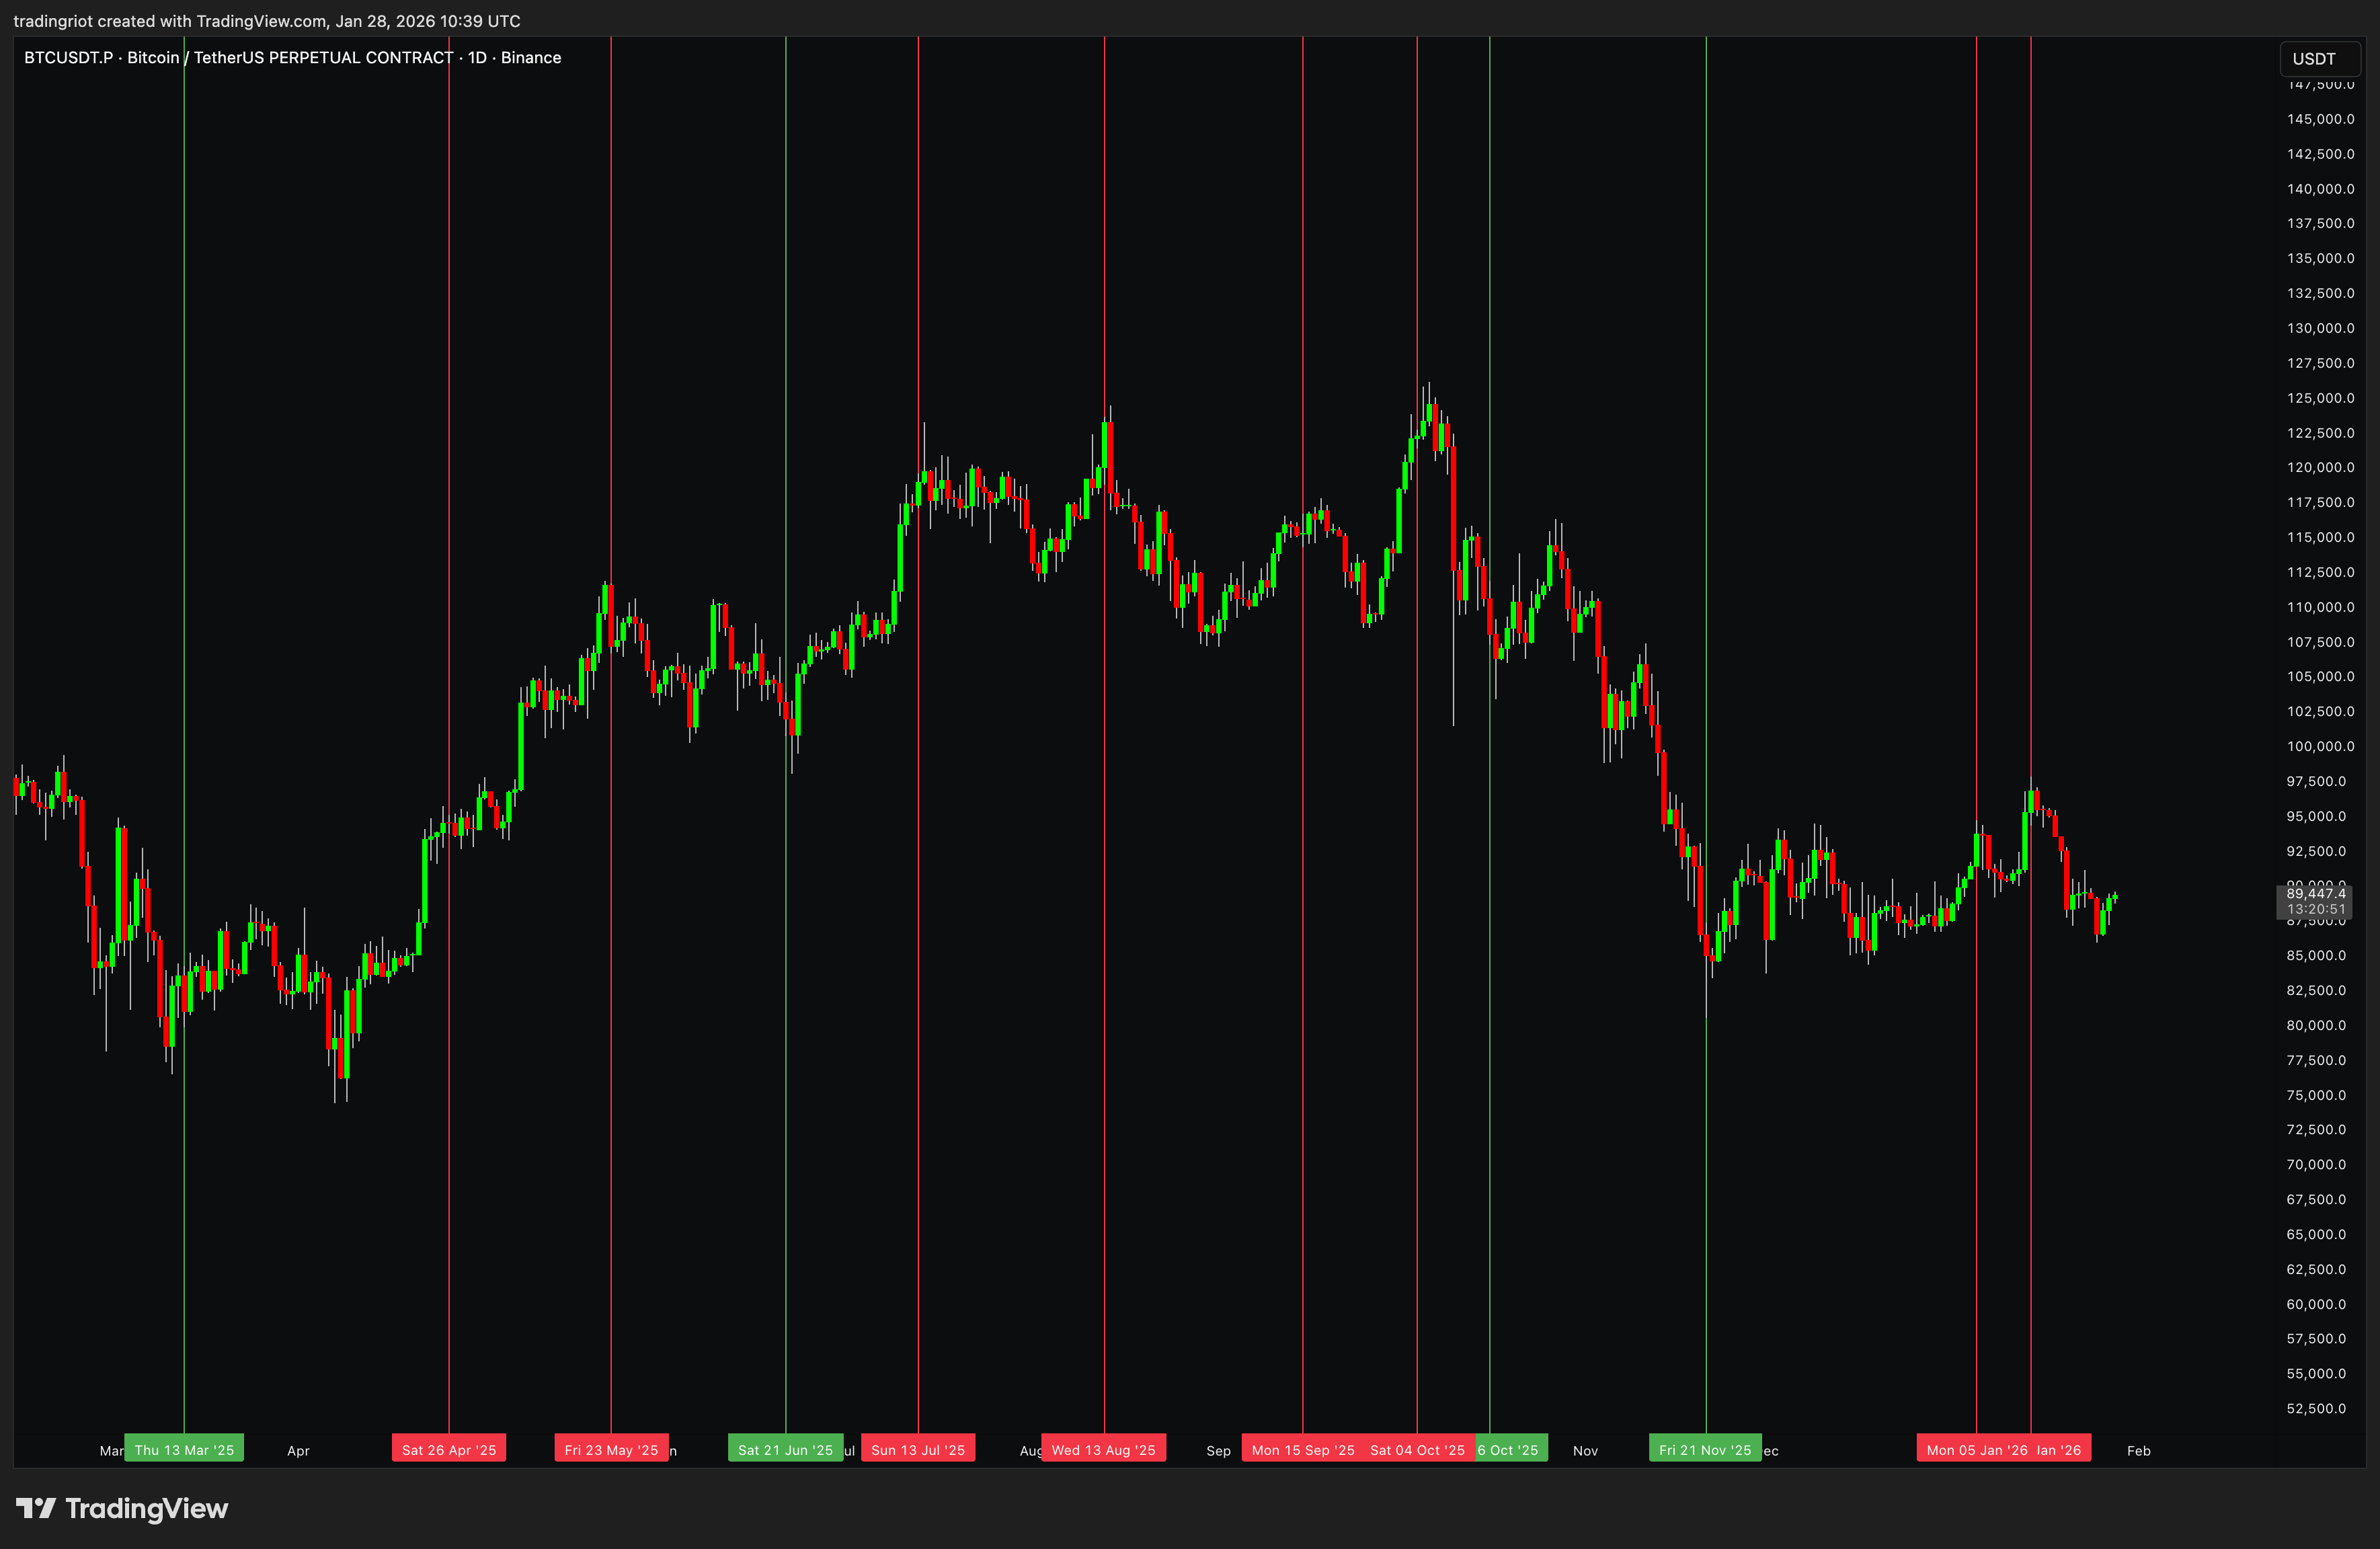
Knowing this, we can turn open interest into a standard deviation indicator to identify extreme levels of positioning. This has historically worked well for finding tops and bottoms across the board.

Here you can see a price overlap of every time open interest crossed above or below two standard deviations using a 30-day lookback.
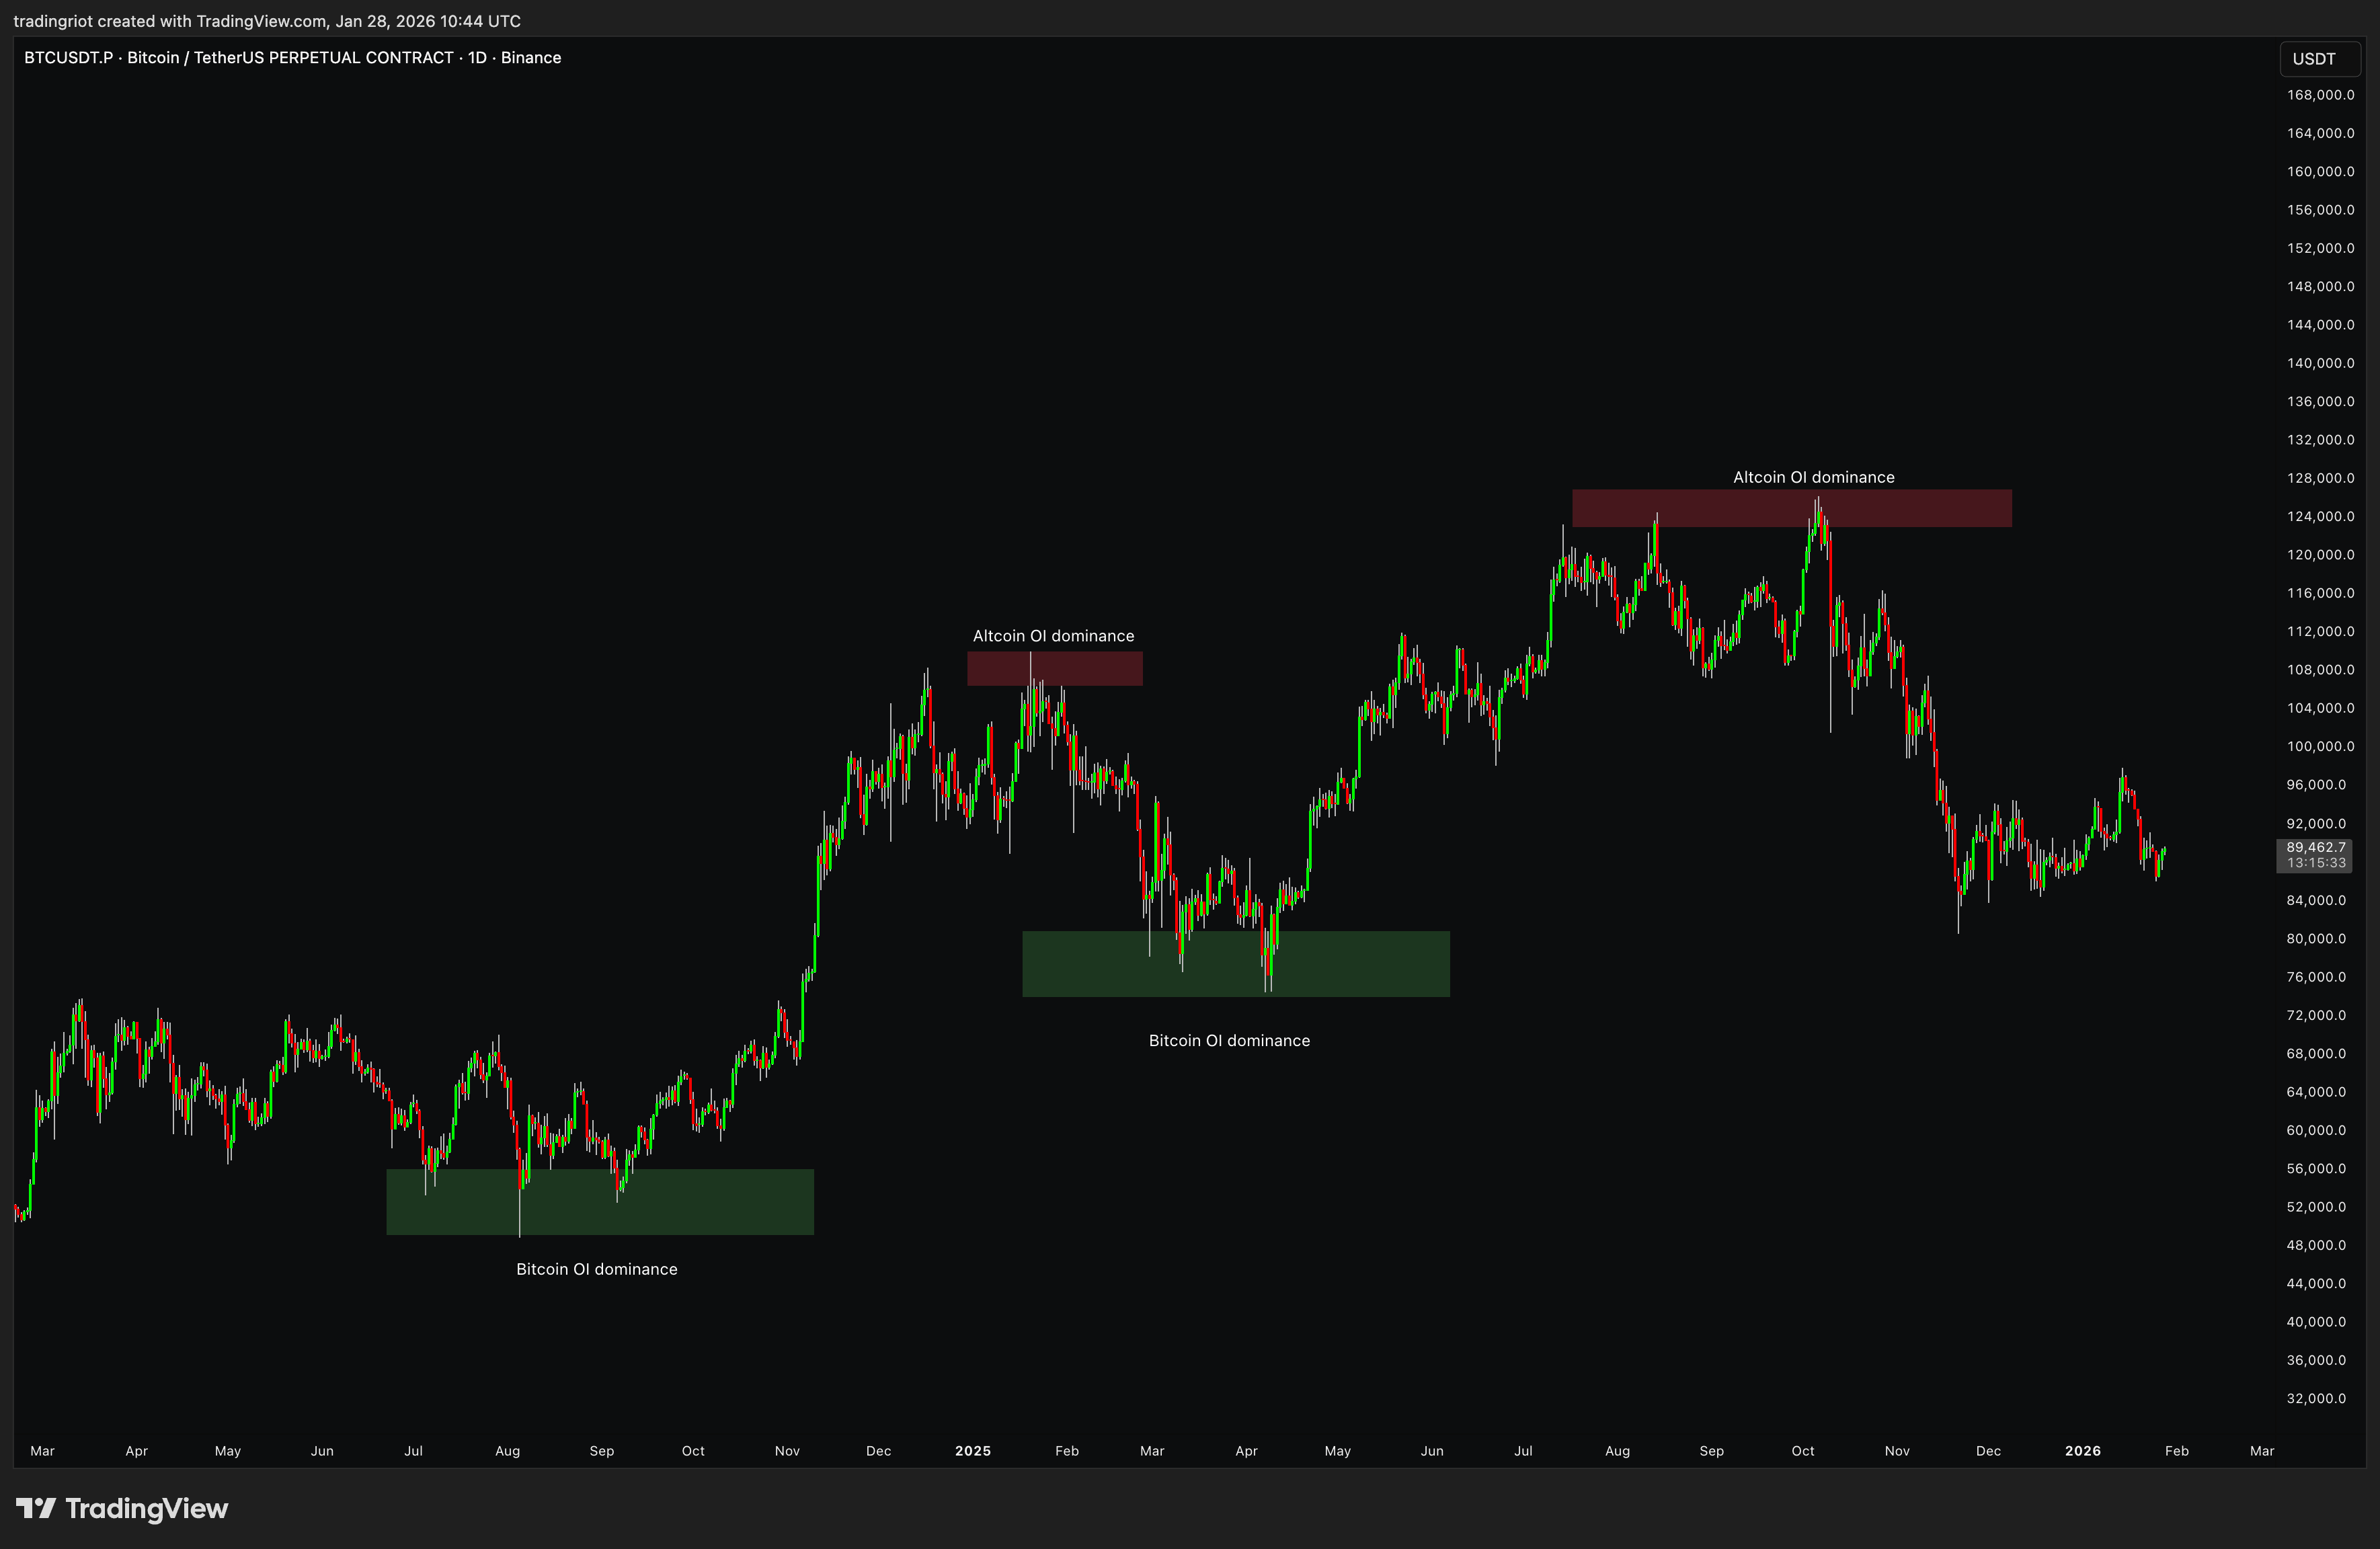
Another interesting relationship exists between Bitcoin and altcoin open interest.
Open interest often flows to altcoins during euphoria and concentrates in Bitcoin during fear.

Plotting this on a chart of Bitcoin (which will have the inverse effect of the indicator above), you can see that at all recent highs open interest was dominated by altcoins, while at all recent bottoms open interest was dominant in Bitcoin.
Liquidations
Perpetual futures are traded on leverage, which means you do not need the full notional value to open a position.
If Bitcoin is at $100,000 and you want to go long 1 BTC but only have $10,000, you use 10x leverage. The exchange provides the rest. Your $10,000 margin is at risk.
If Bitcoin falls to $90,000, you are down $10,000 on a $100,000 position. That is your entire margin. The exchange will not let you lose their money, so you get liquidated.
This is conceptually similar to a margin call in traditional futures, but the execution differs significantly.
On CME, if your account falls below maintenance margin, you receive a margin call and typically have until the next business day to deposit additional funds.
Crypto exchanges often send margin call notifications via email and app when your margin ratio deteriorates, but in volatile markets, price can move so fast that you hit the liquidation threshold immediately after (or simultaneously with) the margin call.
For example, Binance explicitly states they have “no obligation” to guarantee timely delivery of these notifications, and that liquidation can occur before you have any chance to react.

In practice, during sharp moves, the margin call and liquidation happen nearly simultaneously. There is no grace period like in traditional markets.
The exact liquidation price depends on your leverage, initial margin, and the exchange’s maintenance margin requirements.
Exchanges do not liquidate you based on the last traded price.
Instead, they use a mark price derived from a spot index across multiple exchanges. This prevents manipulation where someone could wick the price on a single low-liquidity venue to trigger liquidations.
If you are watching your position and the last traded price hits your liquidation level but you do not get liquidated, this is why.
The mark price smooths out anomalies and protects traders from artificial price spikes.
Most platforms show both prices, and your liquidation is always calculated against the mark.
Most platforms show you the liquidation price when you open a position.
It goes without saying that many retail traders use high leverage.
At 100x, a 1% move against you triggers liquidation. At 10x, it takes a 10% move. Crypto can easily move 10% in a day, and even Bitcoin regularly sees 3-5% intraday swings.
When the market moves sharply in one direction, leveraged traders on the wrong side get liquidated.
Liquidation is a forced market order to close your position.
If many liquidations happen at once, this creates additional selling (for liquidated longs) or buying (for liquidated shorts) pressure.
Liquidation Cascades
This can cascade. Liquidations push price further in the same direction, triggering more liquidations, which pushes price even more. These liquidation cascades are responsible for some of the sharpest moves in crypto.
The mechanics work like this: imagine Bitcoin drops from $100,000 to $97,000. This 3% move liquidates traders using 30x+ leverage. Their forced selling pushes price to $95,000.
Now 20x leveraged longs get liquidated, pushing price to $92,000.
The 10x longs start getting hit. Each wave of liquidations feeds the next, and price can move 10-15% in minutes with no fundamental news driving it.
The same works in reverse. A sharp move up liquidates shorts, their forced buying pushes price higher, more shorts get liquidated, and you get a short squeeze that sends price parabolic.
These cascades are why crypto volatility is structurally higher than traditional markets.
The leverage available, combined with automatic liquidations and 24/7 trading, creates feedback loops that do not exist in regulated futures markets with circuit breakers and actual margin call grace periods.
But there is another layer to this that most traders do not understand until it hits them: Auto-Deleveraging (ADL).
When liquidations overwhelm the system and the exchange’s insurance fund is depleted, exchanges activate ADL.
This mechanism forcibly closes profitable positions to cover the losses of bankrupt traders. You read that correctly.
You can have the right trade, be massively in profit, and still have your position closed against your will because the exchange needs your winnings to stay solvent.
October 10th 2025
On October 10, 2025, the crypto market experienced its largest single-day liquidation event in history when roughly $19 billion in leveraged positions were liquidated within 24 hours.

Bitcoin dropped from around $124,000 to below $100,000. Altcoins fell even harder.
But what made this event particularly painful was what happened to traders who got the direction right.
Many traders were short with high leverage, perfectly positioned for the crash. They should have made massive profits.
Instead, they watched their positions get forcibly closed by ADL. Hyperliquid alone liquidated $10.3 billion that day, more than Binance ($2.4 billion) and Bybit ($4.6 billion) combined.
It was Hyperliquid’s first cross-margin ADL activation in over two years of operation.
When long positions got liquidated en masse, exchanges needed counterparties to close those positions.
Normally, the insurance fund covers this. But when losses exceeded the fund’s capacity, exchanges turned to profitable shorts.
ADL ranked traders by profitability and leverage, then forcibly closed their winning positions to balance the books.
Approximately 35,000 positions across 20,000 traders on Hyperliquid were affected by ADL.
Some traders who had timed the crash saw half or more of their profitable positions closed without consent.
Binance burned through roughly $188 million of its insurance fund in a single day before resorting to ADL.
The October 10 crash also revealed another risk: exchange infrastructure failures.
Multiple platforms experienced frozen interfaces during the crash, preventing traders from managing positions or buying the dip.
Some traders could not add margin to avoid liquidation.
Others could not close positions manually. The combination of cascading liquidations, ADL activation, and platform outages created a perfect storm.
Market makers were also hit hard.
Many run delta-neutral strategies with long spot positions hedged by short perpetuals. When ADL forcibly closed their short futures, they were left with unhedged long exposure at exactly the wrong moment.
According to BitMEX research, this left market makers “stuffed with coins,” contributing to reduced liquidity and slower trading for weeks afterward.
ADL is another mechanism unique to perpetual futures that traders need to understand.
Although it is rare to see it triggered, when it does happen it can be devastating, even to traders who got the direction right.
The October 2025 crash was a stark reminder that in perpetual futures markets, being correct is not always enough.
Exchange solvency comes first, and your profitable position can be sacrificed to maintain it. This is a risk that simply does not exist in spot markets or traditional futures with clearinghouse guarantees.
Trading Into Liquidations
Liquidations can act as mean reversion signals.
If you see a flush that takes out a large number of leveraged traders, the forced selling or buying may be exhausted, creating an opportunity to trade the other direction.
There is genuine risk premium in taking these trades.
You are providing liquidity when others are being forced out.
The discomfort of buying into a sharp drop or selling into a squeeze is exactly why the edge exists. Markets pay you for being willing to take the other side of forced flows.
In trending markets, you can wait for over-leveraged late entrants to get liquidated before entering in the direction of the trend.
Fees and Liquidity
Trading perpetual futures involves two types of fees: trading fees and funding payments.
We have covered funding extensively.
Trading fees deserve their own attention because they work differently than what most traders expect from traditional markets.
Maker and Taker Fees
Crypto exchanges use a maker-taker fee model. The distinction is simple: makers (limit orders) add liquidity to the order book, takers (market orders) remove it.
If you place a limit order that does not immediately execute, it sits on the book and provides liquidity for others.
You are a maker. If you place a market order or a limit order that executes immediately against resting orders, you are a taker.
Taker fees are always higher than maker fees. On most major exchanges, taker fees range from 0.04% to 0.06% while maker fees range from 0.01% to 0.02% at base tier.
Some exchanges offer negative maker fees at higher tiers, meaning they pay you to provide liquidity.
This is how market makers and high-frequency traders operate profitably even on tight spreads.
Fee Tiers
Exchanges use volume-based fee tiers. The more you trade, the lower your fees.
A retail trader paying 0.05% taker fees competes against professionals paying 0.01% or less.
This creates a structural disadvantage for smaller traders, especially on high-frequency strategies where fees compound quickly.
A strategy that looks profitable at institutional fee tiers can be a loser at retail tiers.
Most exchanges also offer fee discounts for holding their native tokens or using specific collateral types.
Binance reduces fees for BNB holders, Bybit for holding their token, and so on. These discounts can be meaningful, often 10-25% off base rates.
Zero-Fee Models
Not all exchanges follow the traditional fee structure.
Lighter, a decentralized perpetuals exchange, has implemented a zero-fee model similar to what Robinhood did for equities.
The logic is the same, remove the visible fee to attract volume, then monetize order flow differently.
Robinhood sells order flow to market makers who pay for the right to execute against retail traders.
The market makers profit from the spread and informational edge, giving Robinhood a cut.
The customer pays no commission but often receives slightly worse execution.
Lighter and similar zero-fee venues work on comparable principles.
They may route flow to preferred liquidity providers, capture spread through integrated market making, or monetize through other mechanisms like token incentives or cross-subsidization from other products.
The trade-off is the same as in traditional markets: you are not paying an explicit fee, but you might be paying implicitly through wider spreads or worse fills.
For retail size, this often works out favorably. For larger traders, the hidden costs can exceed what they would pay in explicit fees on a transparent venue.
Zero-fee models also raise questions about sustainability.
Robinhood’s model works because equity market makers have massive edge against uninformed retail flow.
In crypto, where information asymmetry is different, the economics are less proven.
Whether these models persist or evolve remains to be seen, but they represent an interesting experiment in exchange business models.
Adverse Selection Risk
Zero-fee models create another problem: adverse selection against passive limit orders.
When you place a limit order on a traditional exchange, you pay lower fees (or receive rebates) as compensation for providing liquidity.
This rebate exists because limit orders carry risk. You get filled when the market moves against you and your order becomes attractive to someone with better information.
On a zero-fee venue, there is no rebate to compensate for this risk.
Market makers and faster participants can pick off stale limit orders when prices move, leaving passive traders holding losing positions.
You wanted to buy at $100, the market gaps to $99, and your order gets filled right before it continues to $95.
Professional market makers manage this by constantly adjusting quotes and using sophisticated infrastructure to avoid being picked off.
Retail traders placing limit orders do not have these tools.
Some view this as fundamentally unfair.
The zero-fee promise attracts traders who think they are getting a better deal, but the lack of maker rebates means passive liquidity providers subsidize the system through adverse fills.
The exchange and its preferred participants extract value that used to flow to anyone willing to post limit orders.
Whether the zero-fee trade-off works in your favor depends on how you trade.
If you are primarily taking liquidity with market orders at small size, zero fees probably benefit you. If you are posting limit orders and trying to capture spread, you may be giving up more than you realize.
Why This Matters for Trading
Fee structure influences which strategies are viable. Scalping works at 0.01% fees but bleeds money at 0.05%.
Longer-term directional trades are less sensitive to fees since you are not churning positions constantly.
If you are running any kind of arbitrage or high-frequency strategy, negotiating fee tiers or qualifying for VIP rates is not optional.
The difference between profitable and unprofitable often comes down to a few basis points.
Liquidity Considerations
Not all perpetual markets are created equal.
Bitcoin and Ethereum perpetuals on major exchanges have deep liquidity with tight spreads. You can move size without significant slippage.
Once you move to smaller altcoins, liquidity deteriorates rapidly.
Spreads widen, order book depth thins, and slippage becomes a real cost.
A 0.05% fee looks irrelevant when you are paying 0.5% in slippage to enter and exit.
This is especially pronounced in the newly listed TradFi perpetuals.
Gold, silver or equity perpetuals on decentralized exchanges often have thin books.
The product exists, but the liquidity to trade it efficiently might not.
The same applies to low-cap altcoin perpetuals.
The funding rate might look attractive, but if you cannot get in and out at reasonable prices, the funding income gets eaten by execution costs.
Before trading any perpetual market, check the order book depth and typical spreads.
Look at how much size you can execute at the quoted price versus how much you actually want to trade.
For newer markets, whether TradFi perpetuals or freshly listed altcoins, assume liquidity is worse than it looks.
The displayed order book often disappears the moment volatility picks up.
Market makers pull quotes, spreads blow out, and you are left trying to exit into a vacuum.
This is not a reason to avoid these markets entirely.
You should see these as features, not a bug.
Illiquid markets can offer better opportunities precisely because fewer participants are willing to deal with the friction.
Leaving resting orders for crazy wicks that only happen on illiquid perps, benefiting from elevated funding rates, and many other opportunities can be found by those willing to seek them.
But you need to size positions accordingly and factor execution costs into your expected returns.
Conclusion
Perpetual futures have become the dominant instrument in crypto derivatives and are now expanding into traditional asset classes.
Understanding their mechanics doesn’t give you the edge, but it is mandatory for anyone who want to take trading seriously.
The core concepts are not complicated: leveraged exposure without expiration, funding rates to anchor prices, and the interplay between underlying and derivatives markets.
What matters is applying these concepts. Watch how open interest builds and unwinds at key levels. Pay attention to liquidation cascades.
None of this is a magic formula.
Trading is hard, and most traders lose money regardless of what indicators they use.
But understanding the mechanics of the instruments you trade is the foundation everything else builds on.
With TradFi perpetuals expanding rapidly, these concepts will become relevant far beyond crypto.
The traders who understand perpetual futures today will have a head start as these products proliferate across asset classes.
This captures the nuance most people miss.
This is the real crossover: crypto rebuilt market structure, not just assets.
Perps reward understanding mechanics, funding, liquidity, forced flows, not narratives.
As TradFi adopts them, edge goes to those who respect the structure first.