

I started trading probably as everyone else, drawing lines on the chart and thinking everything can be found on YouTube and other social media. Luckily for me, I was able to stay relatively skeptical and pivoted very early into trading orderflow around 2018 (before it was cool).
I have traded European futures markets on Eurex before pivoting to crypto and traded very short-term strategies up until around 2022, when I decided that I probably don’t want to spend 14 hours a day glued to my monitor and started pivoting into systematic and longer-term trading.
These days while I trade crypto, equities, and futures, all strategies are almost fully systematic and held over weeks to months, which means I spend much less time watching charts. If you are interested in that, you can check out tradingriot.com, but without the early years of shorter-term speculation, which was often based much more on vibes than anything else, I would not be where I am today and have the experience I have.
I used to write a blog about day trading strategies back in the day and have some courses that were about the topic; these are no longer available since I have unfortunately become a “day trading customer support,” and I didn’t want to a) provide feedback on strategies I no longer trade and b) be a dick and ignore people.
This article takes everything I have shared over the years and puts it in one place. I will break down the key principles of discretionary trading and then share the exact price action and orderflow strategies I was using. While my trading changed a lot over the years, these are, in my opinion, evergreen concepts and apply to all styles of trading, and I use many of these principles to this day.
Fundamentals of discretionary trading
Discretionary trading describes a type of trading where you, a human being, take trades based on your discretion; this can come from technical analysis, fundamental analysis, tea leaves, or other esoteric ways like Elliot Waves.
While we might often think that we can predict the future using our unbelievable charting skills, the truth is that the outcome of each individual trade is a coin flip.
You can have an A+ setup at a perfect level with clean orderflow and it can go straight to the dumpster the minute you enter. And the trade you hesitated on, half-sized, almost skipped, runs to target without looking back.
This is what makes discretionary trading very hard. Looking at systematic trading for a second, in strategies like trend-following or harvesting variance risk premium, all trades follow the same rules and patterns, which can especially these days be effortlessly tested and looked at to see how they performed in the past, so all trades from signal, sizing, entry, and exit are fully automated.
In discretionary trading you need to create these rules yourself, and what is often the case, multiple-timeframe analysis, orderflow patterns, and price action patterns can be backtested easily.
This does not make discretionary trading impossible; I don’t think I would be able to make the returns I made in early years if I were trading a fully systematic way. Of course, these were made by a sequence of large oversized bets, which had the same chance of ruin to success, but especially if you are trading with smaller capital, this sort of risk-taking needs to be done. Nowadays I just don’t need to do it, as my capital grew, and I am happy to accept lower returns with lower volatility.
Discretionary traders can also adapt much faster than systems to any regime shift and can get much more profound understanding of individual markets, mechanics, and patterns driving them; this obviously comes with ungodly amount of screen time and dedication.
Once you spend enough time trading, journaling, and monitoring your setups, you will be able to create a rulebook and much better refine trades you take so they will almost look like an automated system is taking them. Once that is done, you will be able to put on much more confidence and scale your trading.
R-multiple
Once you trade with defined risk, you stop thinking in dollars and start thinking in R.
R is one unit of risk. If you have a $10,000 account and risk 1% per trade, 1R is $100. If you take a long on Bitcoin at $82,250 with a stop at $80,250 and a target at $86,250, you are risking $2,000 per coin to make $4,000. That is a 2R trade.
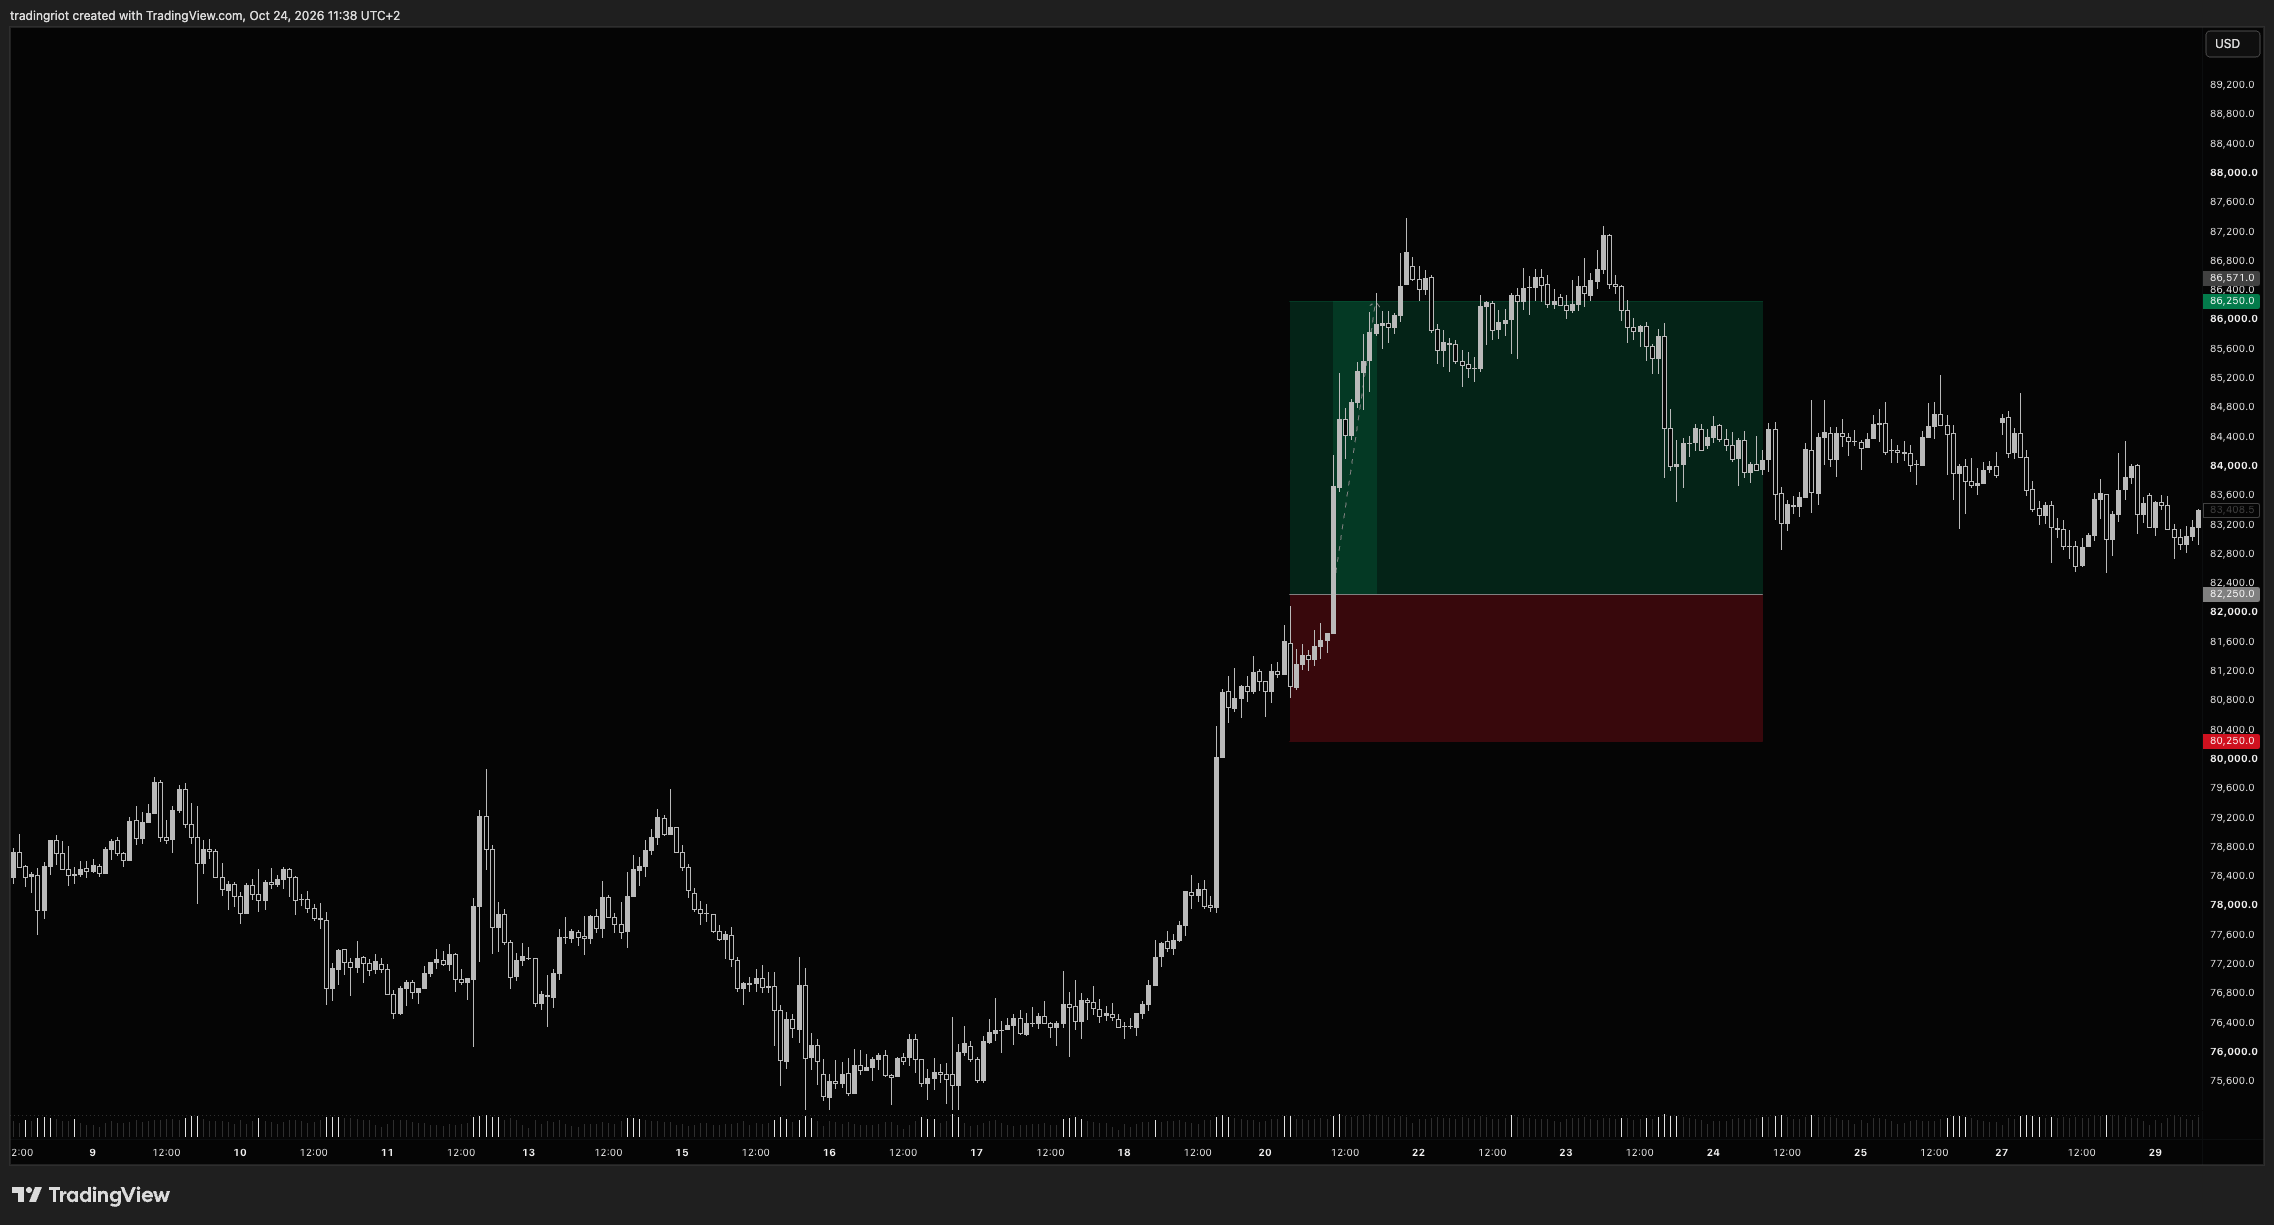
Thinking in R multiples is useful, as it makes trades comparable; if you trade more markets,markets a 5-point stop in ES and a $2,000 stop in Bitcoin become the same thing if both are 1R.
R multiples also take money out of your mind. When I used to daytrade, I knew there were plenty of traders who taped their account balance and P&L on their screen so they wouldn’t see the money value of them. I also used to have all my profit and loss settings on Sierra Chart in tick values instead of dollars.
Expected value
Expected value (EV) is the average result per trade over many trades. In R terms:
EV = (win rate × average win) - (loss rate × average loss)
With losses fixed at 1R:
50% win rate, 2R winners: 0.5 × 2 - 0.5 × 1 = +0.50R per trade
40% win rate, 2.7R winners: 0.4 × 2.7 - 0.6 × 1 = +0.48R per trade
20% win rate, 2.7R winners: 0.2 × 2.7 - 0.8 × 1 = -0.26R per trade
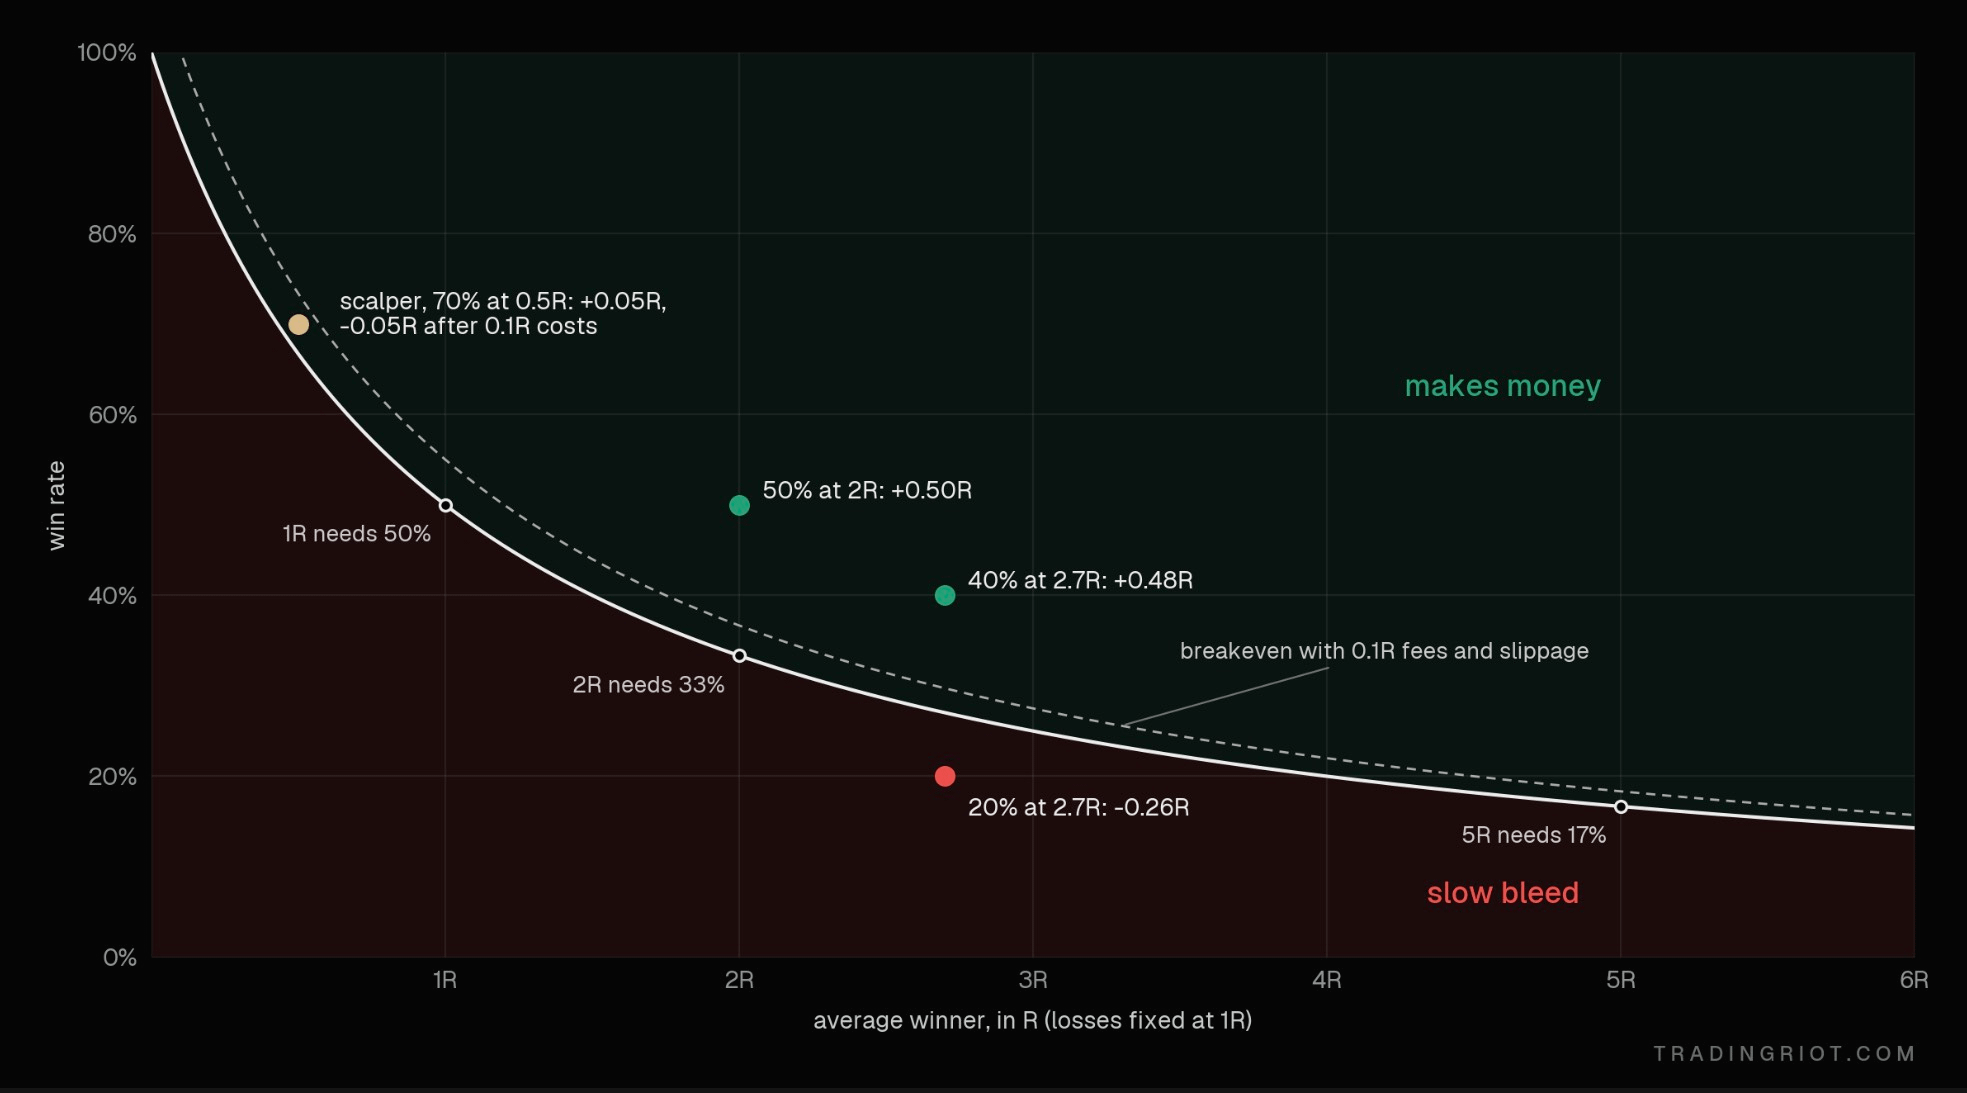
The first two strategies look different and make almost the same money. The third one looks fine on paper until you do the math.
This is why arguing about win rate alone is pointless. The win rate you need depends on what you make when you win. The breakeven win rate is 1 / (1 + R).
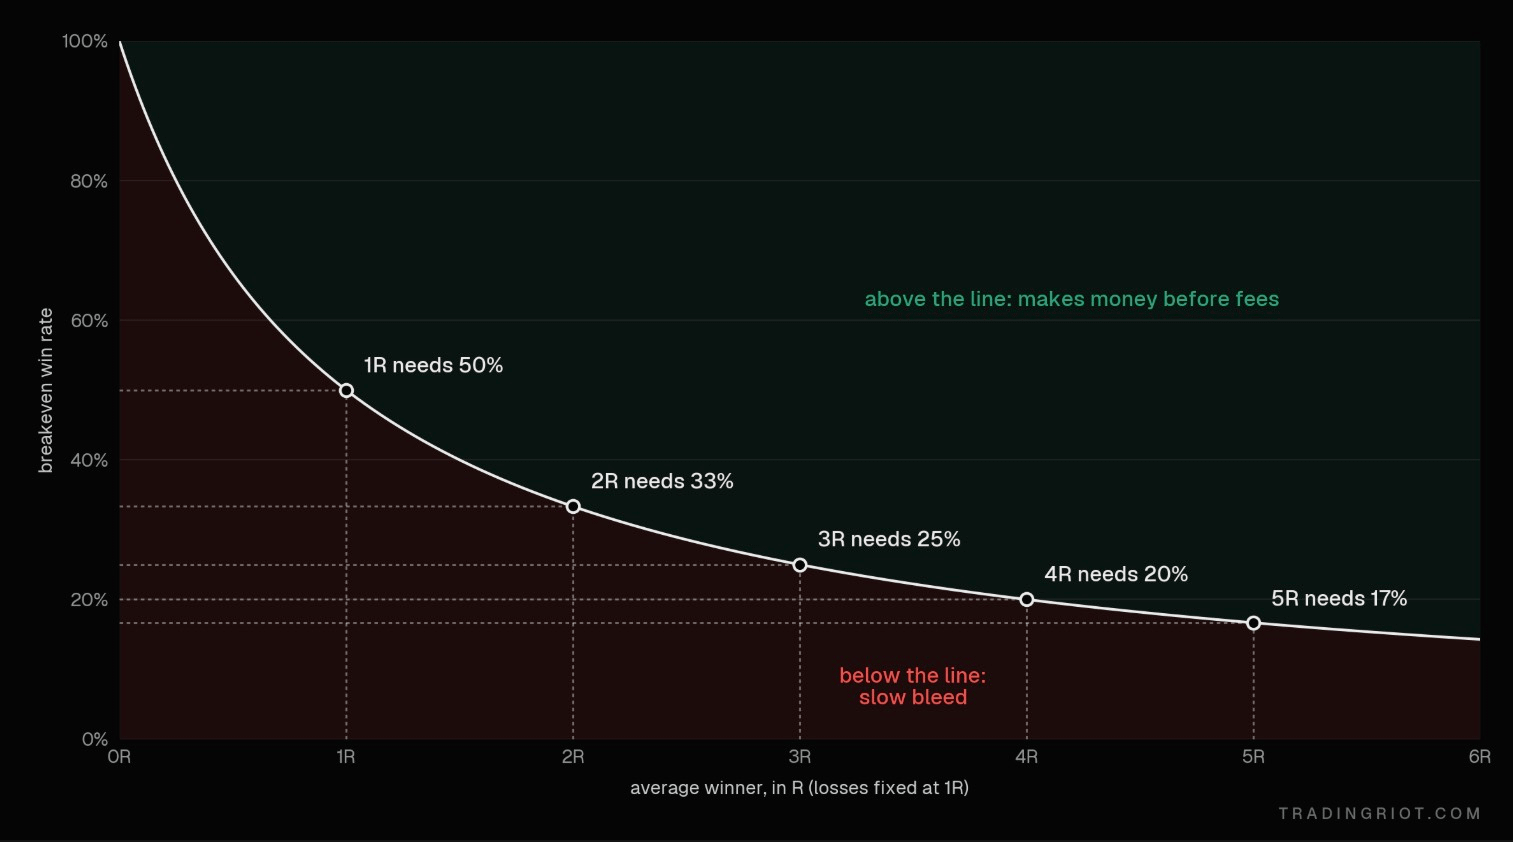
The chat above shows the breakeven required for each R multiple; in the real world this obviously won’t be so straightforward unless you take fixed R:R setups every single time.
Fees also matter a lot; if you scalp a whole day and pay 0.1R in fees on a round trip, for example, it can eat your profits quickly.
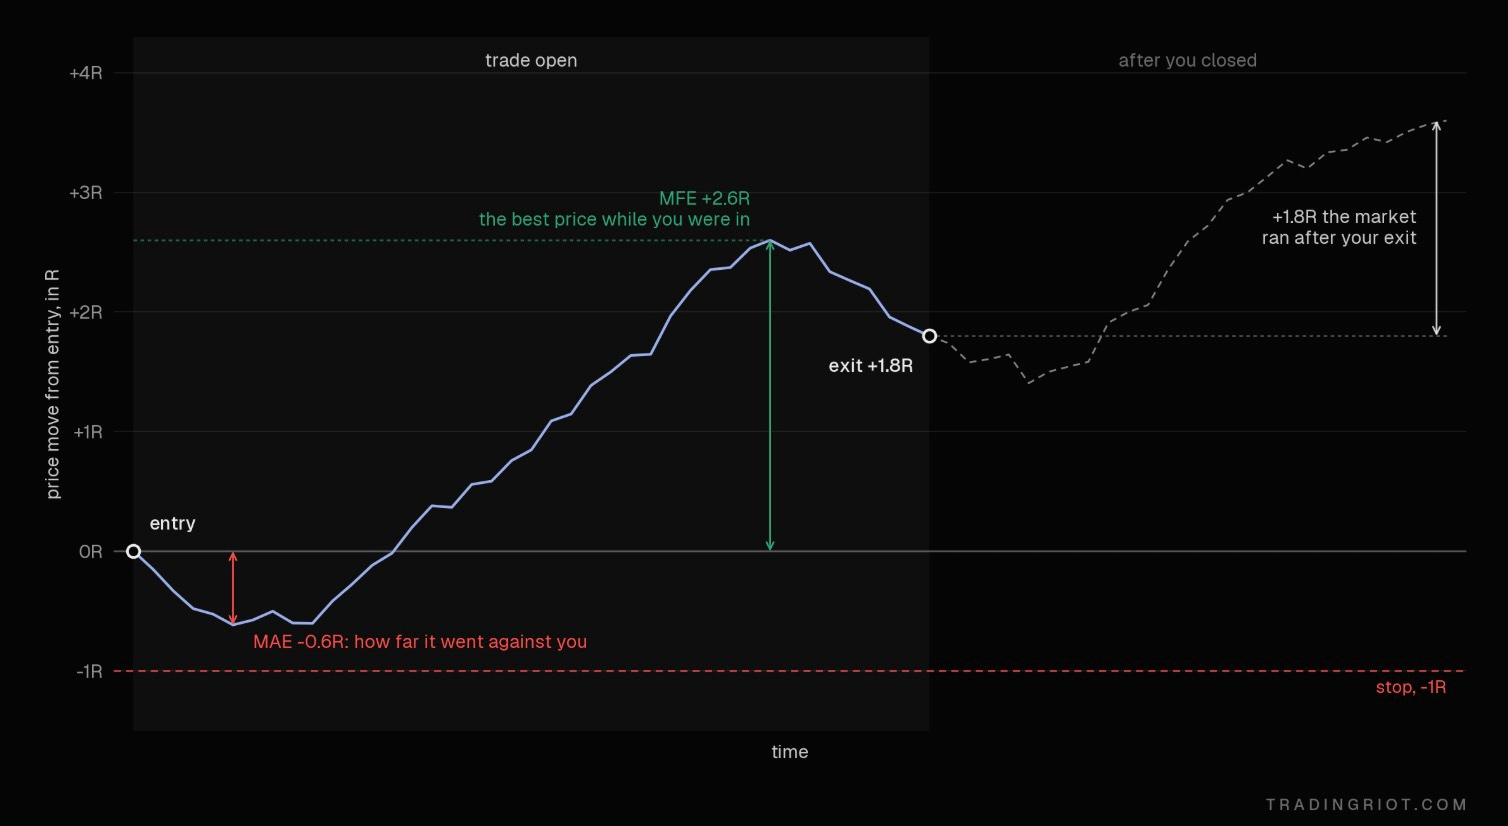
When optimizing and measuring R, you should also consider what the market did after you closed the trade; this is called maximum favorable excursion (MFE). On the opposite side, measuring how much the market went against you is also good, as it can tell you if your stops are too wide or narrow; this is called maximum adverse excursion (MAE).
Sample size
Now that you know how EV works, you should be able to answer this question: if we flip a coin two times in a row and heads is on both flips, I will pay you $3,000; if not, you will pay me $1,000.
Is this a good bet? To find that out, we should figure out what is a chance for this to happen.
If I flip a coin twice, the possible outcomes are following:
HH - HT - TT - TH; therefore, there is a 1/4 chance, or 25%, for both flips to be a head.
Since your win rate is 25%, the EV is following:
EV = (0.25 × 3,000) - (0.75 × 1,000) = 750 - 750 = 0
So is this a good bet? Well, not really; it’s a zero EV bet.
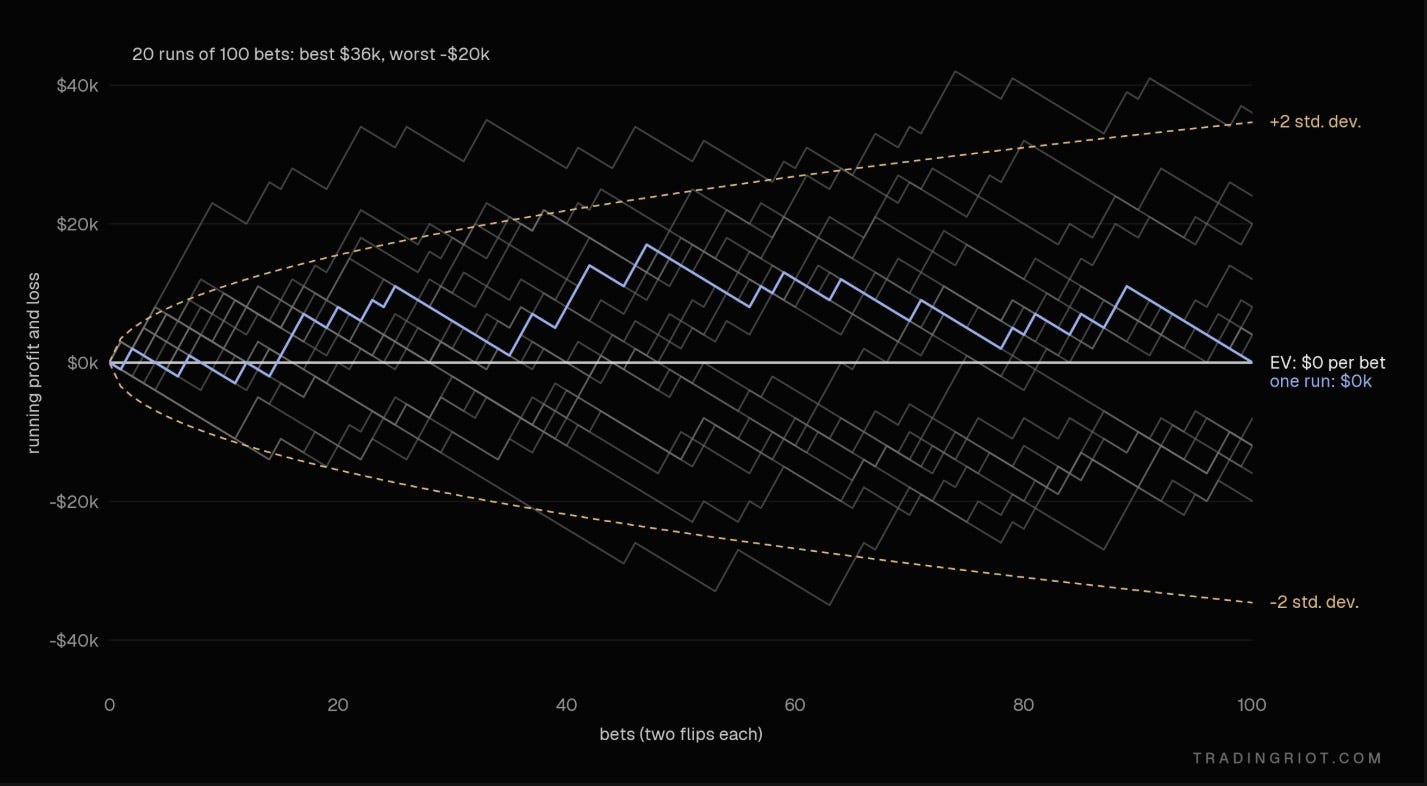
Over the 100 bets (one bet is two flips each) using the same payoff scenario, we can end up anywhere between up $36,000 or down $20,000 purely based on variance.
Now let’s change this to $3,500 paid against $1,000 lost.
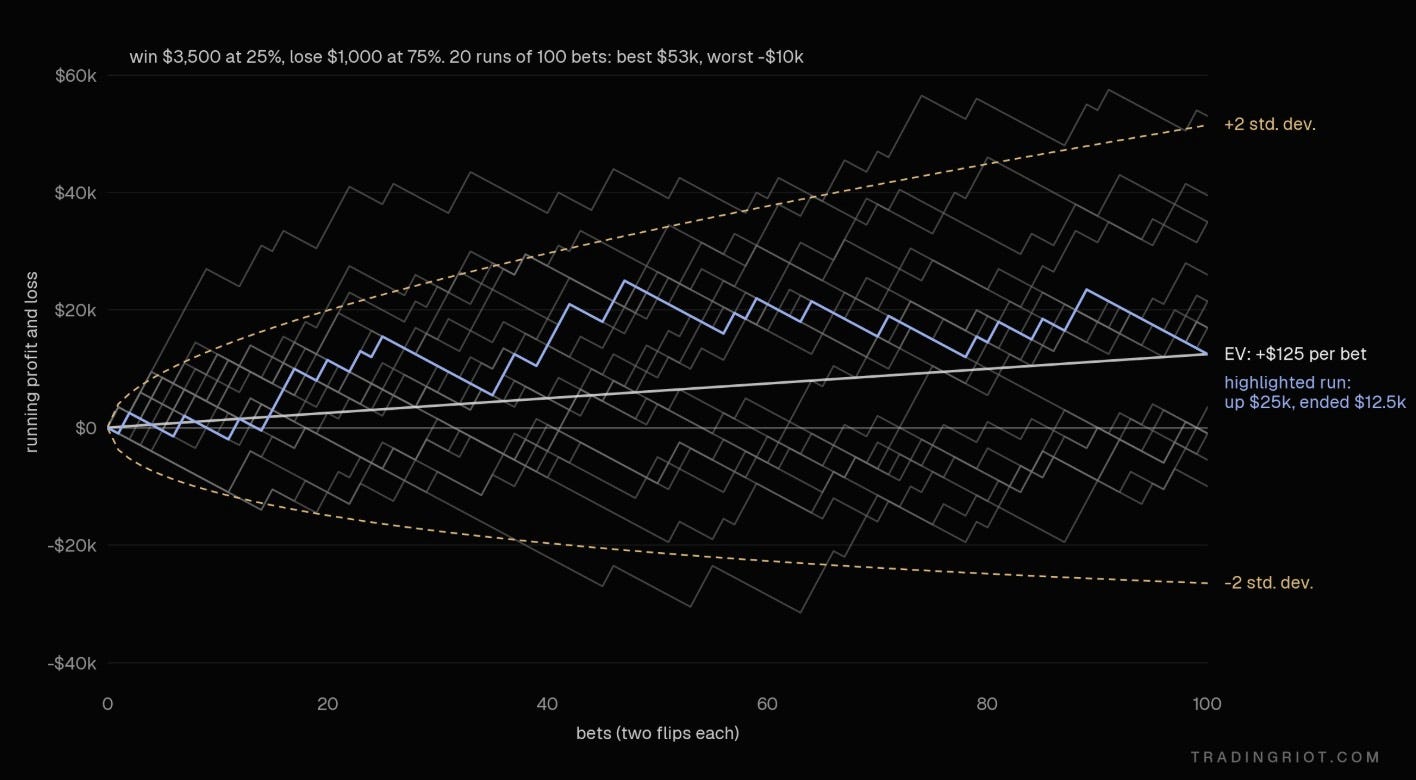
With a positive EV of $125, you can notice that while several paths still end up in loss, the distribution is much skewed to the upside. Play the same game 1000 times, and only one path ends up in a loss.
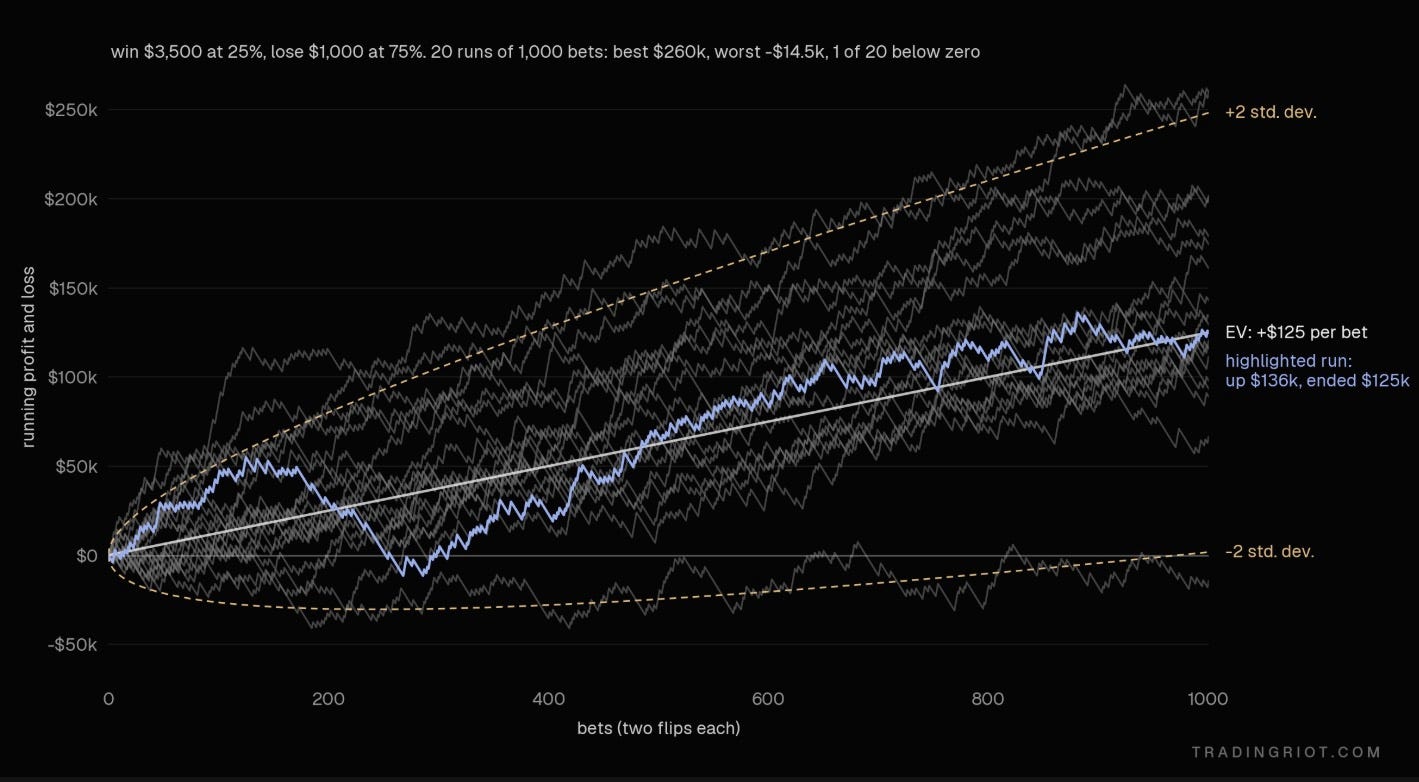
Trading works the same way. Your results over a short stretch are noise. You will have down days, down weeks, and sometimes months, or quarters, or even years with a perfectly good strategy.
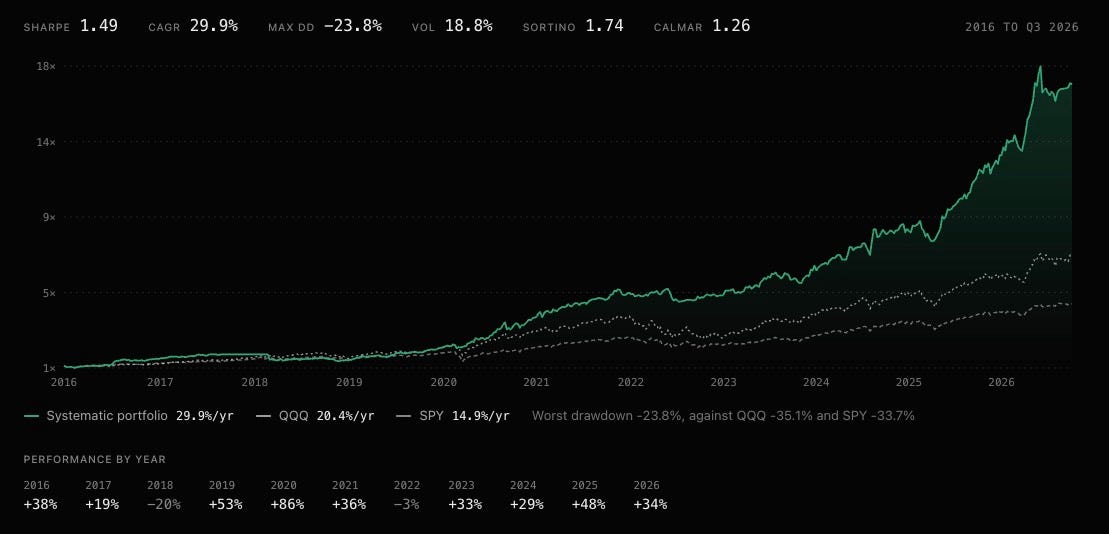
The systematic portfolio, which you can copy on tradingriot.com, had two losing years in the last decade; that’s not fun, but completely normal to happen.
Money in trading isn't made in one trade or one week. It's made by repeating something with positive EV enough times for the math to show up. This is why using EV is hard in discretionary trading.
In poker, a hand is a hand. Pocket Aces are pocket Aces every single time. The math behind them is known, and players track results over tens of thousands of hands. Within a few months of serious play, you have a big enough sample to know your win rate.
Discretionary trading has none of that. No two setups are the same, but many trades will follow a very similar pattern, and you will need a lot of them to see whether they are profitable or not.
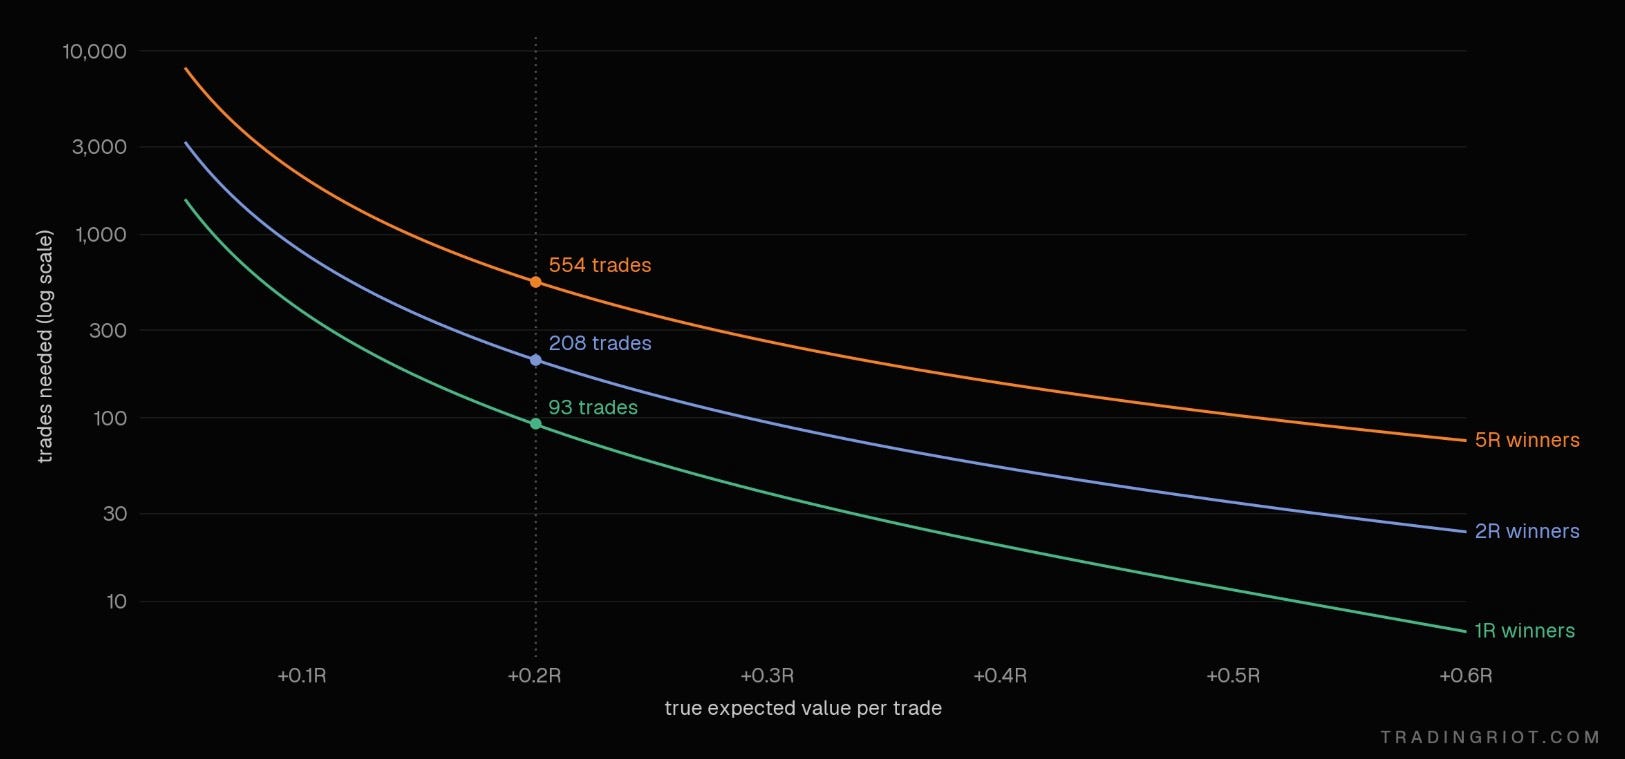
With losers fixed at 1R, here’s roughly how many trades it takes before a real edge stands out from luck at roughly 95% confidence1.
Now translate that into time. At about 200 trades:
Scalping, 10 trades a day: about a month.
Day trading, 2 trades a day: about five months.
Swing trading, 2 trades a week: about two years.
Position trading, 2 trades a month: about eight years
That is for one setup; if you trade four different setups and lump them together in your journal, you don’t know which ones work. One great setup can hide two bad ones.
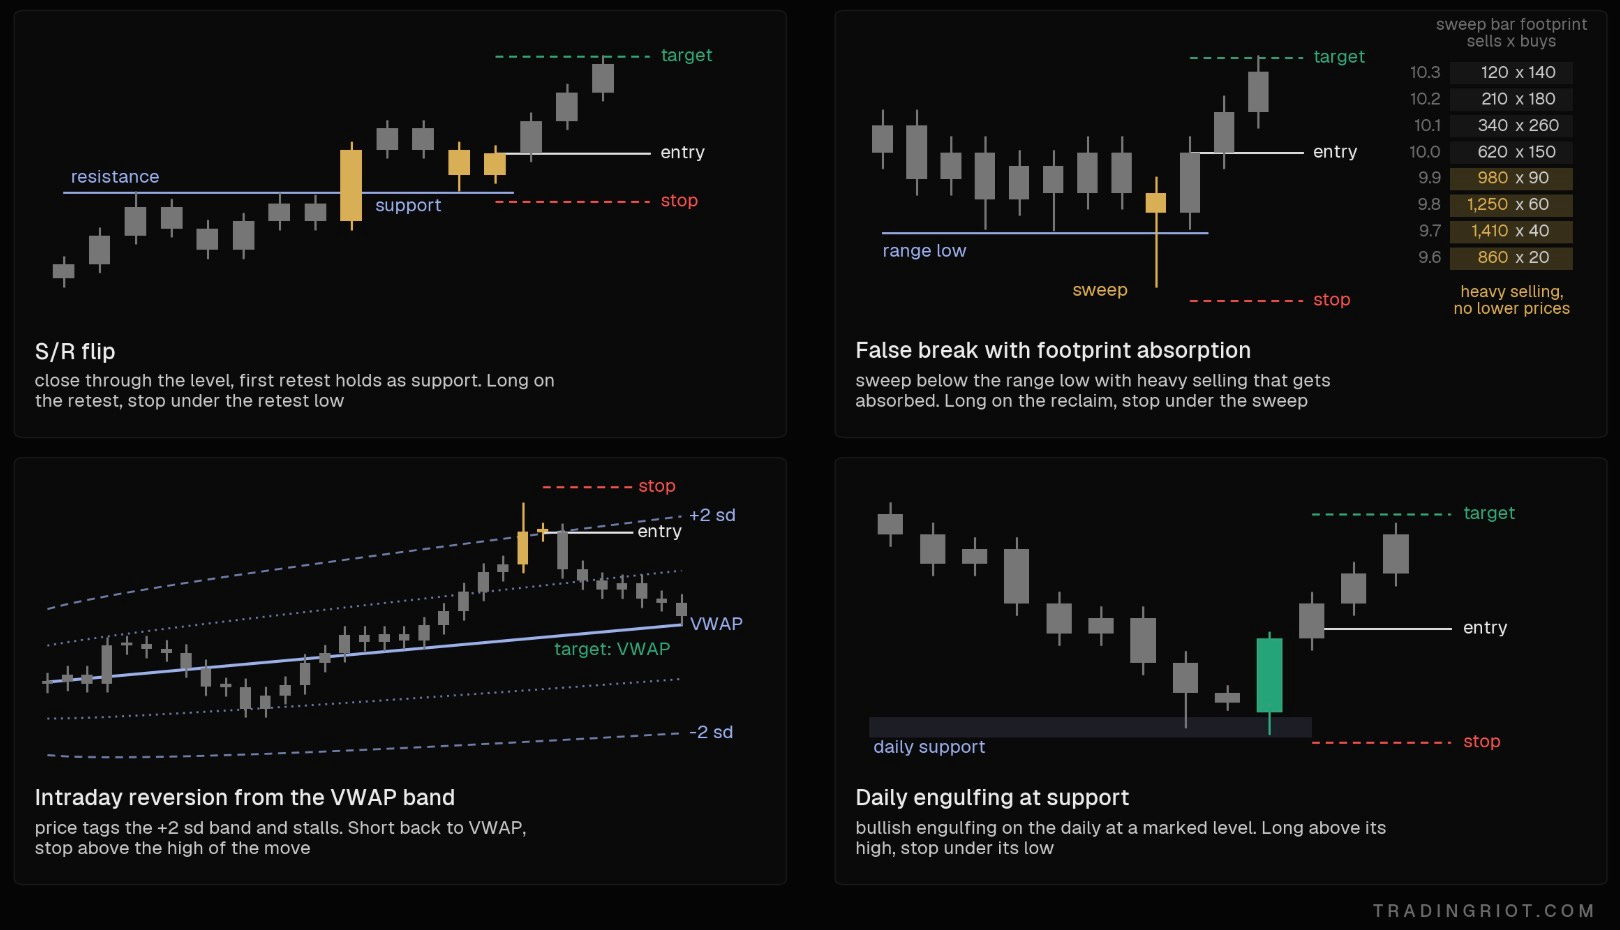
Setups can have many looks and forms; I will share some of them later in this article, but this is the hardest part of discretionary trading. Not reading charts but building setups that are defined tightly enough that you can count them and then taking enough of them to see your expected value.
While I am not the biggest fan of trading on demo accounts or using backtesting software to run a chart replay, if you are planning to trade on higher timeframes, this is definitely something worth exploring to shorten the path to confidence.
Should you day or swing trade?
If you trade on lower timeframes, you get a much quicker feedback loop. Scalpers and day traders take hundreds of trades a year. They can find out whether a setup works in weeks or months, change it, and test again. Their edge mostly comes from microstructure and positioning: trapped traders, stop runs, and absorption at levels.
If I am going to ask you what you will be doing in the next hour or in the next two days, you have a pretty decent idea about that. If I ask you what your plans are three months from now, that will be much harder to answer.
Trading is similar in a way, especially if you plan to use technicals solely for your trading; then this will be true: price jumping back from support because of mechanical flows and liquidations will be true on intraday moves, but you can’t really say that the market trended for a span of four months only because it hit some bigger support level and bounced.
Swing trading is much more complex; moves happen because of fundamentals, regime changes, or major positioning flows hitting multi-year extremes.
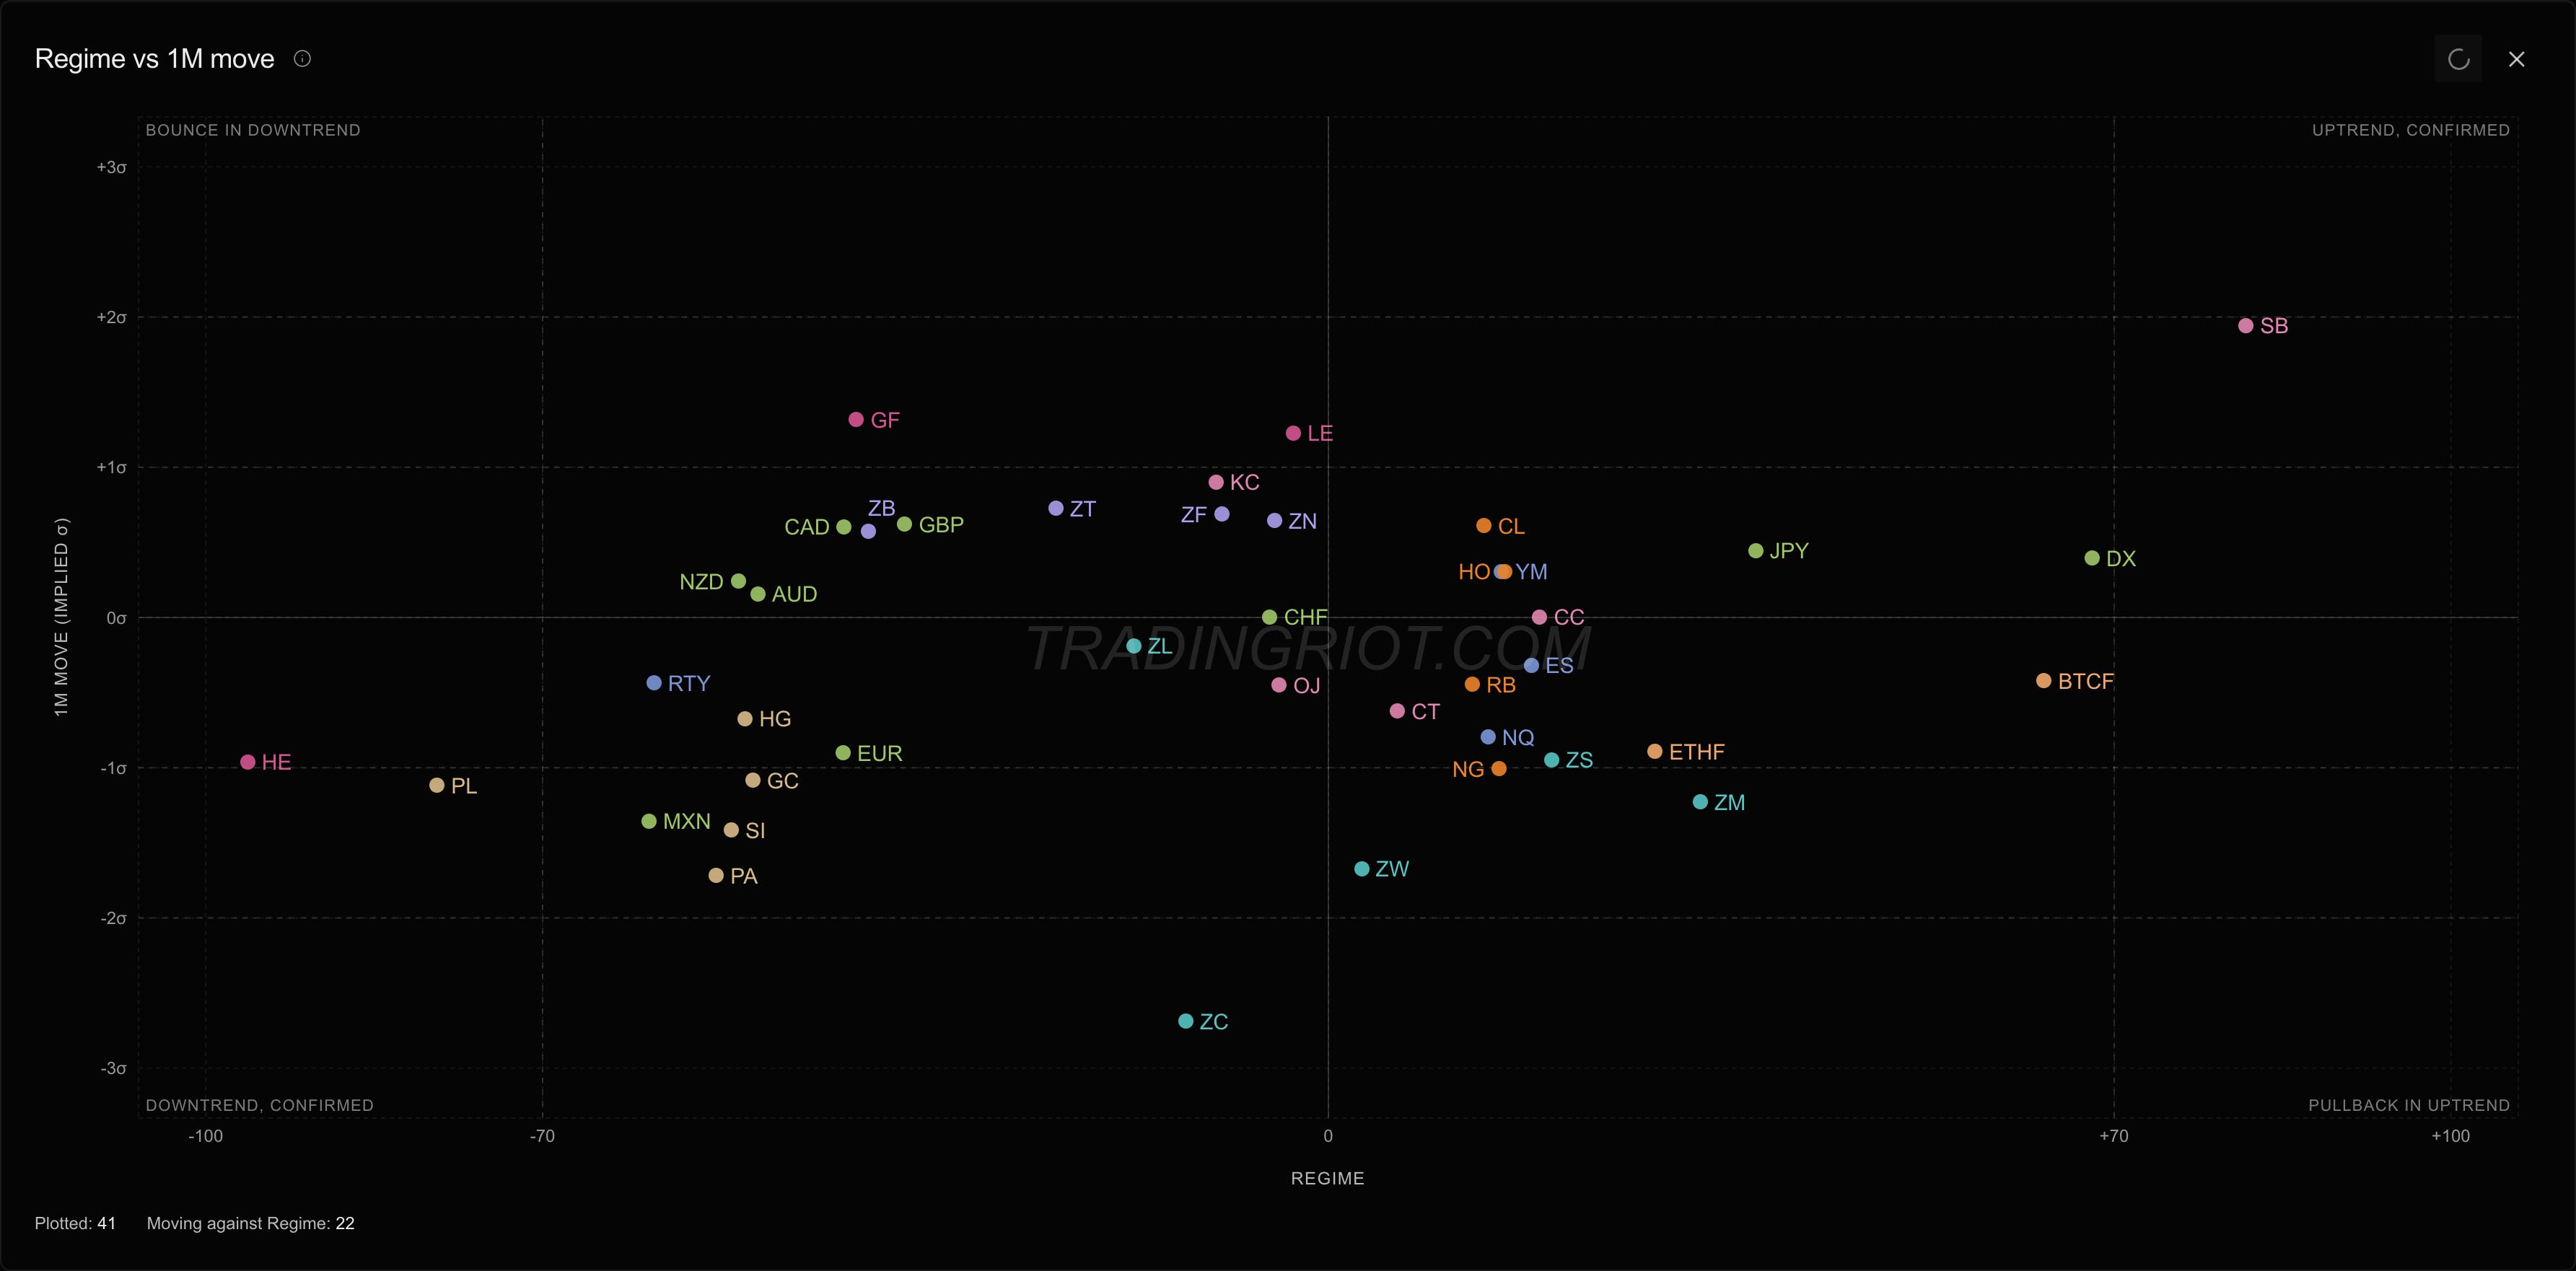
One of the strategies that I trade trades like this in CME and ICE futures markets is that it’s very slow, only finding a handful of trades each month across almost 50 markets.
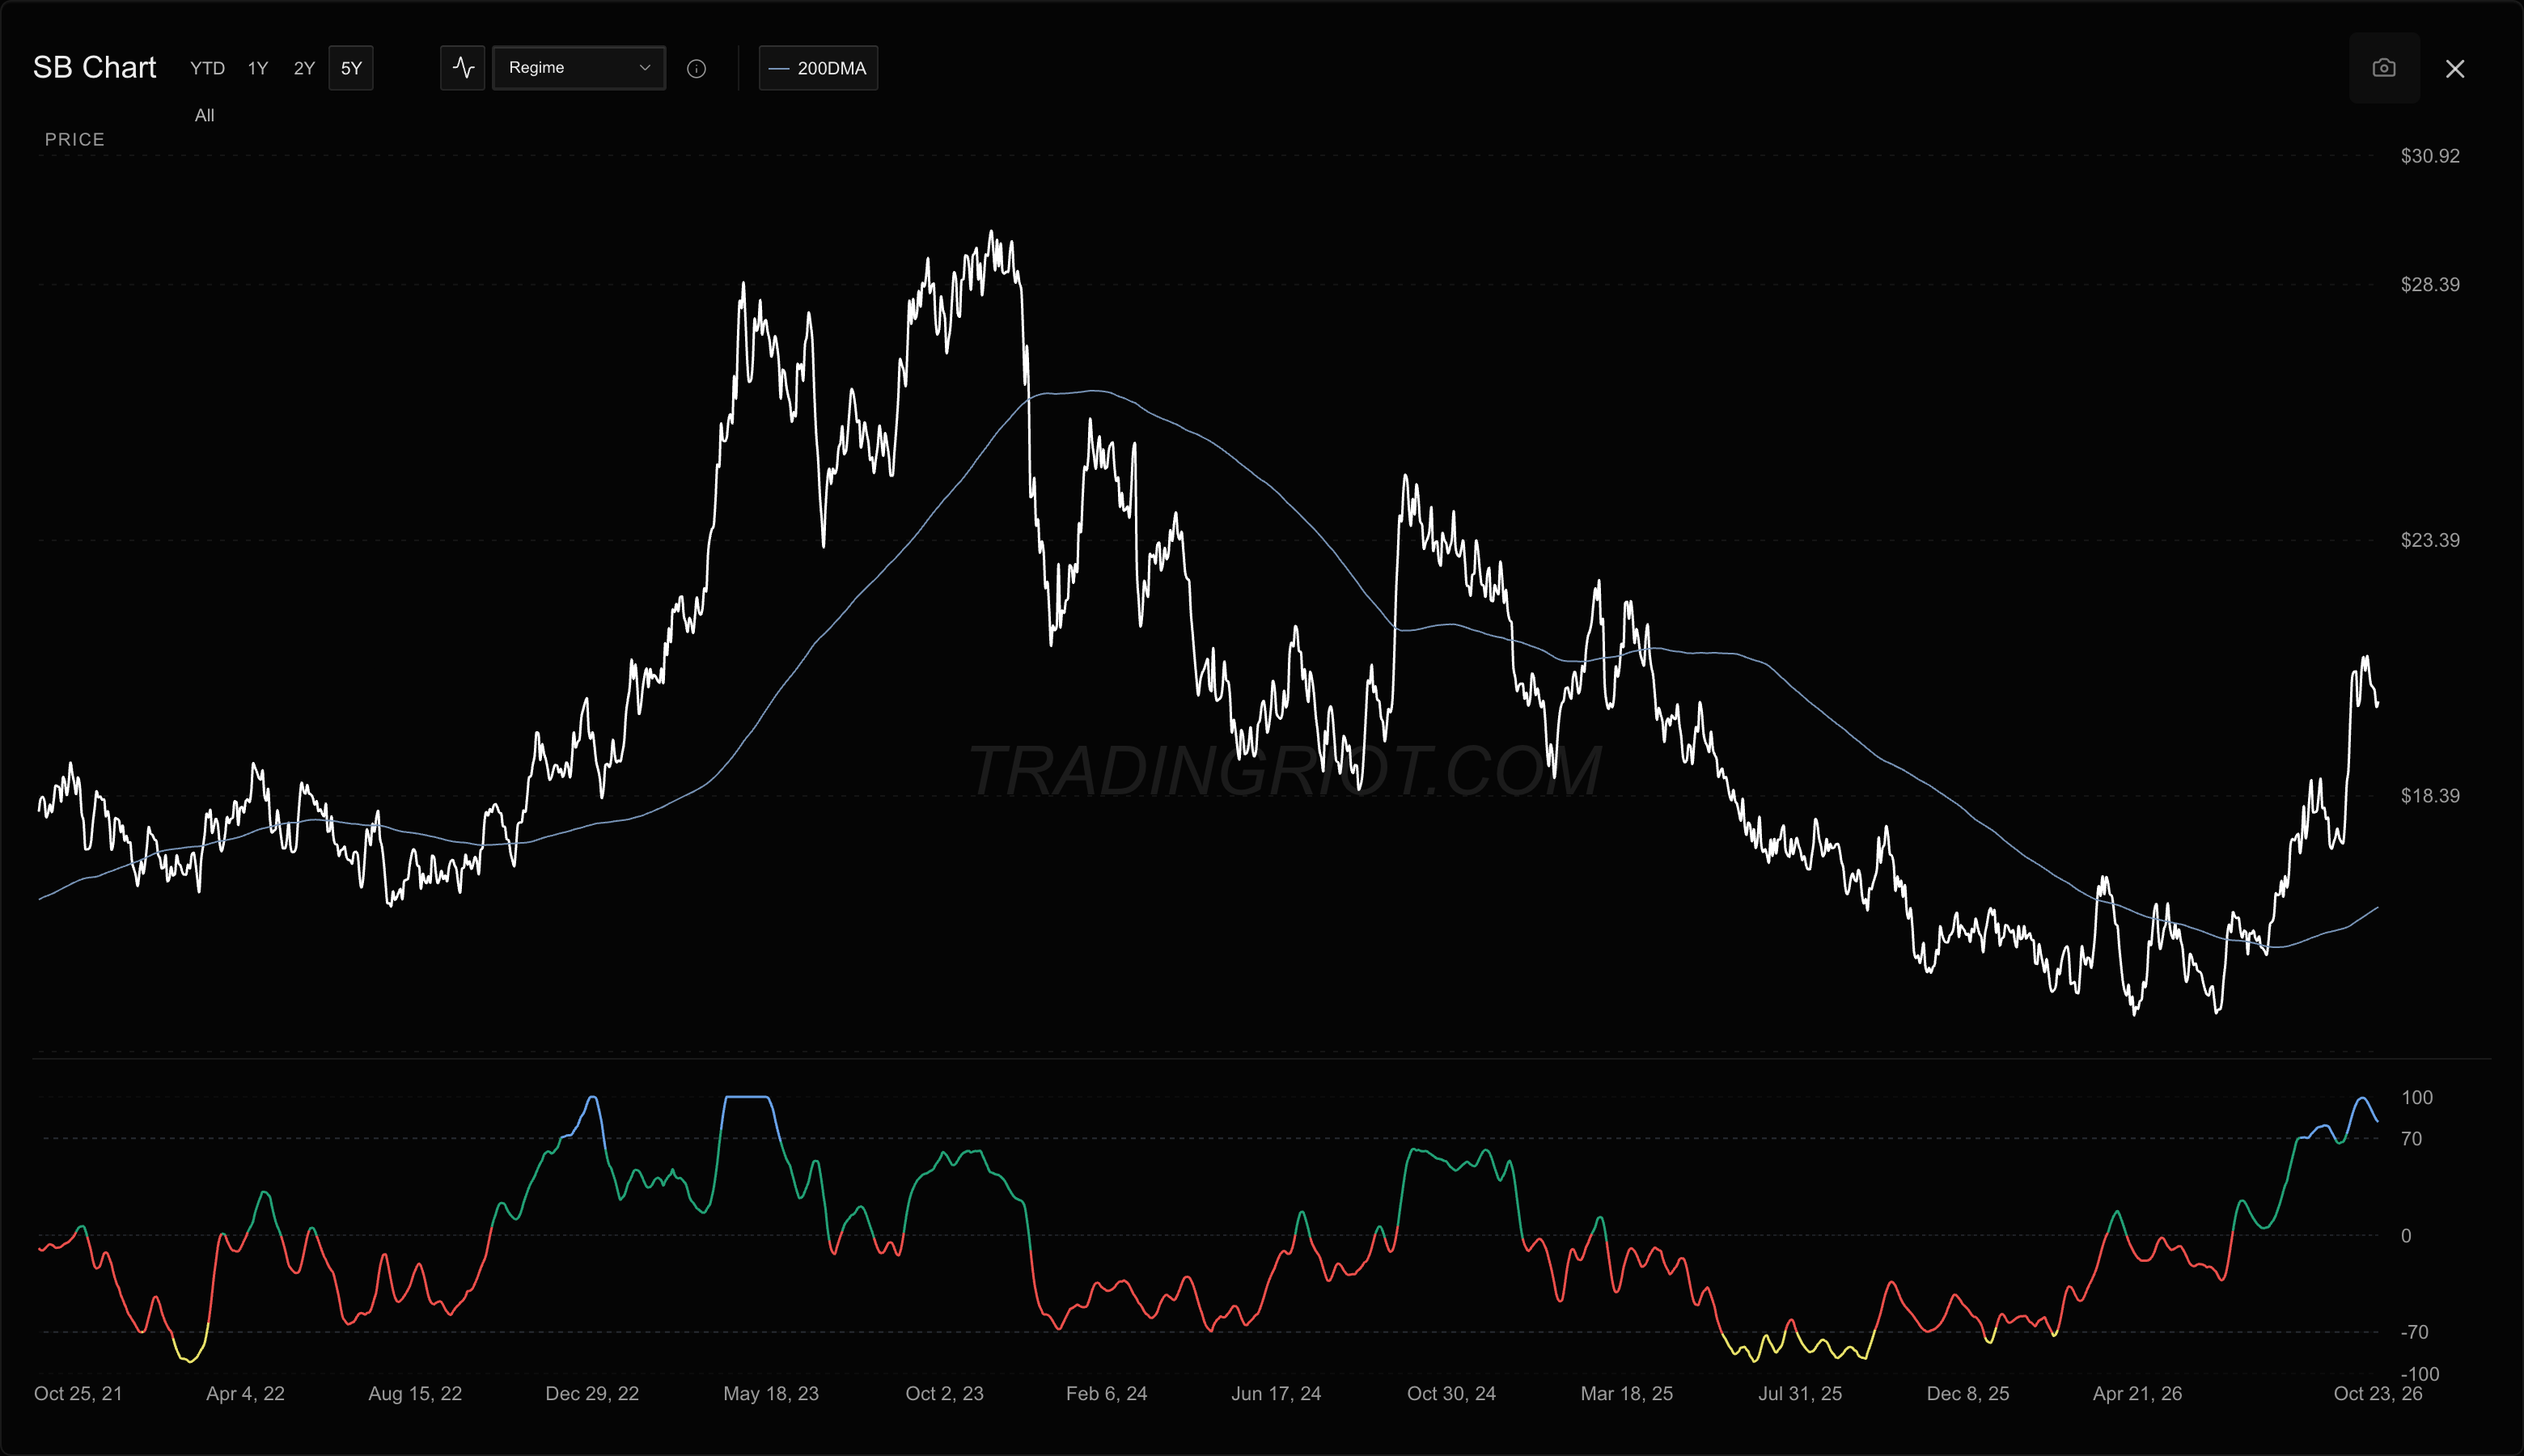
While I find trades systematically, a lot of discretion comes into execution, and I still look for “setups” that combine price action and orderflow elements for me to help decide if I want to trade with or against trends, which then constructs positions using a mix of futures and options.
Since this is a strategy with very low frequency of trading (it does not use lower than daily timeframes), there is much more uncertainty evolving around it, it would probably take me a good year to realize the strategy might have fully stopped working, and I am very used to months of almost no returns compensated by occasional considerable winners (since I do not use fixed take profit levels).
I am fine with this, as I have spent the necessary time to build confidence in the system, and this is only one of many strategies I trade, as it does not require more than about 30-60 minutes per day to go through all markets and positions using tradingriot.com tools and screeners.
For starting out, shorter timeframe trading is, in my opinion, better; you will get much faster feedback from the market on things you are doing. Similar to poker, you want to be grinding small cash games first to build a track record and have data to analyze before moving into tournaments, which are known for long dry drags before a large single win.
Losing streaks
The pattern for countless people is that they learn a strategy, trade it for a week, get bad results, try to look for something else.
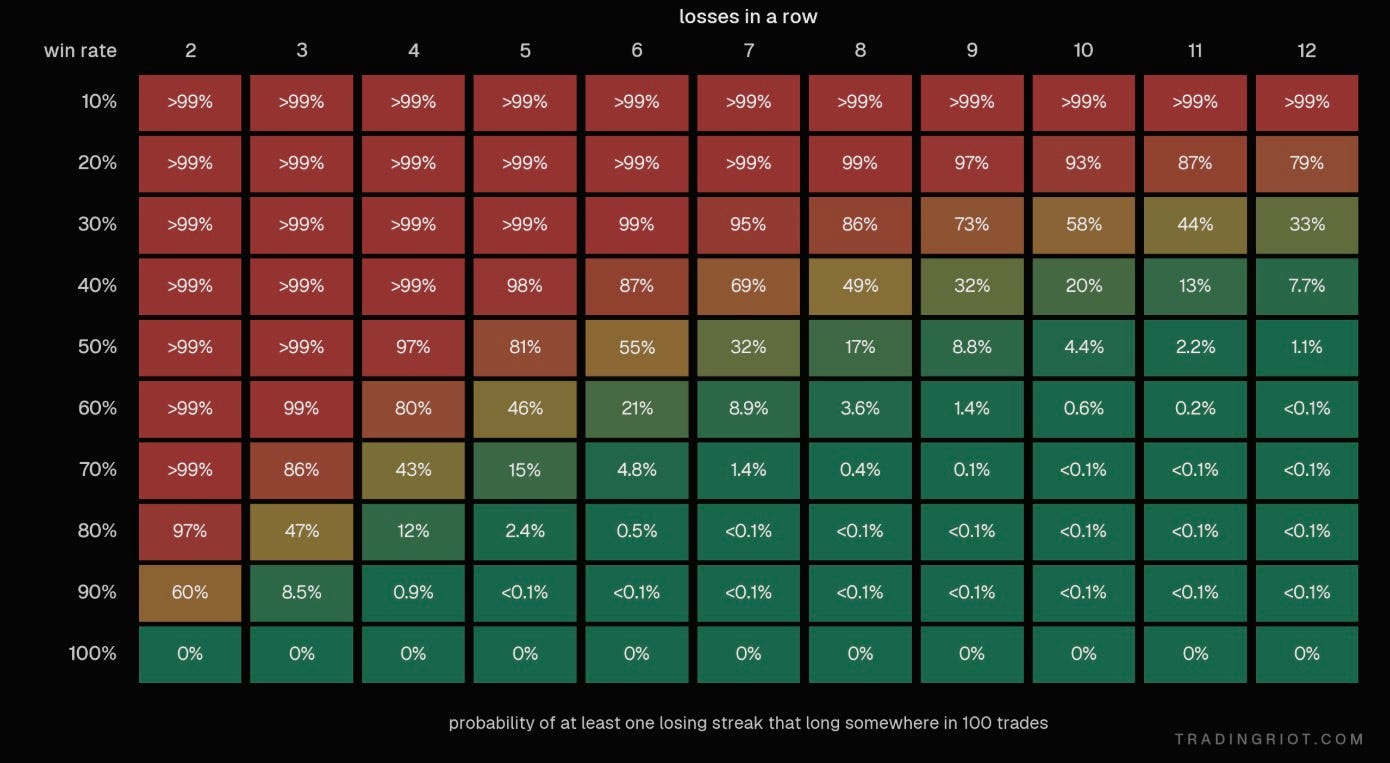
As you can see above with the 50% win rate, there is an over 80% chance you will see five losses in a row; if your trading frequency is not that high, this can feel like eternity.
For discretionary traders who focus on convex payoff curves (you win more than you lose), the win rates are often in the 30-50% range over the long run, so you better get used to some prolonged losing streak periods.
Risk per trade
Since you probably have no idea what your EV is yet or don’t have any other data collected about the strategy you trade, the conventional wisdom generally says not to risk more than 1-2% of your account per trade.
This is decent advice, but slightly too simplified.
The right amount for risk per trade is not only going to depend on your win rate, but also how much you trade.
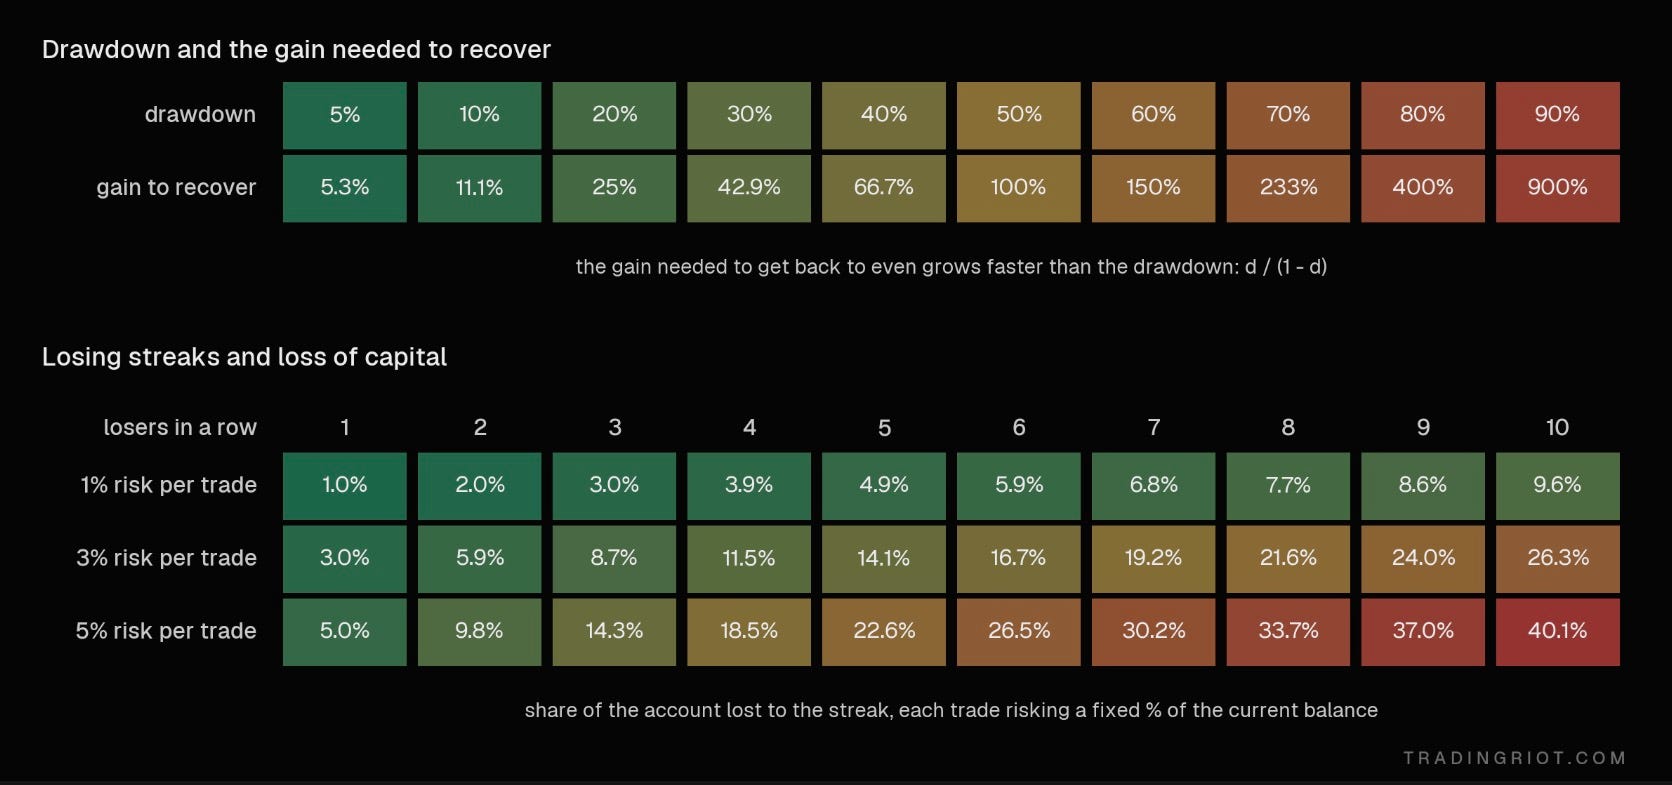
Foremost, if you risk too much and hit a string of losses, it will suck a lot because, as you can see on the chart above, if you start trading with $100,000 and you lose 50%, or $50,000, to make it back to breakeven, you actually need to make 100% now.
As established already, you are playing a law of large numbers; you want your edge to play over a large sample size of trades. If you take 10 trades every day, there is no point to risk 1% on each trade, as you would rather not see your account fluctuate daily.
But what if you take 10 trades per month? If that is the case, risking 1% doesn’t sound that unreasonable considering you can stomach a 10% monthly drawdown.
If you have $100,000 and take three trades a month at 1% risk, a great year might be 20R. That's $20,000 and twelve months of sitting on your hands. If your data supports it, risking more on fewer trades is a rational choice. If you take 60 trades a week, risking 3% each will very likely lead to a blowup.
The key phrase here is if your data supports it. You don't get to pick 5% because you feel confident. You pick it because your data supports it; if you are truly new to this, start as conservative as possible. The goal here is to build the track record and data; the sizing and growth will naturally.
How much money you need to start trading?
Brokers made it easy for everyone to start trading. Most people think they need $100 and dream of making it big in trading space. People also tend to think they will return 50% every month trading; this unfortunately gets amplified by all paid trading groups that advertise 50R monthly returns for the cheap price of $99 per month.
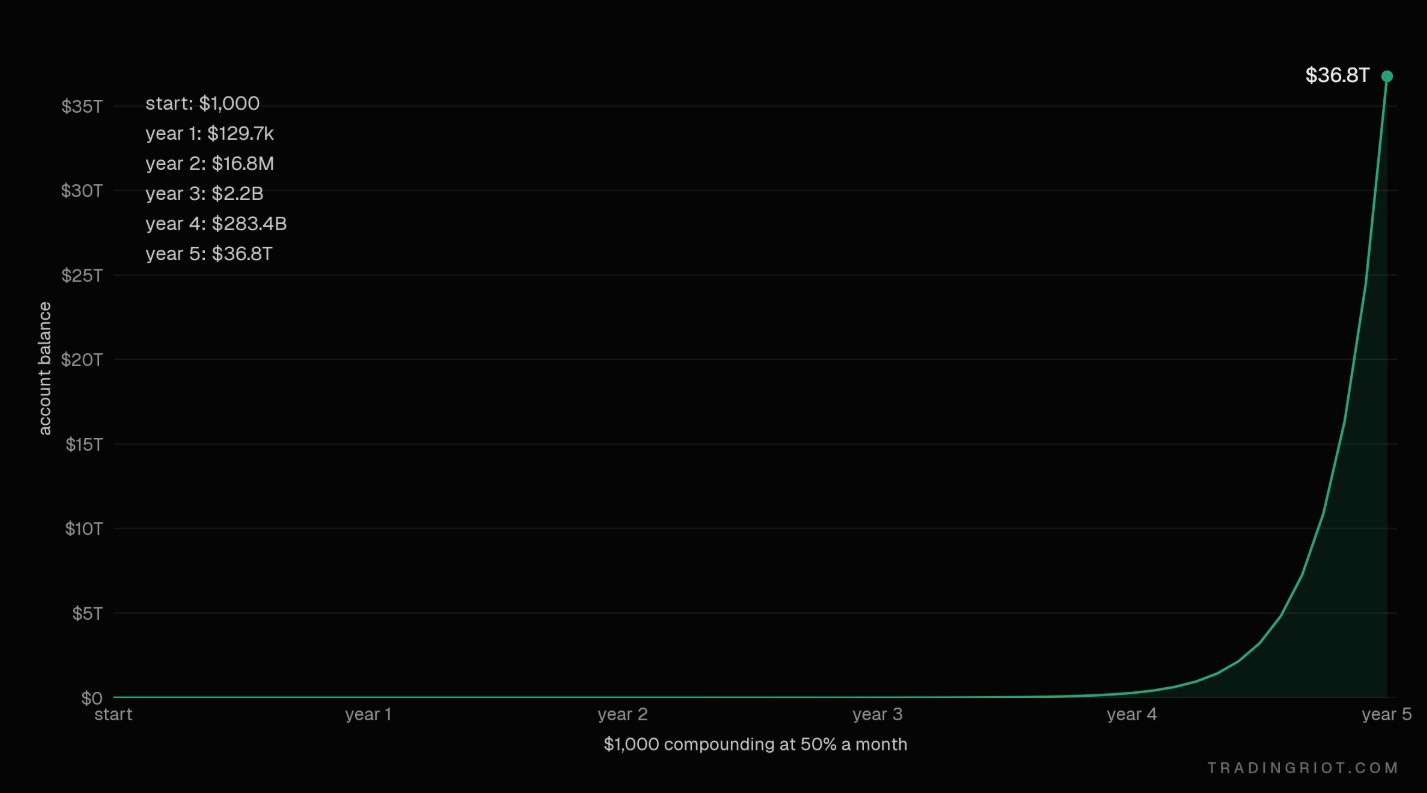
Just so we are on the same page here, if you start with $1,000 and make 50% each month, you are the richest person in the world by year four, and by year five you have more money than than the whole US economy’s annual output.
The last time someone asked me how much money they need to go trading full time, I told them that I think $500,000 is reasonable and they shouldn’t expect to pull out much of that, at least for the first few years, so they better have some saving. They were not thrilled about the answer.
If you plan to focus on more active trading, $100,000 is doable but very tough, but if you trade a lot and risk 0.5% per trade, that’s $500; if you make 10% a month (which is an excellent month), that will be $10k. If that is your only income and, god forbid, you have family to support, that’s tough to sustain psychologically, as your account won’t grow much since you are constantly pulling money out and need to consider other fun stuff like taxes.
Of course there are many factors that influence this, and I can’t speak on this since everyone is in a different situation. Making $10,000 a month is extremely diverse in Warsaw compared to New York, the same as if you were 18 living with your parents or 35 with two kids.
So have I started with $100 or $500k? Of course not; I started with very low five figures in my account, but the idea of going full-time for the first few years did not even cross my mind.
Therefore, if you are in a position where you can support yourself by doing other work, you don’t need much money to trade with. Moreover, as you will soon find out, not depending fully on trading income is much easier, and you can build your account and track record gradually.
These days, you don’t even need to have your money, as concepts of prop trading firms got very popular. I am part of Breakout, where I work on a lot of trading and risk-related stuff, so this is the only prop firm you will see me ever recommend, but even with these you should 100% know what you are doing before even thinking of attempting to get funding; there is really no point to just buying evaluations without knowing what you are doing. You will also often have to adjust your strategy based on prop-firm rules, maybe becoming slightly less conservative in your risk to meet the loss rules, but if you manage to do that you can access a large outside capital which is well worth it.
So, start small if you can; think about the journey rather than buying a Rolex next week, and don’t resign from your job after finishing this article because you think you know stuff.
Put enough money into your trading account where wins and losses make you feel something. If there is $100,000 in your bank account, putting $90,000 into your trading account is insane since every trade is basically a make or break for you, but putting something like $10,000 and risking $100 per trade might be enough to care and not do stupid things but also not want to end your existence after a small losing streak.
Sitting at the right table
Poker players have a saying: if you can’t spot the sucker at the table in the first half hour, you’re the sucker.
Good players obsess over table selection. The best player at a table full of professionals can easily lose money. An average player at a table full of tourists makes money all night. Where you sit matters as much as how well you play.
Most discretionary traders gravitate to the same few markets: ES and NQ futures and BTC perps. It makes sense on the surface. They’re liquid, they move, spreads are tight, and everyone on your timeline is talking about them.
But that’s precisely the problem. These are the most competitive markets in the world. You’re competing with someone at an HFT firm who probably graduated college at the age of 16, market makers with co-located servers, prop desks with decades of data and teams of quants, and every other discretionary trader. Every obvious edge there gets found and arbitraged away fast. You’re very likely the tourist at the high-stakes table.
When I was day-trading, I used to scalp a few ticks during European morning hours in Euro-stoxx and Bund which worked decently well when these markets were much thicker and slower than they are now. Then I moved to Bitcoin, which back in 2019 was much more inefficient with only two or three venues where you could trade perpetuals, so flows were not scattered across so many places, and that also went quite well as I could easily spot dumb flows getting trapped. Then I had a short period of time when I figured out I will be day-trading ES futures; it was extremely hard and awful.
It is up to you what you will decide to trade; I am not saying it’s impossible to trade ES or NQ futures, but in my opinion you will be playing on a hard difficulty while there is not much of a reason to do so.
Stop Losses and Take Profits
Before we get into the meat of the article covering different trading concepts, we should talk a little bit about stops and take profits.
Firstly, if you haven’t already, you should read the market microstructure article; this is basically a primer to trading, which will make the buying and selling things much less of a headache, as you will understand the underlying machinery.
You should always use a stop-loss, at least when you are starting out.
Stop loss is usually placed based on either technical levels (“If price is below xyz and I am out”) or based on volatility of the underlying asset.
The volatility-based stop is what I tend to use, and it is also slightly more complicated; there are two ways to measure volatility-based stop-loss.
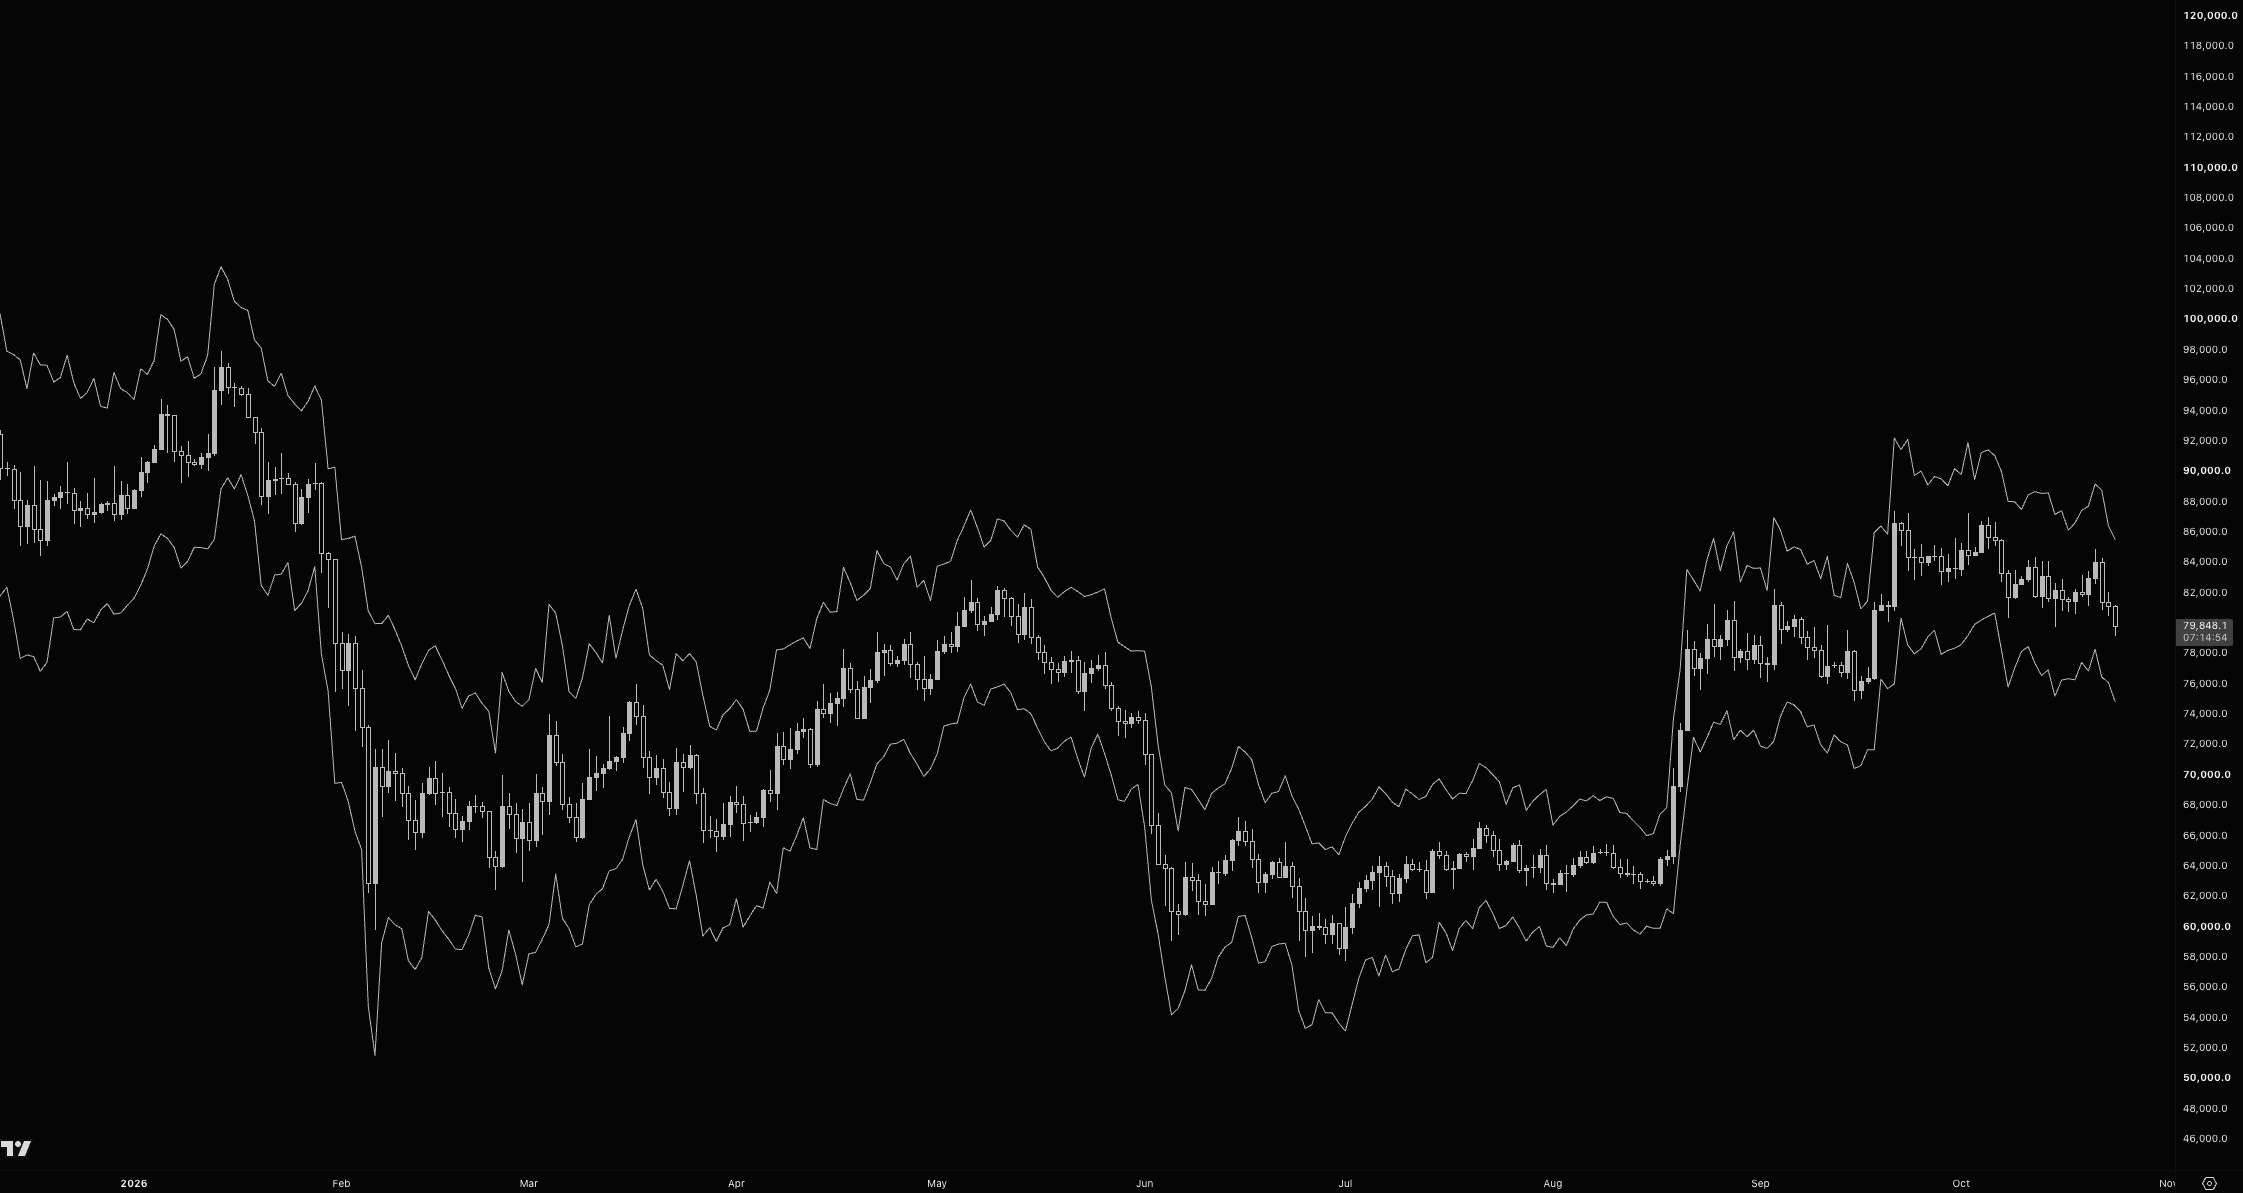
The average size of a bar over the last N bars, usually 14, on your trading timeframe. It includes wicks and gaps, it’s in price units, and you will find it on every charting software. A typical rule is a stop at 1.5 to 3 times ATR from entry. If the 1-hour ATR on BTC is $600 and you use 2x, your stop is $1,200 away.
The realized volatility is the standard deviation of returns, usually quoted as an annualized percentage. It’s more work than ATR, but it’s comparable across assets and timeframes. To turn it into a stop distance, scale it to your holding period with the square root of time:
Expected move ≈ annualised volatility × √(holding period in days / 365)
Use 365 for crypto and 252 for markets that close over the weekend.
For example, BTC realized volatility is 45% annualized. That’s about 2.4% per day. You plan to hold a swing trade for around four days, so a normal one-standard deviation move is 2.4% × √4, about 4.7%.
Put the stop at 1.5 standard deviations, and it sits about 7% away. Risking $1,000, your position is roughly $14,000 of BTC.
Now volatility drops to 30%. The same math puts the stop about 4.7% away, and the same $1,000 of risk buys roughly $21,000 of BTC.
Your stop and your size adjust to the market automatically. When the market gets wild, your stop widens and your position shrinks. When it goes quiet, your stop tightens and your position grows. Your dollar risk never changes. It also makes trades comparable across assets.
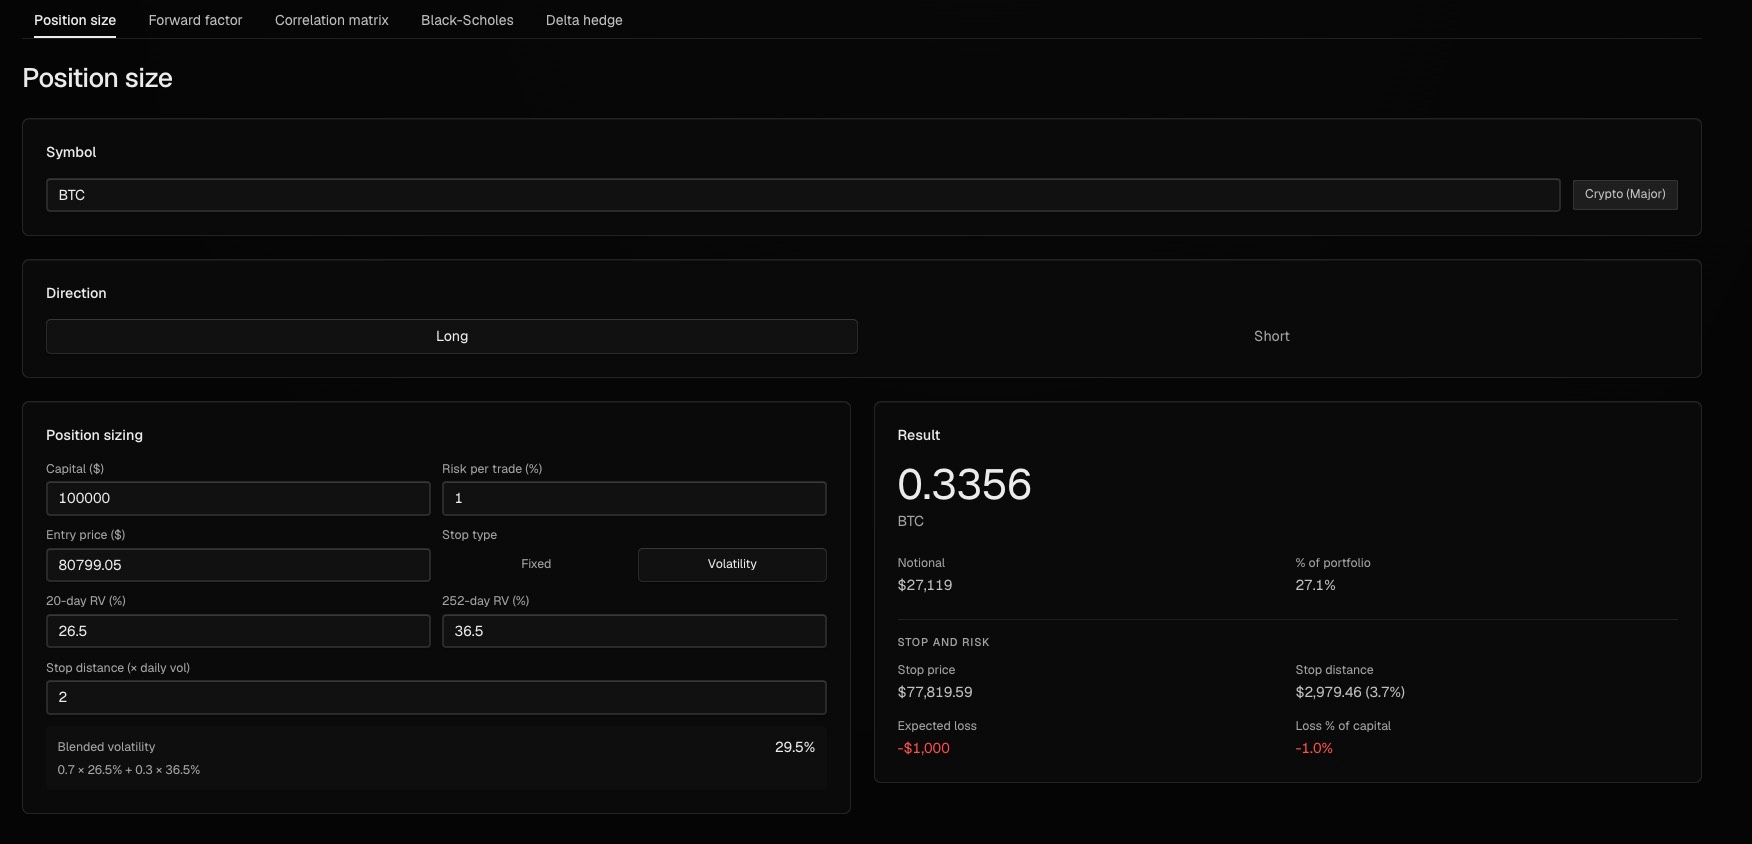
If you want to use volatility-based stop-losses instead of price-action ones, the rule of thumb is that for short-term trading it’s probably much easier to stick with ATR-based stops since there are indicators that will automatically plot these for you, and for sizing into bigger swing positions, using realized volatility of the asset makes more sense. The advantage here is that your stop-loss is not placed at exactly the same level as every other retail trader is going to use above key highs and lows.
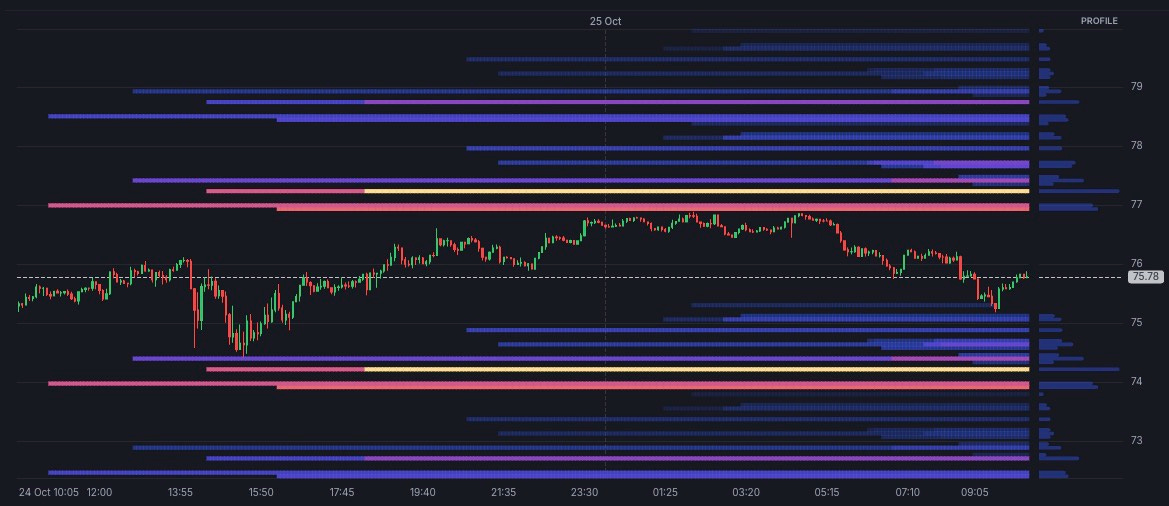
Once you have more experience, you can also experiment with hard and soft stops. The hard stop is the absolute end of the world scenario of the market just straight up going to zero, while the soft stop is more of a technical level where you are not going to automatically get stopped out but will rather wait if the price closes through that level, for example.
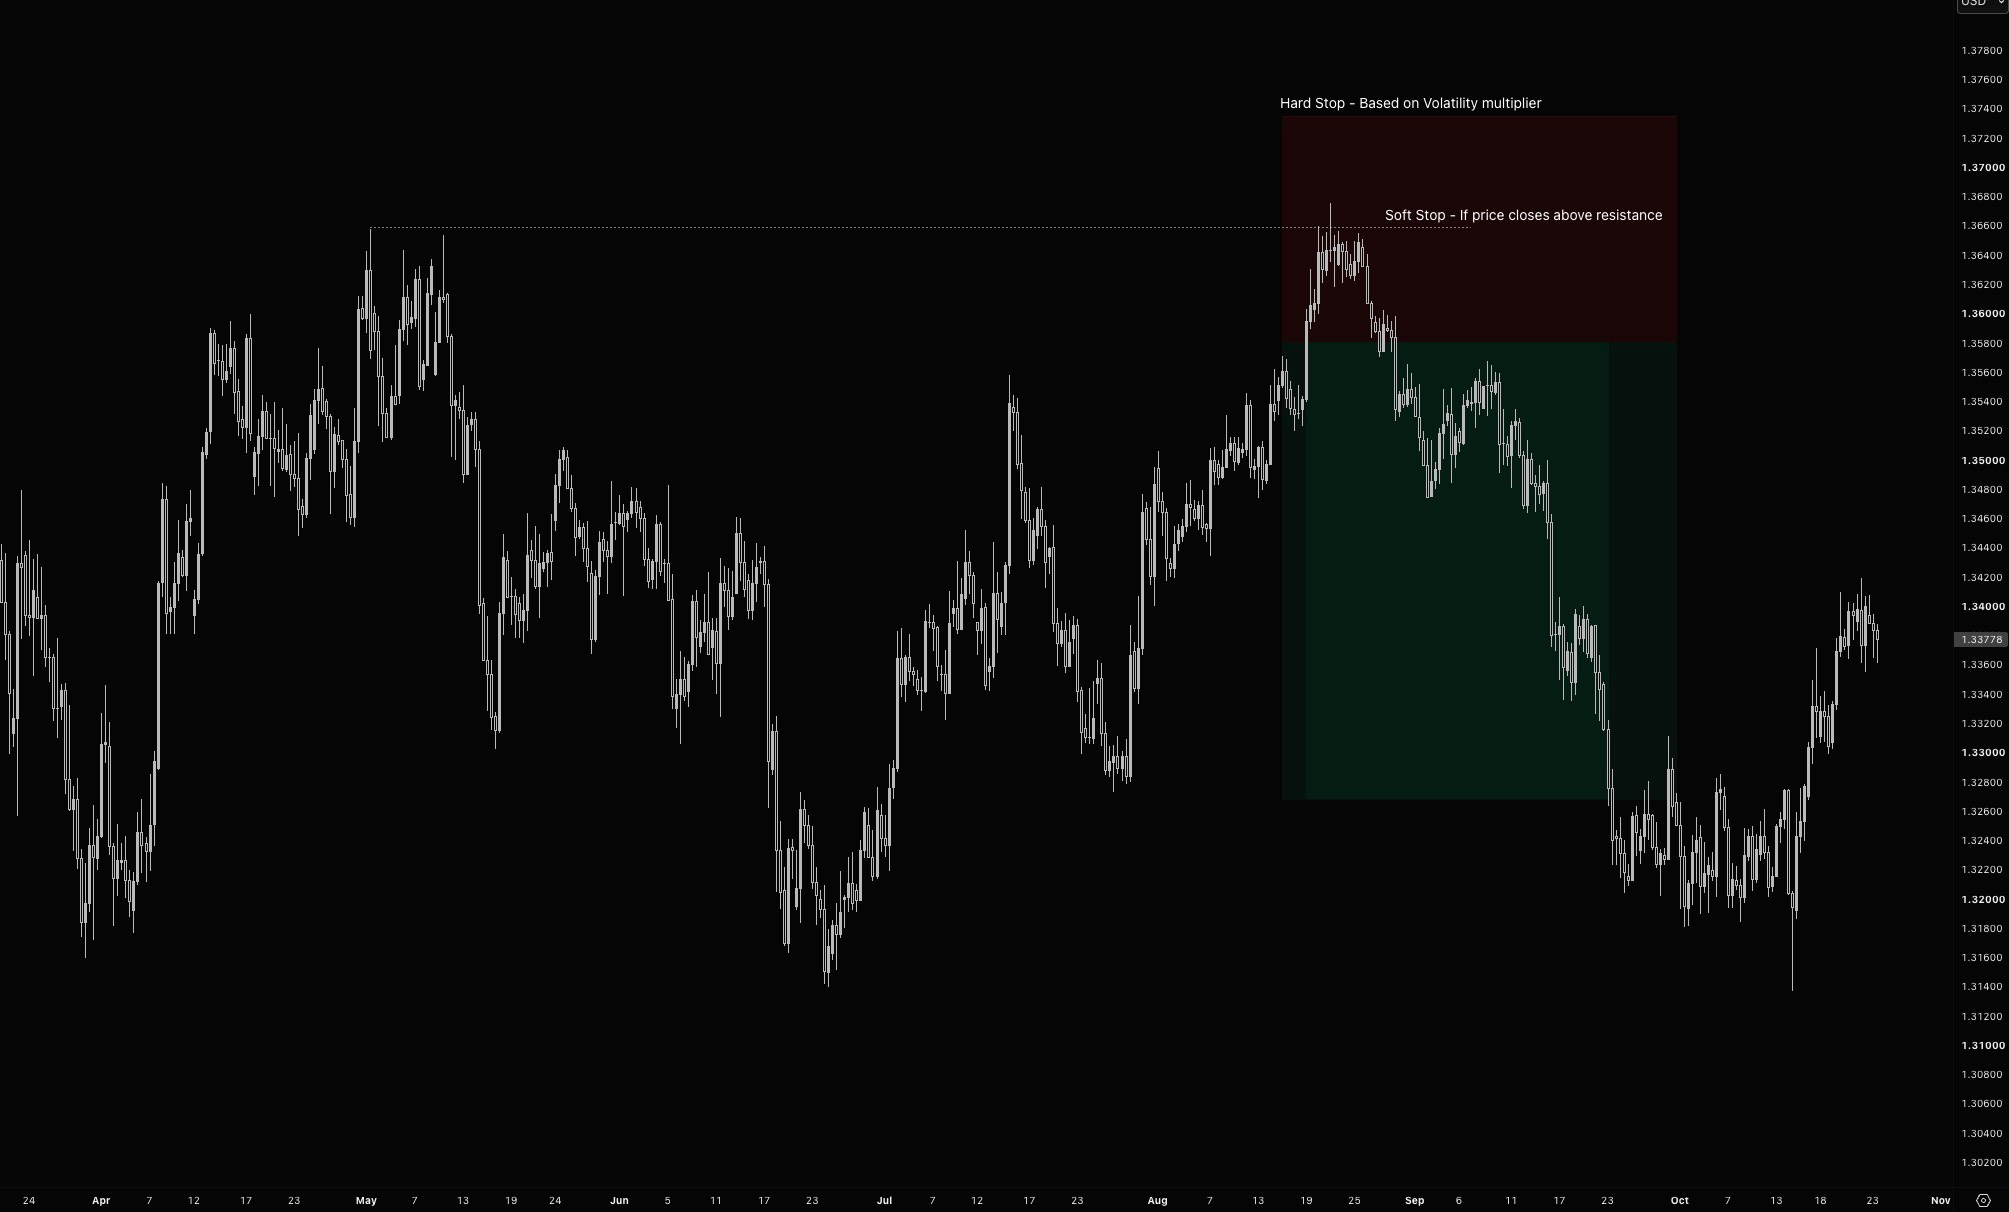
The hard stop frequently is risking slightly more, maybe 1.5-2R per trade, so it stings a little more if you get stopped out, but if you have the discipline, you can typically cut the trade early if a soft stop is violated, and you can save yourself from situations where you will get just wicked out of the trade because you placed your stop at the obvious level.
There is definitely a place in trading for not using a stop loss at all. There are numerous strategies that I trade that have no stop in the traditional sense of price hitting an XYZ level but exit rather on forecast changes or other indicators that signal changes in trends, volatility regimes, and so on. These are slightly beyond the scope of this article, and for you as a discretionary directional punter, I would highly recommend always having some sort of stop-loss in place.
Besides having to figure out what to do when you are wrong, you also need to come up with a plan for what to do when you are right.
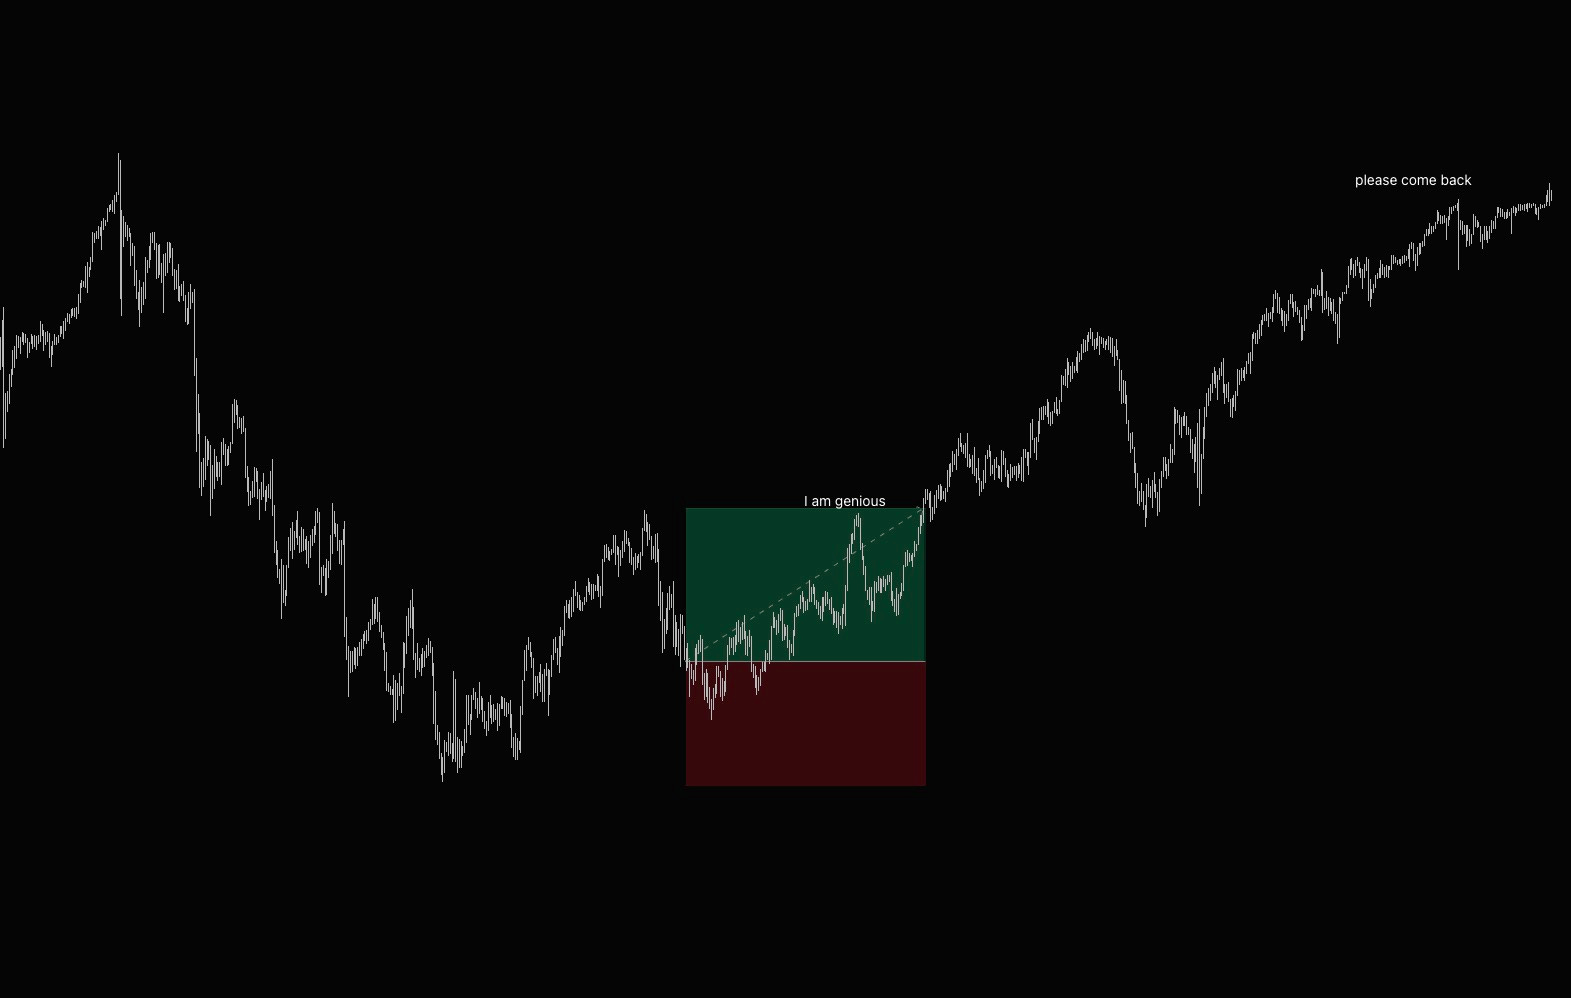
When it comes to taking profits, you either set the exit price at a technical level, often called the first trouble area, or just try to run trades and trail your stop loss based on some technical indicator, etc.
There are pros and cons to both; no one ever went broke taking profits, but you might be letting a lot of money on the table if the price just decides to run.
I would say that this is somewhat correlated with your trading style and holding periods. If you trade intraday for a couple of minutes to hours, there is no real need to try to make each trade a generational runner, but if you wait for your setups several days to weeks, taking profits quickly can hurt you since moves from higher timeframes usually last longer.
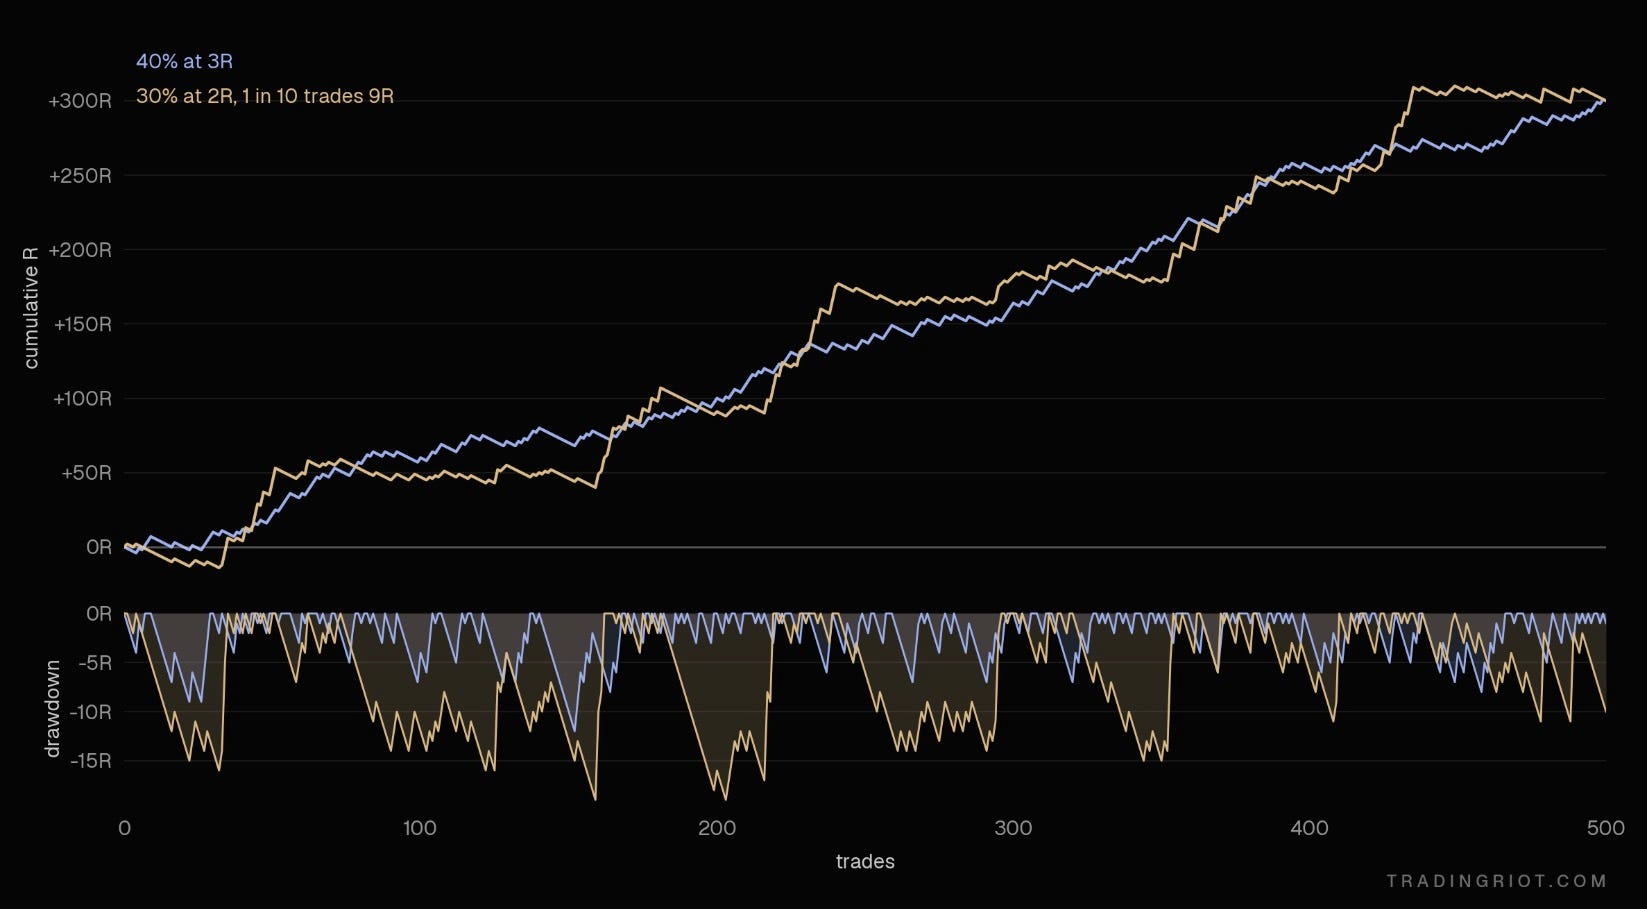
This can be visible in the example above, where one strategy has 40% WR with a fixed 3R take profit, while the other one has only 30% WR with 2R (so not profitable), but every tenth trade catches a 9R trending move.
Comparing the two curves, we can notice that the latter strategy has much deeper drawdowns but also higher jumps in equity curves, as it catches big moves from time to time, while the former is just gradually grinding up.
The latter strategy is how most equity curves for trend-following strategies look; I cover these more in the article about risk premium.
Partial take profits
“Closed half here, stop to break even, letting the rest run risk-free. Thanks for playing.”
Every time I see this on X, something dies inside me, as there are not one but two issues with this.
First, the partial take profits; typically, partials just buy psychological comfort. And as soon as you get hit with a string of losses, you notice you've been trimming all your winners while taking every loser in full.
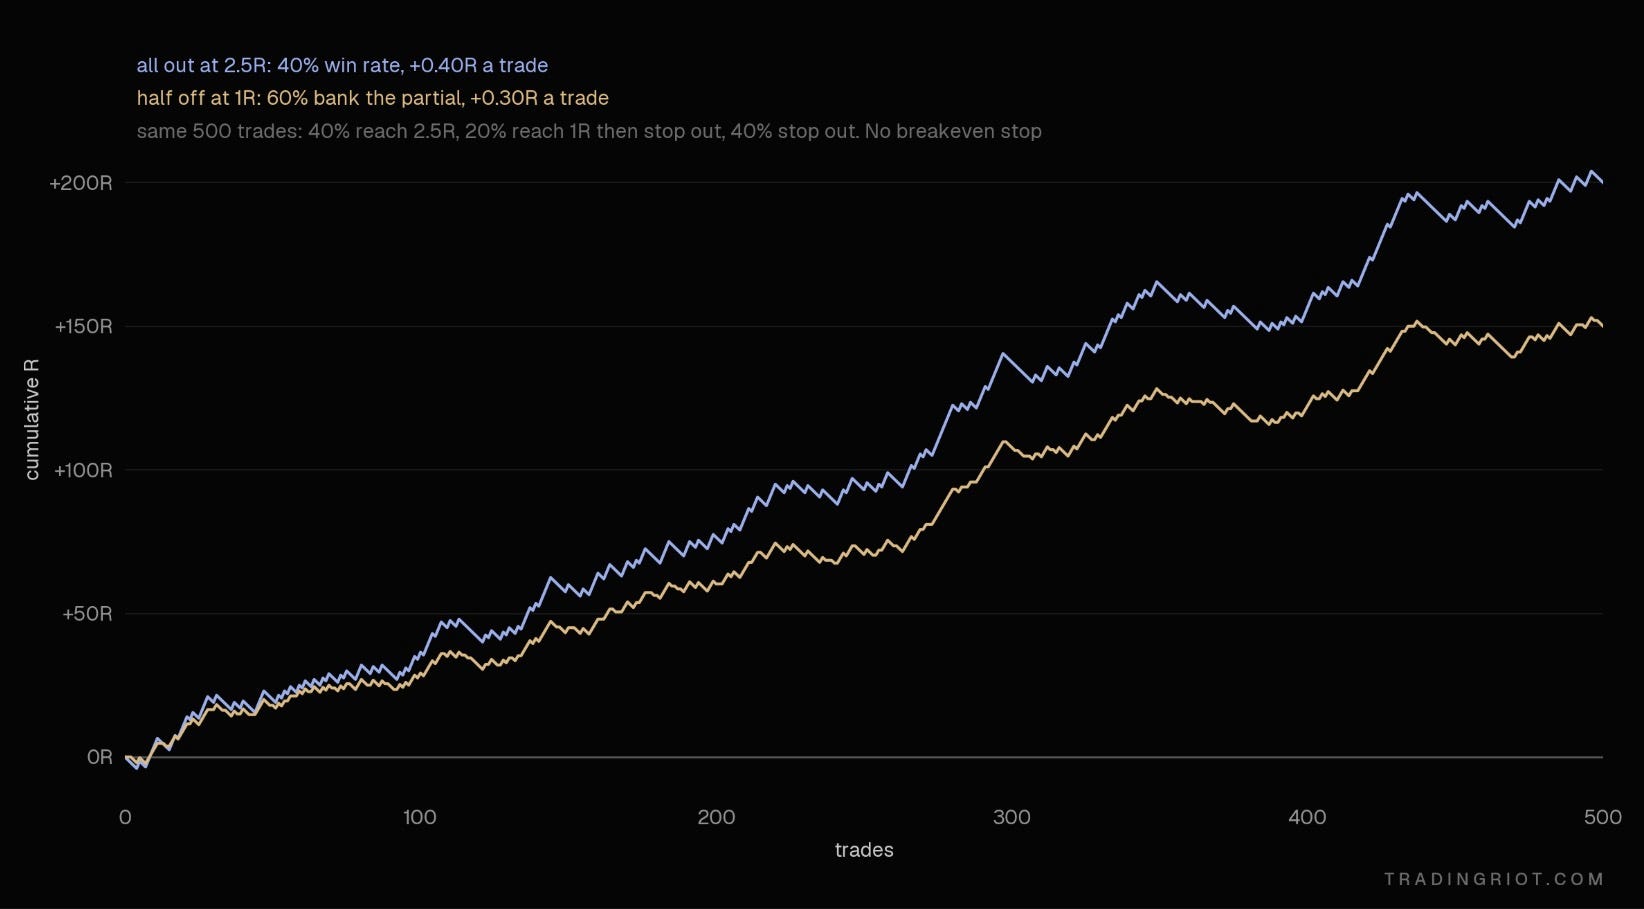
Again, you will find an answer if you should use partial take profits in your journal, but from my point of view, these are just used to make people calling the trades look good without the math backing the reason.
The breakeven stop
Most of you are technical traders. You use price action, order flow, levels, and indicators to pick our entries, our stops, and targets.
Then, as soon as the trade is a bit in profit, you throw all of that away and move the stop to the least technical price on the chart: your entry. A random number that has nothing to do with the market and everything to do with not wanting to lose money.
In my view, reakeven stop loss is very similar to psychological comfort as partial profits.
If you are using technical analysis, move your stop based on technical analysis. When the market makes a new swing low that holds, that’s new information. The stop goes under that. If the structure hasn’t changed, the stop doesn’t move.
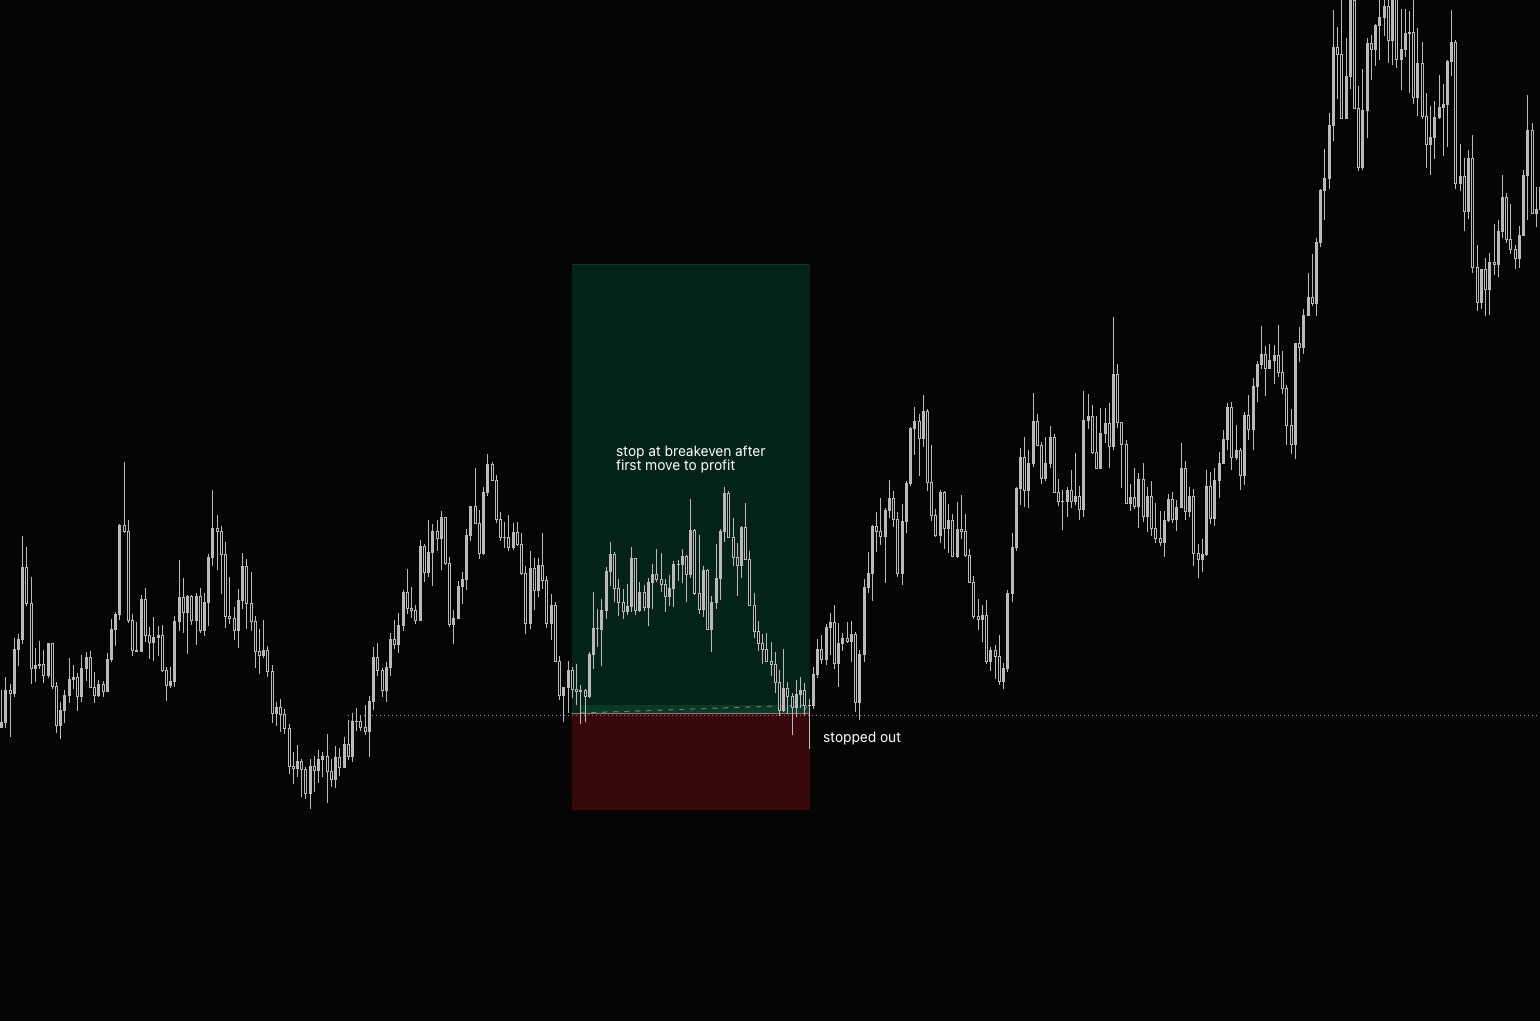
Another dumb thing people say is that once their stop is at breakeven, it is free trade.
If you buy something at $100 and it goes to $200, you are up $100. Thereafter, you will move your stop-loss, which was originally at $50, to $100. If the price goes back to $100, you will be stopped out after you were $100 in profit. So you gave back $100; that doesn’t sound free to me at all.
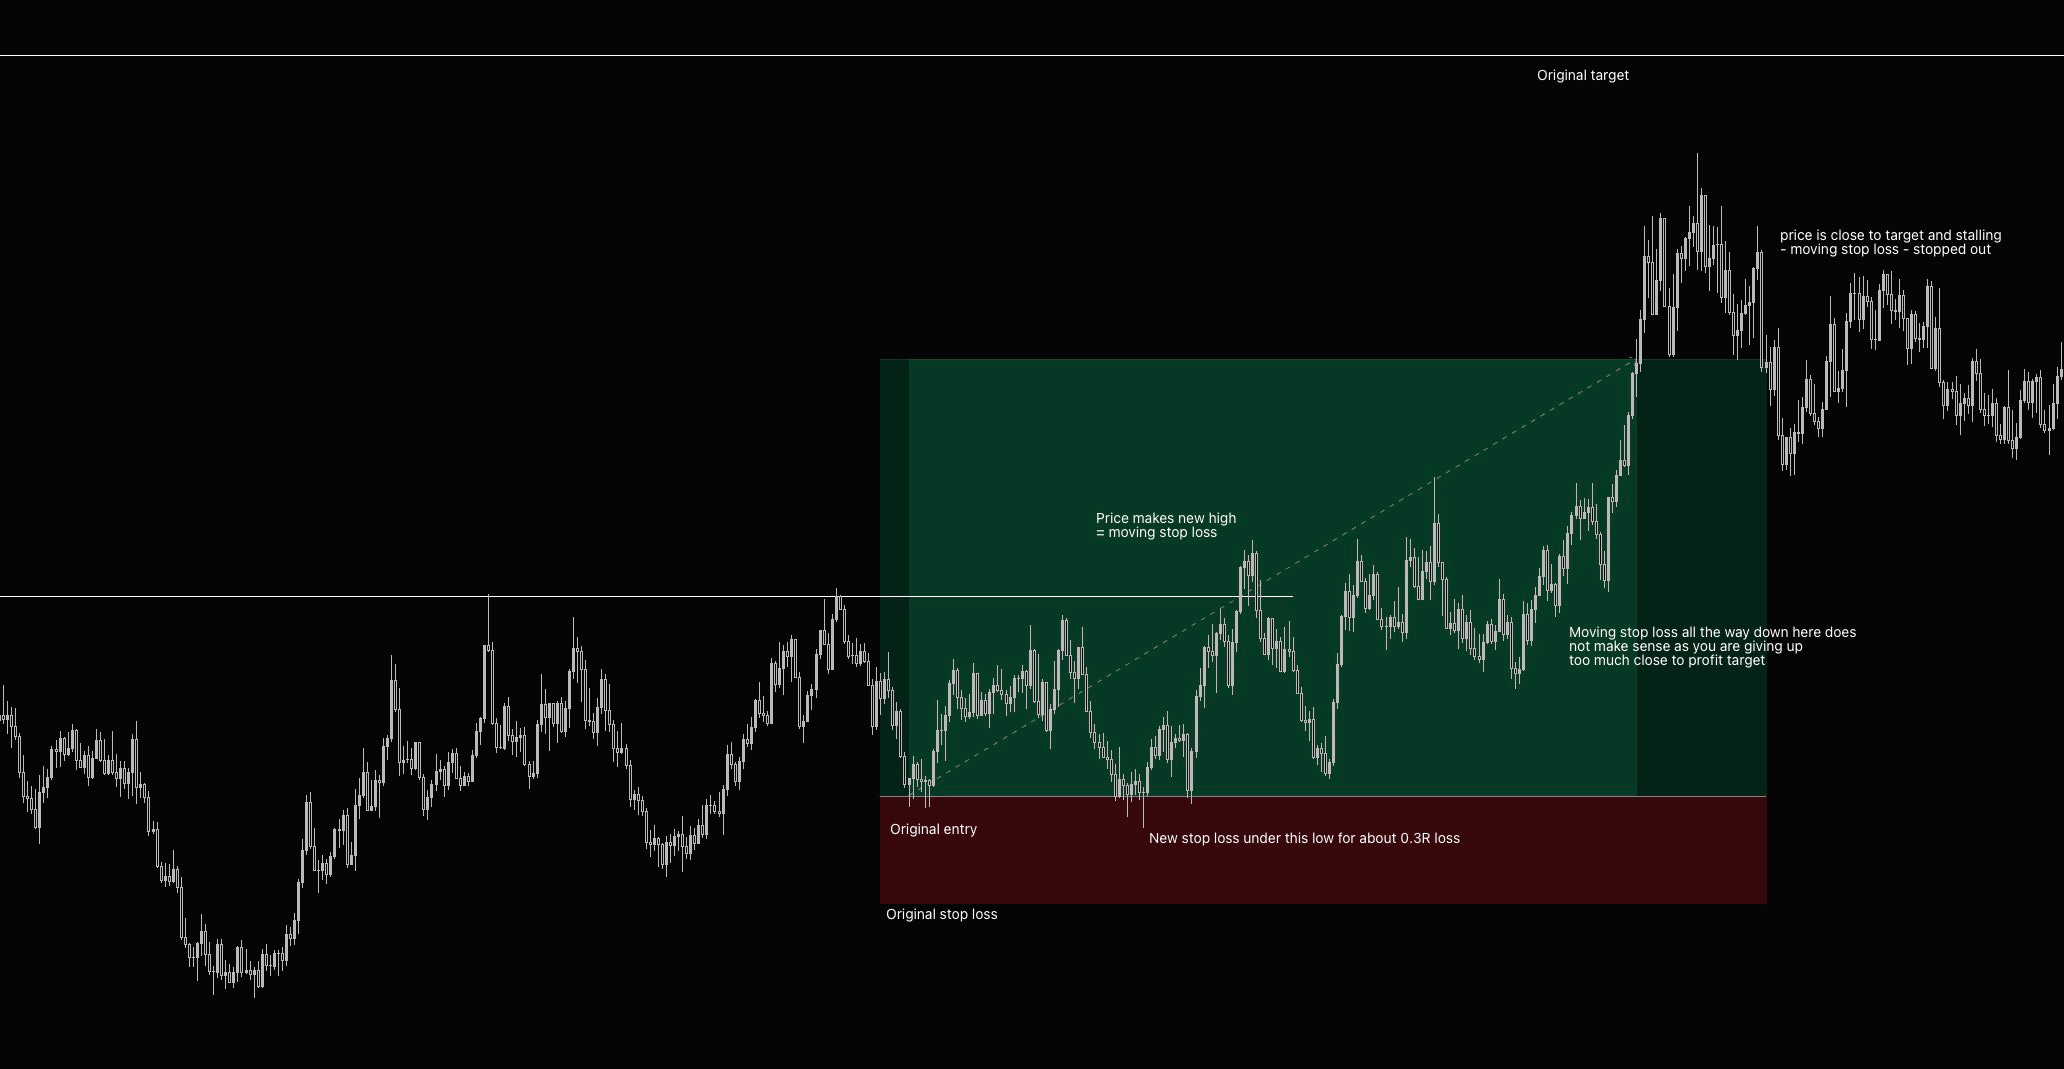
Especially if your target for this trade was $250, your trade was close to take profit, but you just let it go all the way back for no reason.
Orderflow which we cover later,, will be useful here, but technical analysis can work as well; if you see price stalling and reversion against you, there is no reason to just be stubborn and watch all profits evaporate.
You should always be using the timeframe you have entered on; one of your favorite things to do is enter a trade from the daily level and then switch down to the 5-minute chart to question all life decisions and over-manage the positions. Take a look at the example below with some annotations.
Sizing up and sizing down
Another thing I see so often is people sizing down when they are on a losing streak.
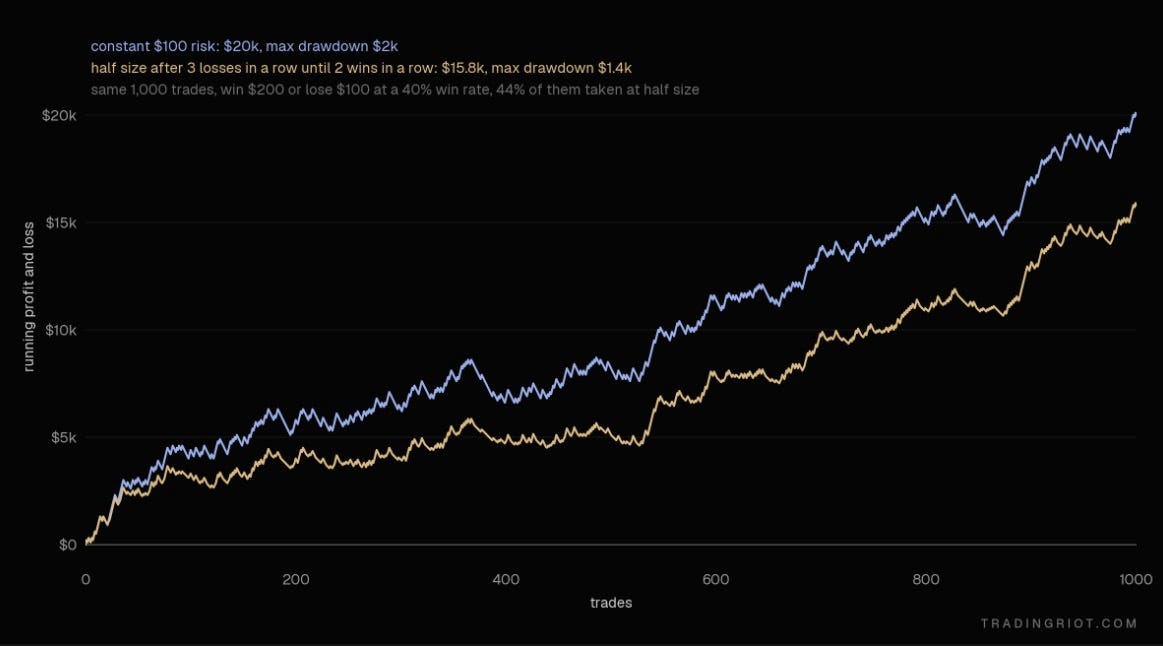
See this trade sequence, and let’s say you risk $100 and win $200 if you are correct.
W W W L L L L W W W
If you run a math on this, it will be 200 + 200 + 200 - 100 - 100 - 100 - 100 + 200 + 200 + 200, which is 800.
Now let’s say after a third loss in a row you will cut your risk to half size, so it’s 200 + 200 + 200 - 100 - 100 - 100 - 50 + 100 + 100 + 100, which is $550.
You took the full hit from the losing streak and then cut your size right as the winners came back. Losing streaks are random. Changing size because of them just puts you on the wrong side of the randomness.
If you think I just made this example purposely to make the sizing down look bad (which I did), here is an outcome over 100 trades with even more favorable rules where, after three consecutive losses, the size is halved until two wins in a row.
Price action
Now with some fundamentals out of the way, we can talk about technicals. While the order flow that follows is applicable to short-term trading, these price action concepts are universal and will work across all timeframes and trading styles.
Every market, whether crypto, forex, stocks, or futures, needs a buyer for every seller.
That means “there were more buyers than sellers” is never true. Every trade has both. What changes is urgency. When buyers are willing to pay higher and higher prices to get filled, the price goes up. When sellers are willing to accept lower and lower prices, it goes down.
Price rises while demand overwhelms supply and stops rising when buyers run out or enough supply shows up to absorb them. Price movement is the result of an imbalance in supply and demand, and that imbalance comes from someone's urgency to transact.
I am a fan of this rather simple explanation of price going up or down instead of trying to attach magical reasonings to it. People don't move markets because of a technical or fundamental indicator. People move markets. Indicators just describe what they did.
Markets are either trending or ranging. In auction terms, imbalanced or in balance.
Newer traders hunt trends constantly. But markets spend most of their time in balance. Once a price finds a fair value, it takes time for someone with enough size to show up and push it somewhere else. You can see this on the Bitcoin chart, where it is pretty clear that over the last two years the price went mostly sideways, and when it trended, it was often during very short times.
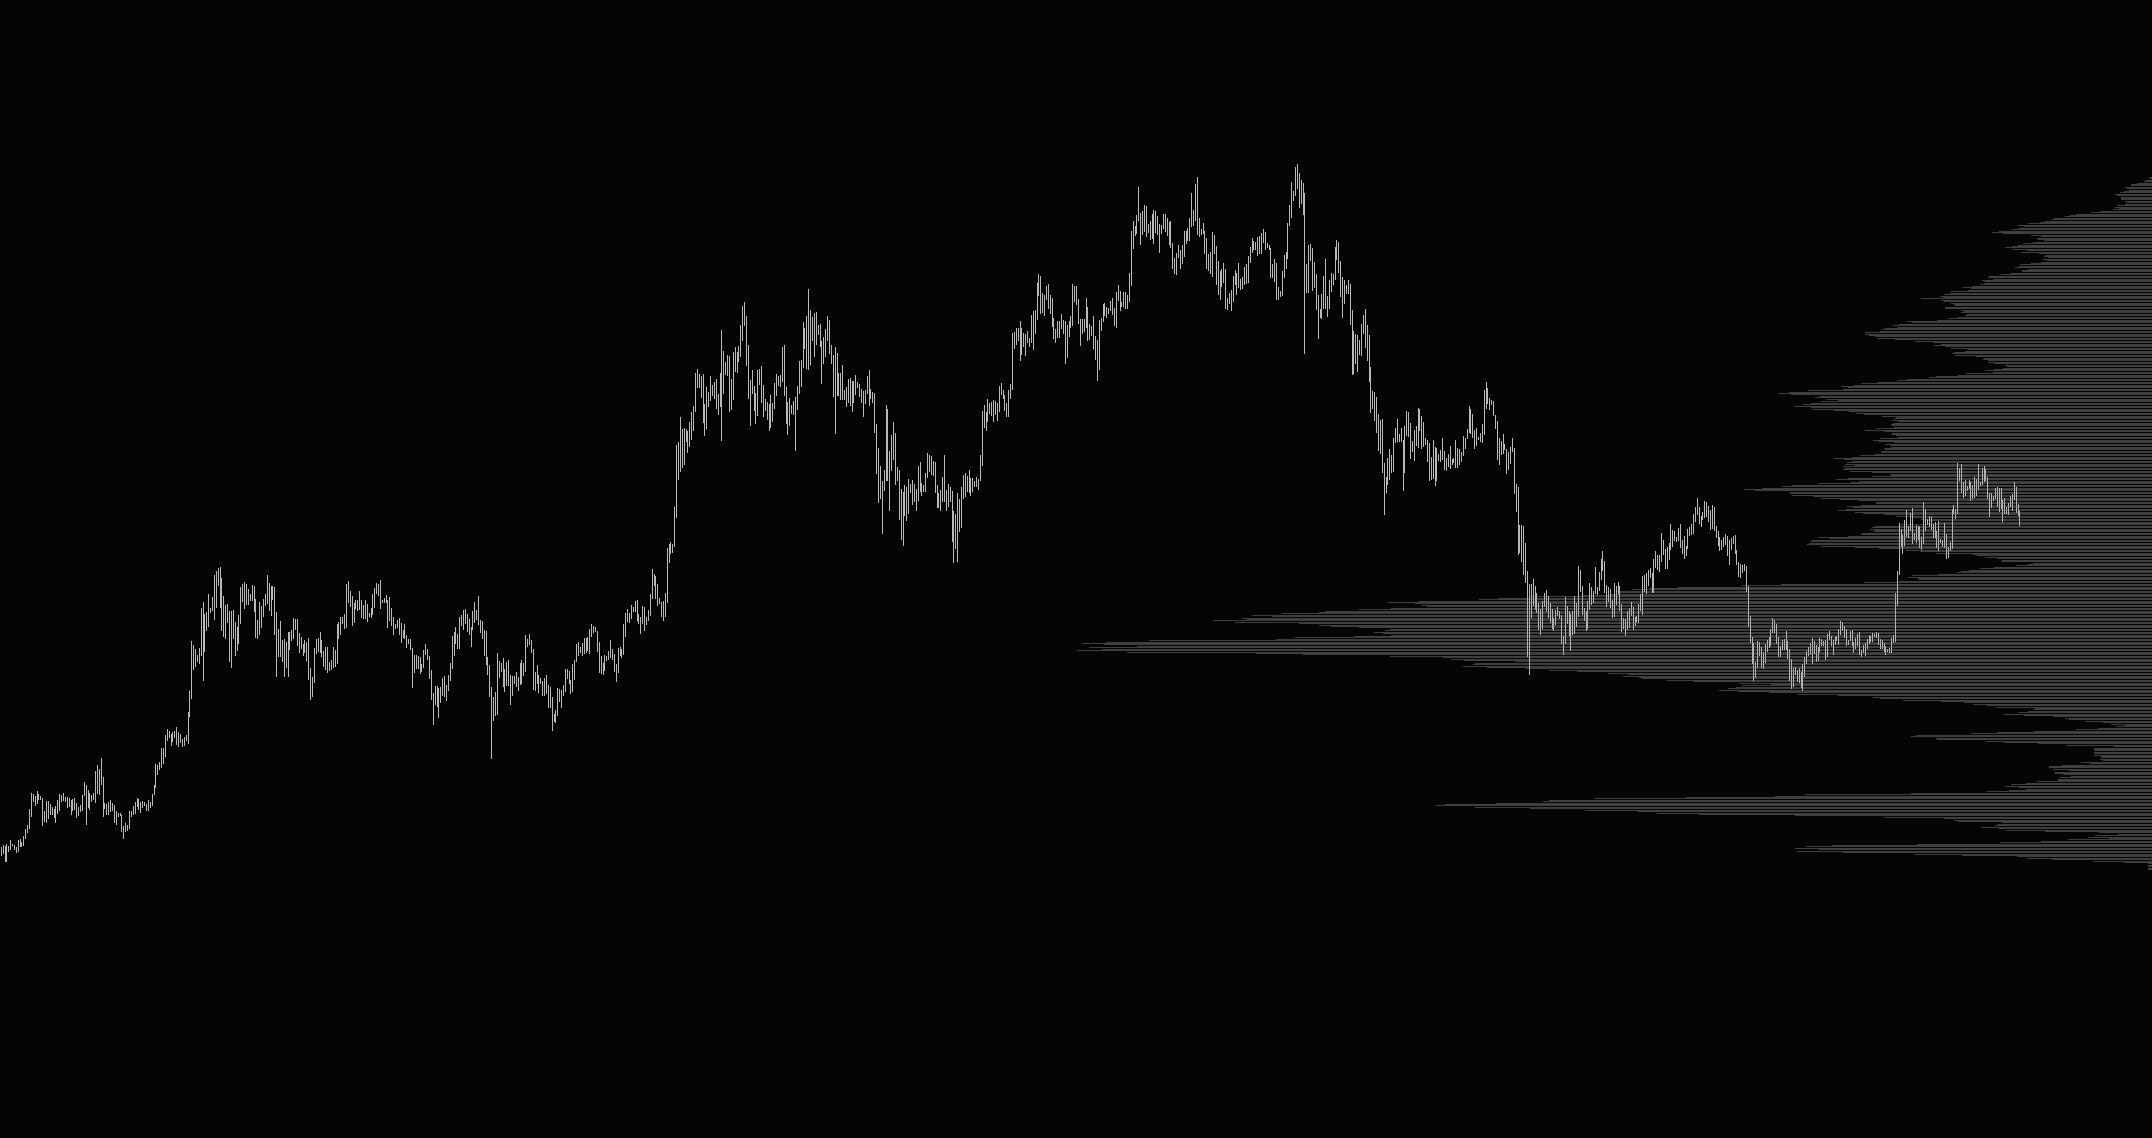
Put a volume profile on the side of the chart, and the pattern is clear. In balance, lots of volume trades as buyers and sellers go back and forth. Those are high-volume nodes (HVN). In imbalance, price moves fast and little volume trades. Those are low-volume nodes (LVN).
When the market leaves balance, it tends to travel to the next area where a lot of volume was traded before, like BTC selling from all-time highs all the way to $60,000, which was the key balance area back in 2024. Markets look for fair value where they found it in the past.
Indicators, candlesticks, and chart patterns
This article will only really scratch the surface of technical analysis. MACD, RSI, moving averages, and stochastics are mostly averages of past prices, plotted different ways.
Trend indicators work in trends and get chopped up in ranges. Oscillators work in ranges and blow up in trends. The good news is that they're objective, so you can backtest them. From my personal perspective, indicators are great and can be useful, but you need to know in what market conditions you are in or what type of market you are trading.
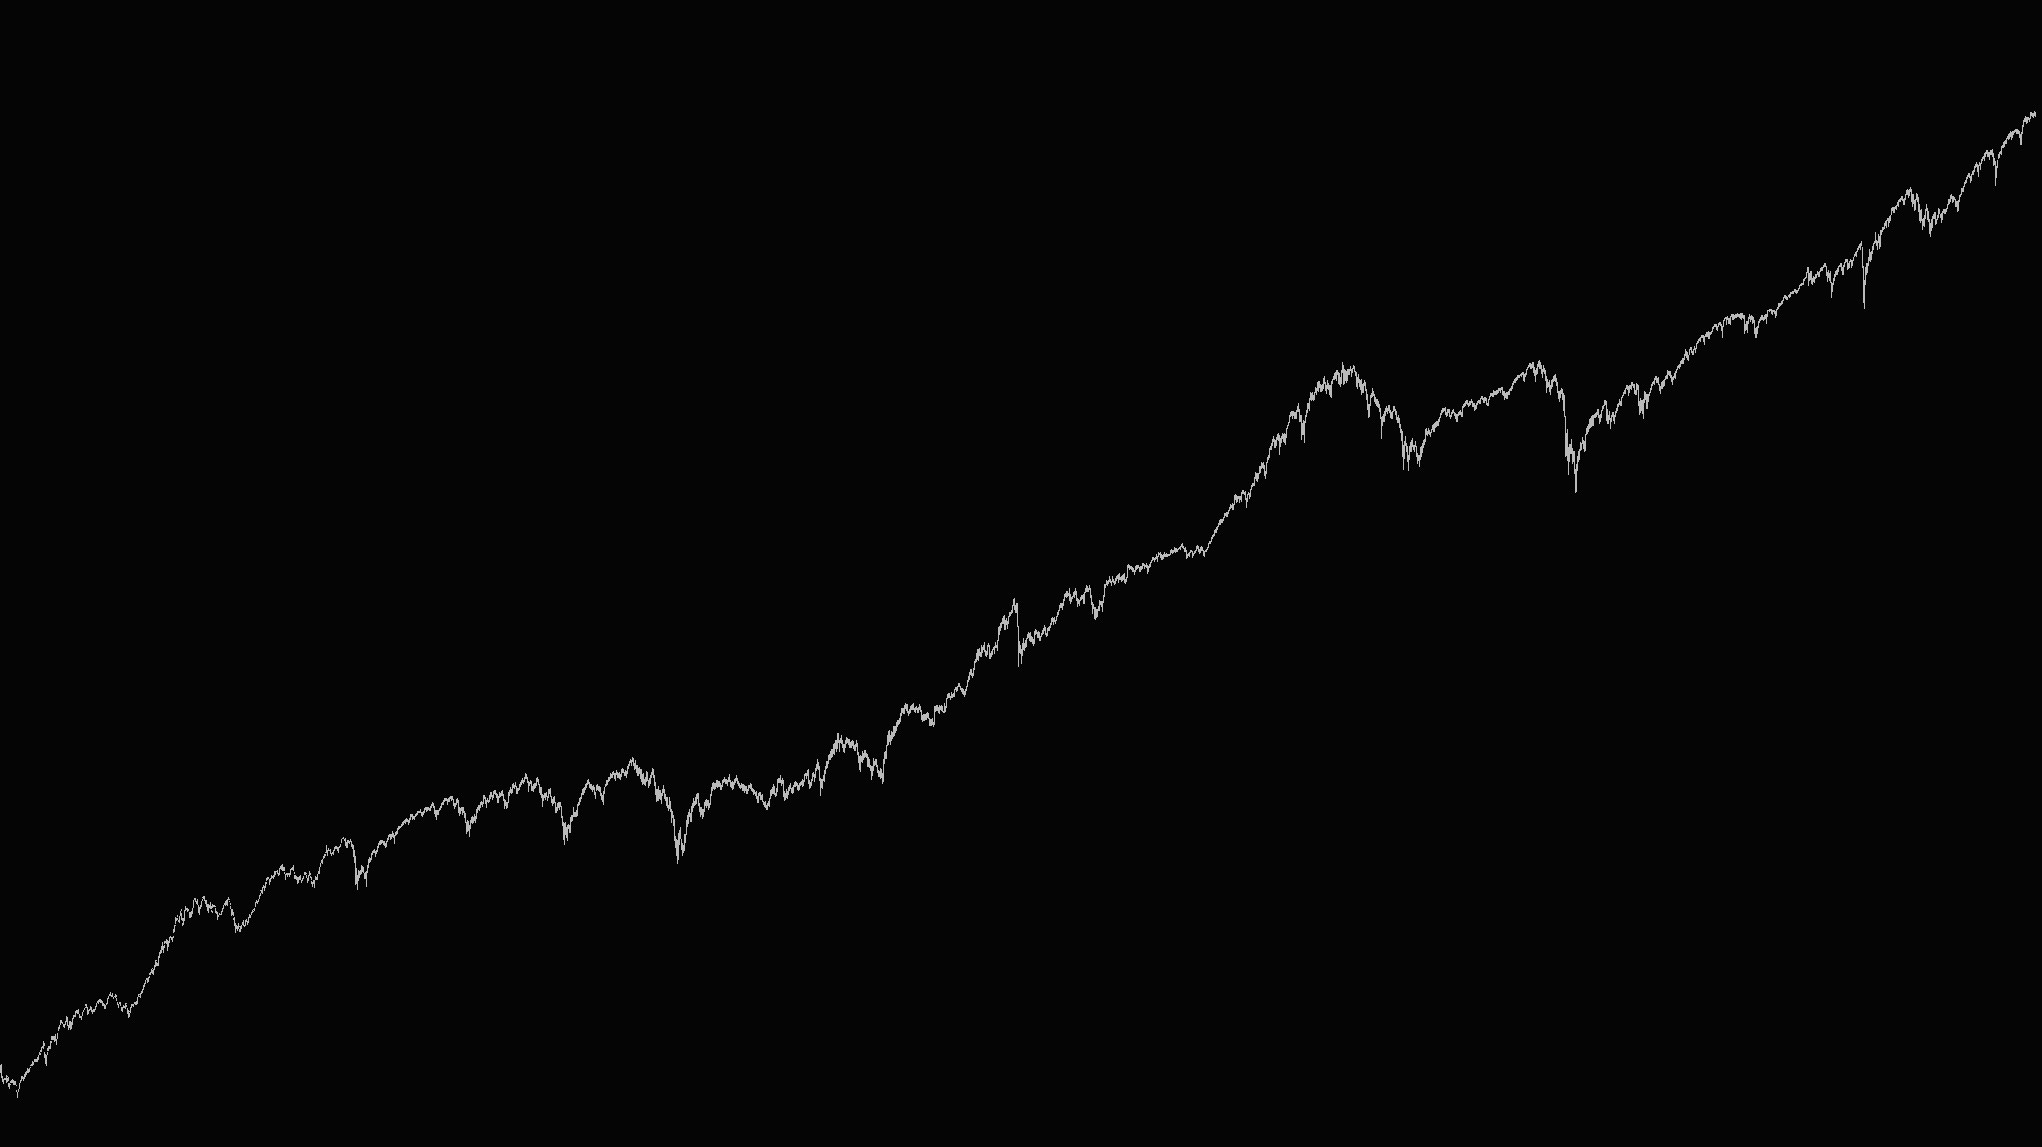
This is the S&P500 chart over the last 70 years or so; obviously, using something like a moving average crossover would be great here since the price went up.
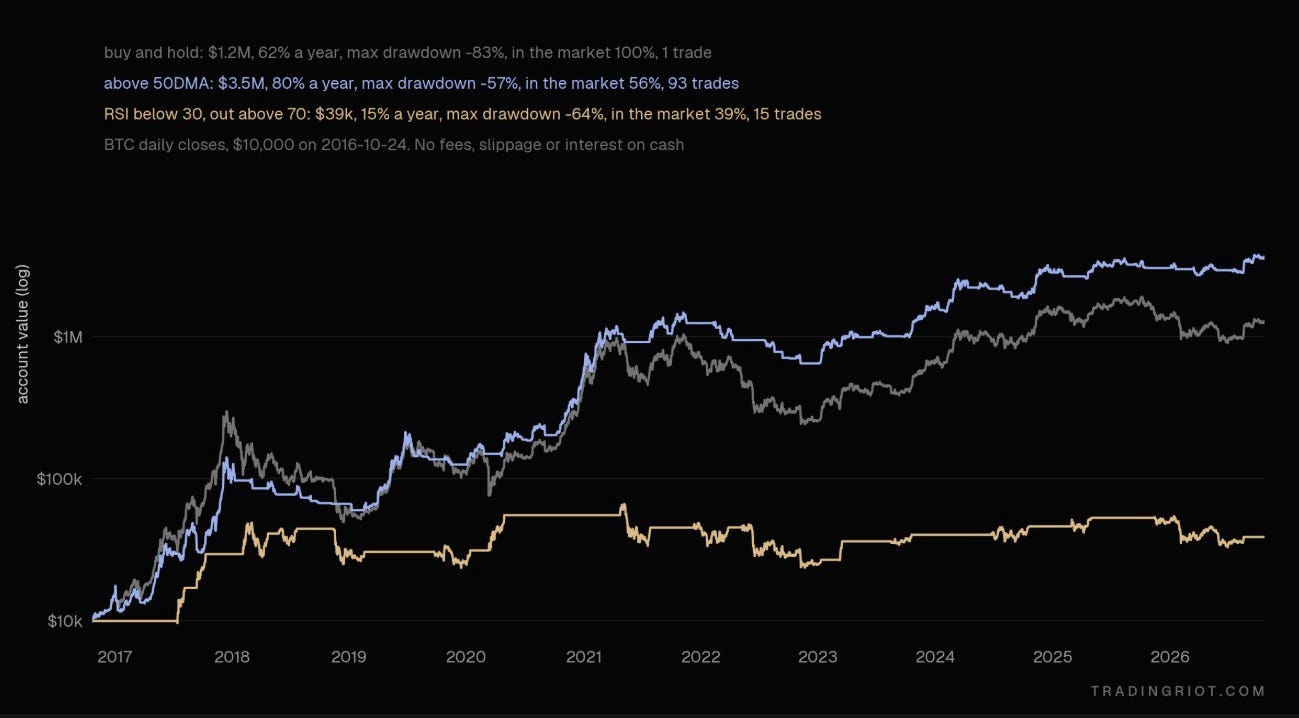
Overall, indicators are great for confluence; they can add conviction to trades or help you stay in trades longer, but I would not use them blindly. To demonstrate this better, we can take a look at BTC; it obviously went up a lot over the last decade, so something like a long if RSI is below 30 (oversold) and going flat at 70 (overbought) is going to suck, as during trending markets RSI will be way above 70.
On the other hand, using a 50-day moving average looks pretty good and actually outperforms buy and hold, as it rides the trends when Bitcoin rallies while sitting in cash once the trend is broken.
When it comes to candlestick patterns, there are hundreds of them; I have only ever found a few of them to be useful.
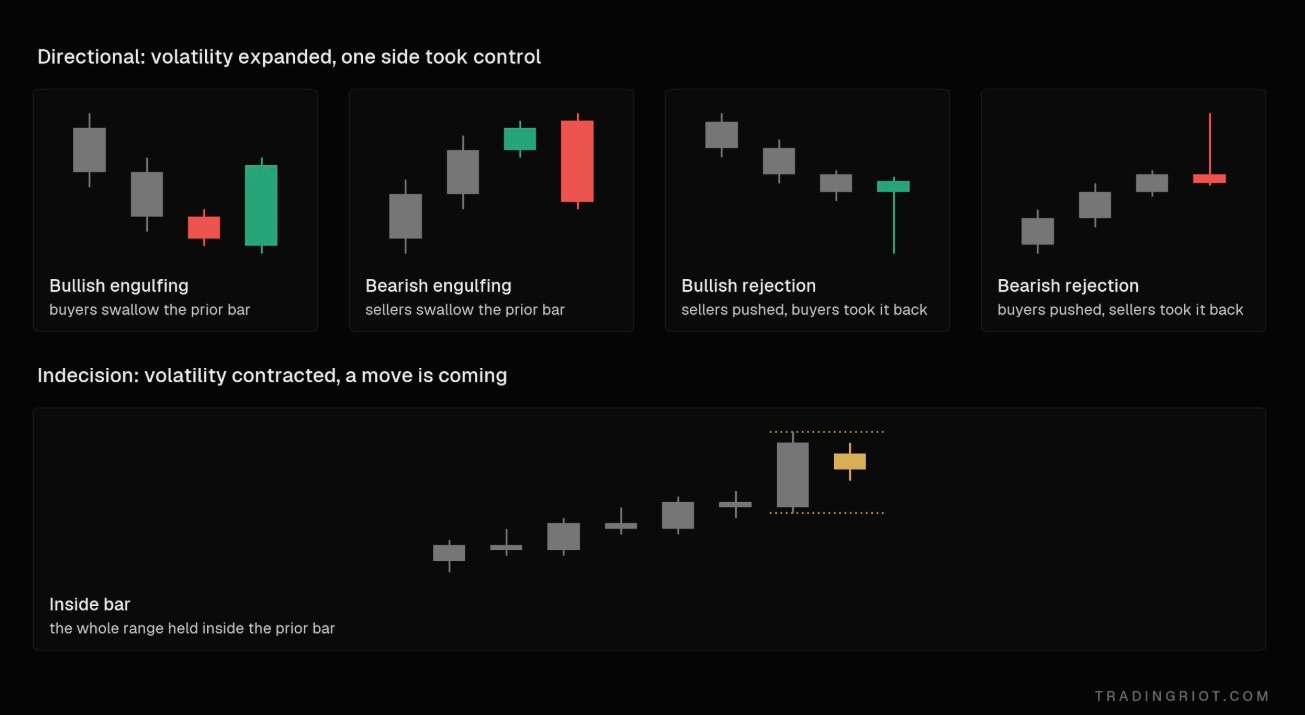
Directional candles, like a large engulfing bar or a long-wick rejection, tell you volatility expanded and one side took control. Indecision candles, like inside bars, tell you volatility is contracted and a move is coming.
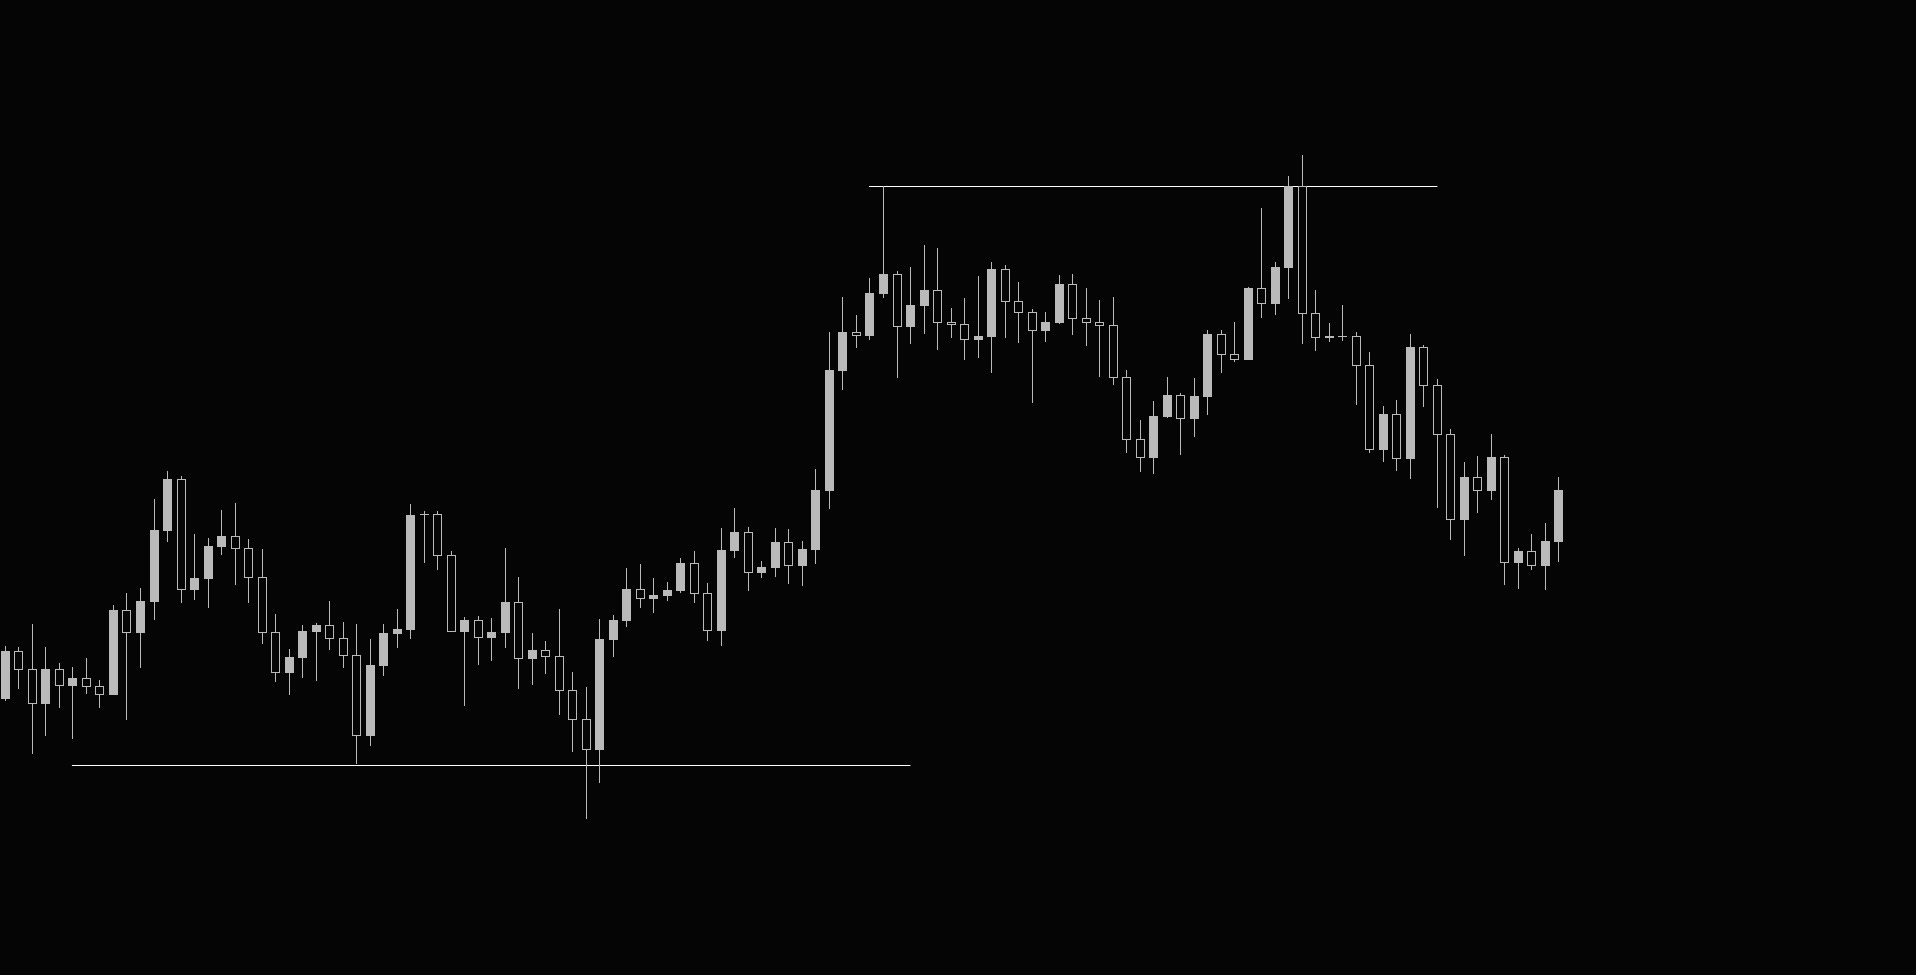
It is always worth putting them into context. When the market is trying to break prior highs or lows and you see large rejection in the form of an engulfing or reversal candle, it is pretty clear that supply overwhelmed demand or vice versa, and there will be a decent amount of traders who were betting on breakouts stuck in their positions.
Inside bars are also interesting, as they signal possible incoming volatility. When highs and lows of inside bars are tested, they trigger a lot of automated trading strategies so we can either trade with or against them.
These candlestick patterns are worth observing on daily, weekly, and monthly charts; there are no algorithms waiting for a breakout of the 5-minute inside bar or trading 15-minute engulfing candles since those are too frequent and therefore noisy.
For chart patterns like head and shoulders, double tops, triangles, etc. They usually form in balance, during accumulation or distribution, which comes from Wyckoff and is a good description of how markets work.
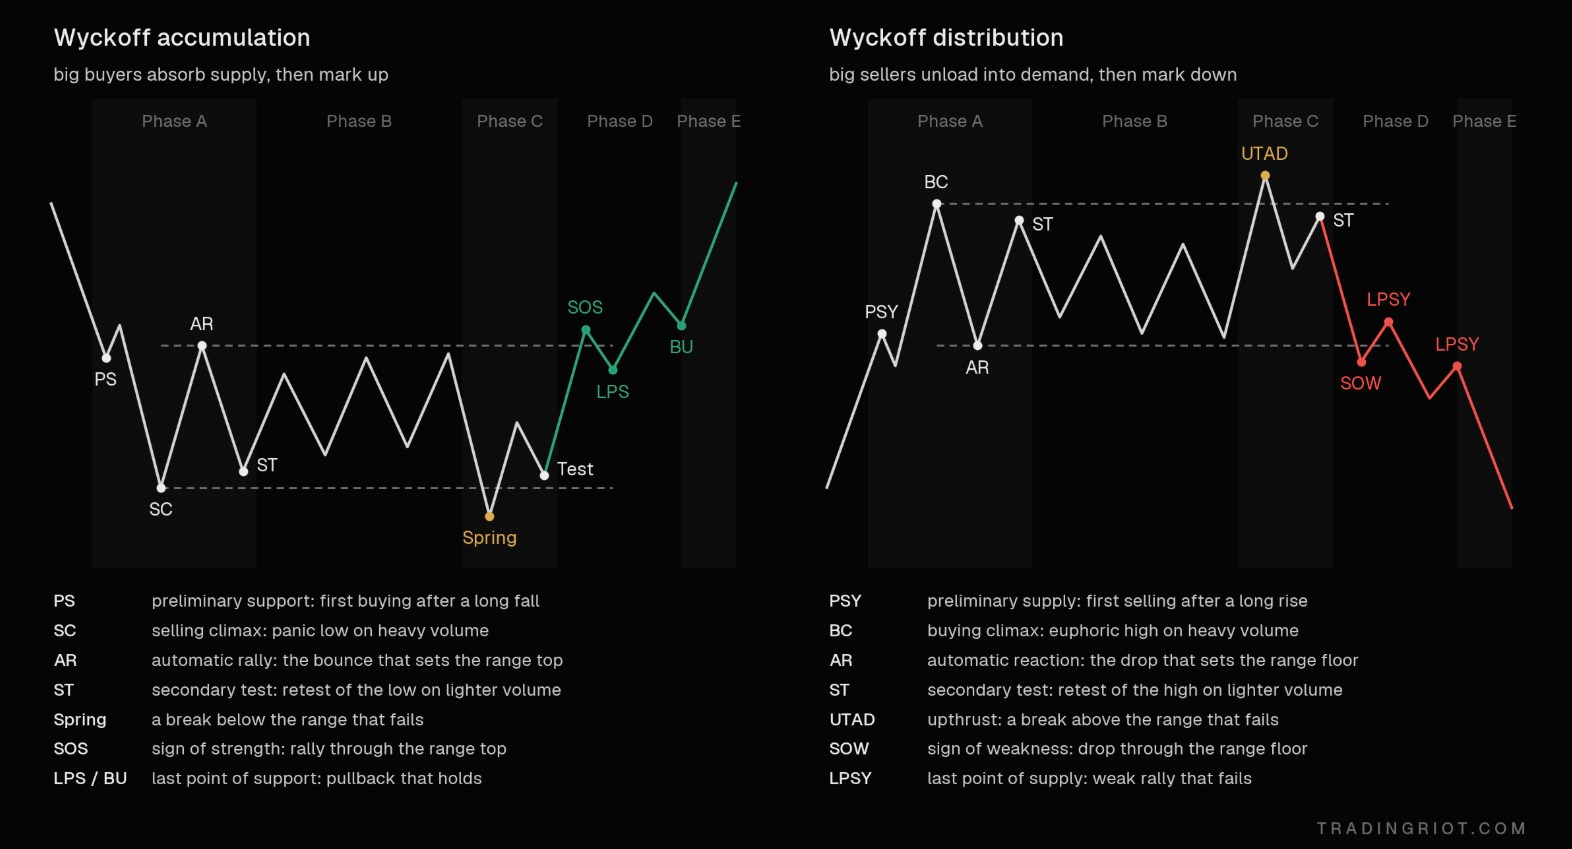
While I would not trade head and shoulders and triangles per the textbook description, these Wyckoff accumulation and distributions are what you will often see happening at the end of the moves in a less textbook-looking way.
For your own sake, you should skip things like the Gann Theory, Elliott Waves, and all the other astrology for men approaches to trading.
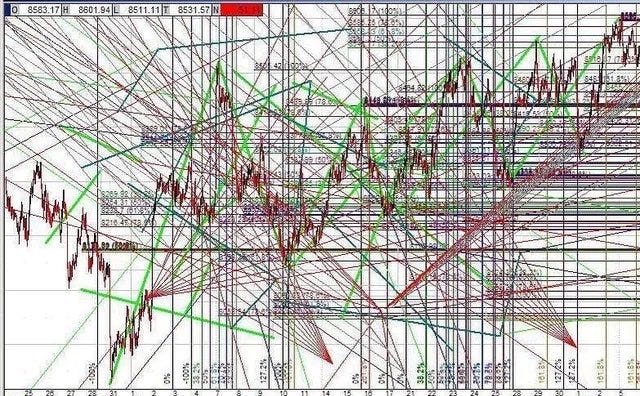
How you should think about price action trading
The way most price action courses and education work is they will usually present you with several textbook examples so you will then open the charts and start hunting for exact patterns without much of a context.
I am not sure if this is the best way; price action can be very noisy, and I think using it alone without any meaningful context is pretty hard.
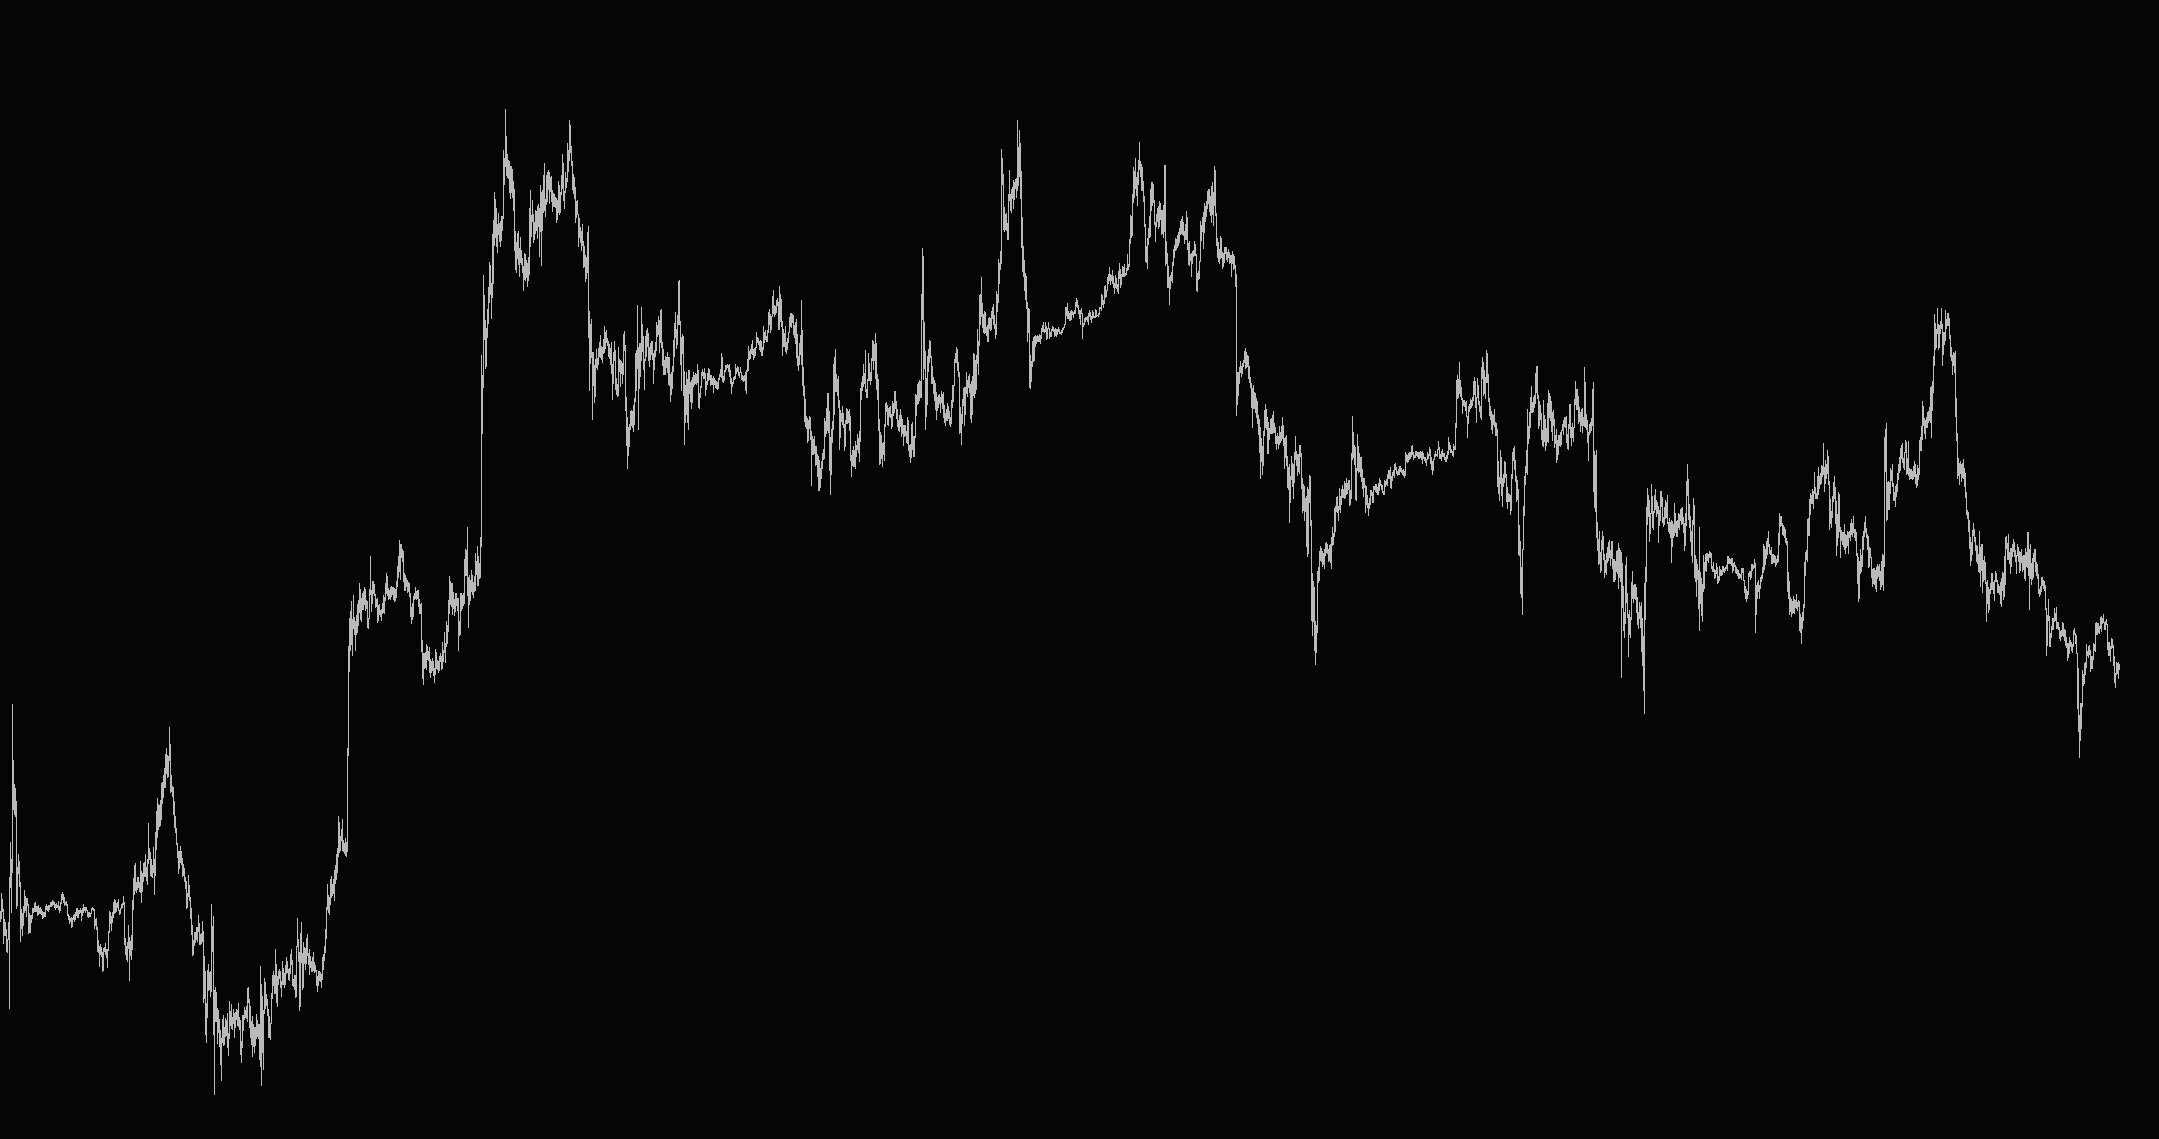
So how do you get the context? There are basically three ways: the regime modeling I mentioned for the swing trading approach, which we are not going to focus on now as it’s more complex, and the top-down analysis, or using indicators for your navigation.
The top-down analysis basically goes from higher to lower timeframes to find trading opportunities. If you want to be trading very short term, you might use D1 and H1 timeframes for your analysis and execute trades in 5 minutes. For slightly longer holding periods, weekly and daily timeframes can be used for analyzing charts and H1 for trade execution. Take a look at the chart above; what timeframe is it?
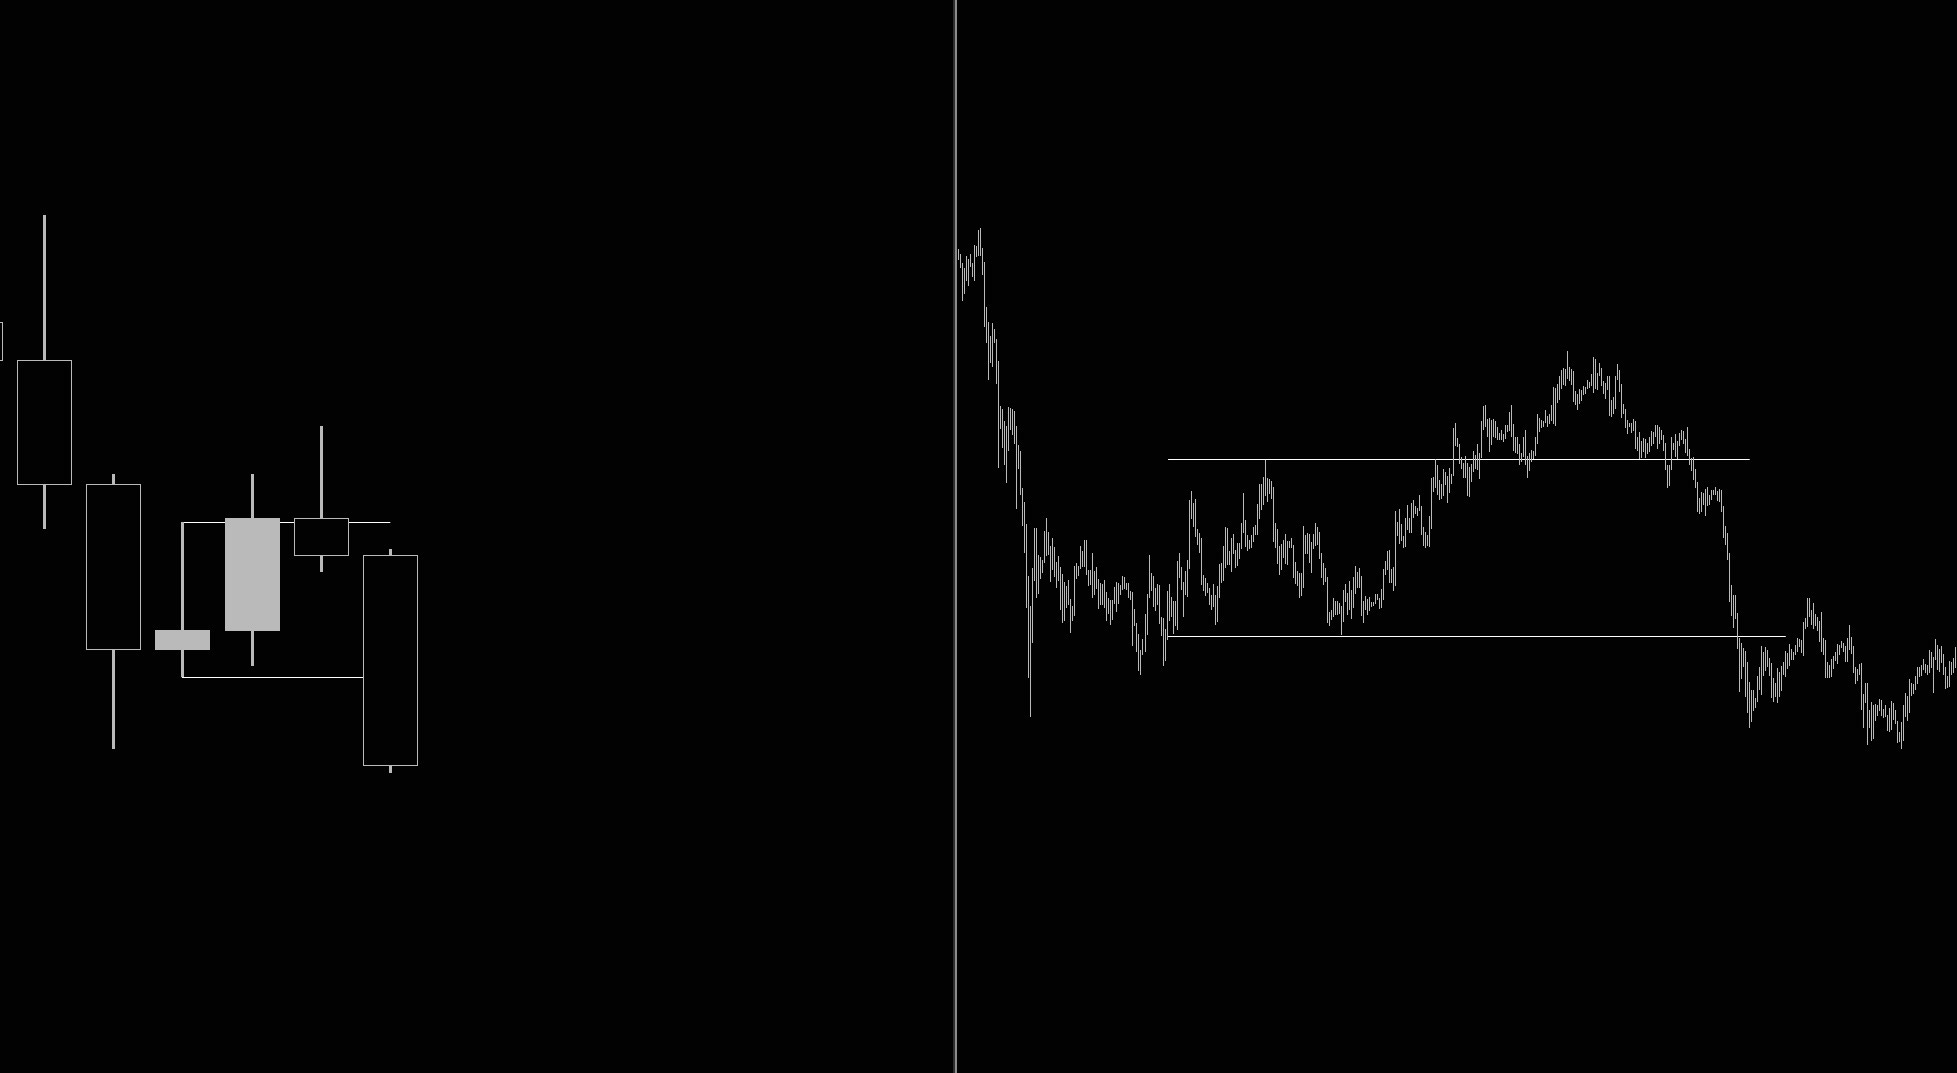
Unless you are chronically online and watching charts, you won’t be able to tell, which is fine; one of the key characteristics of price is that it is fractal, the patterns that happen on higher timeframes will exist on lower timeframes in the same way.
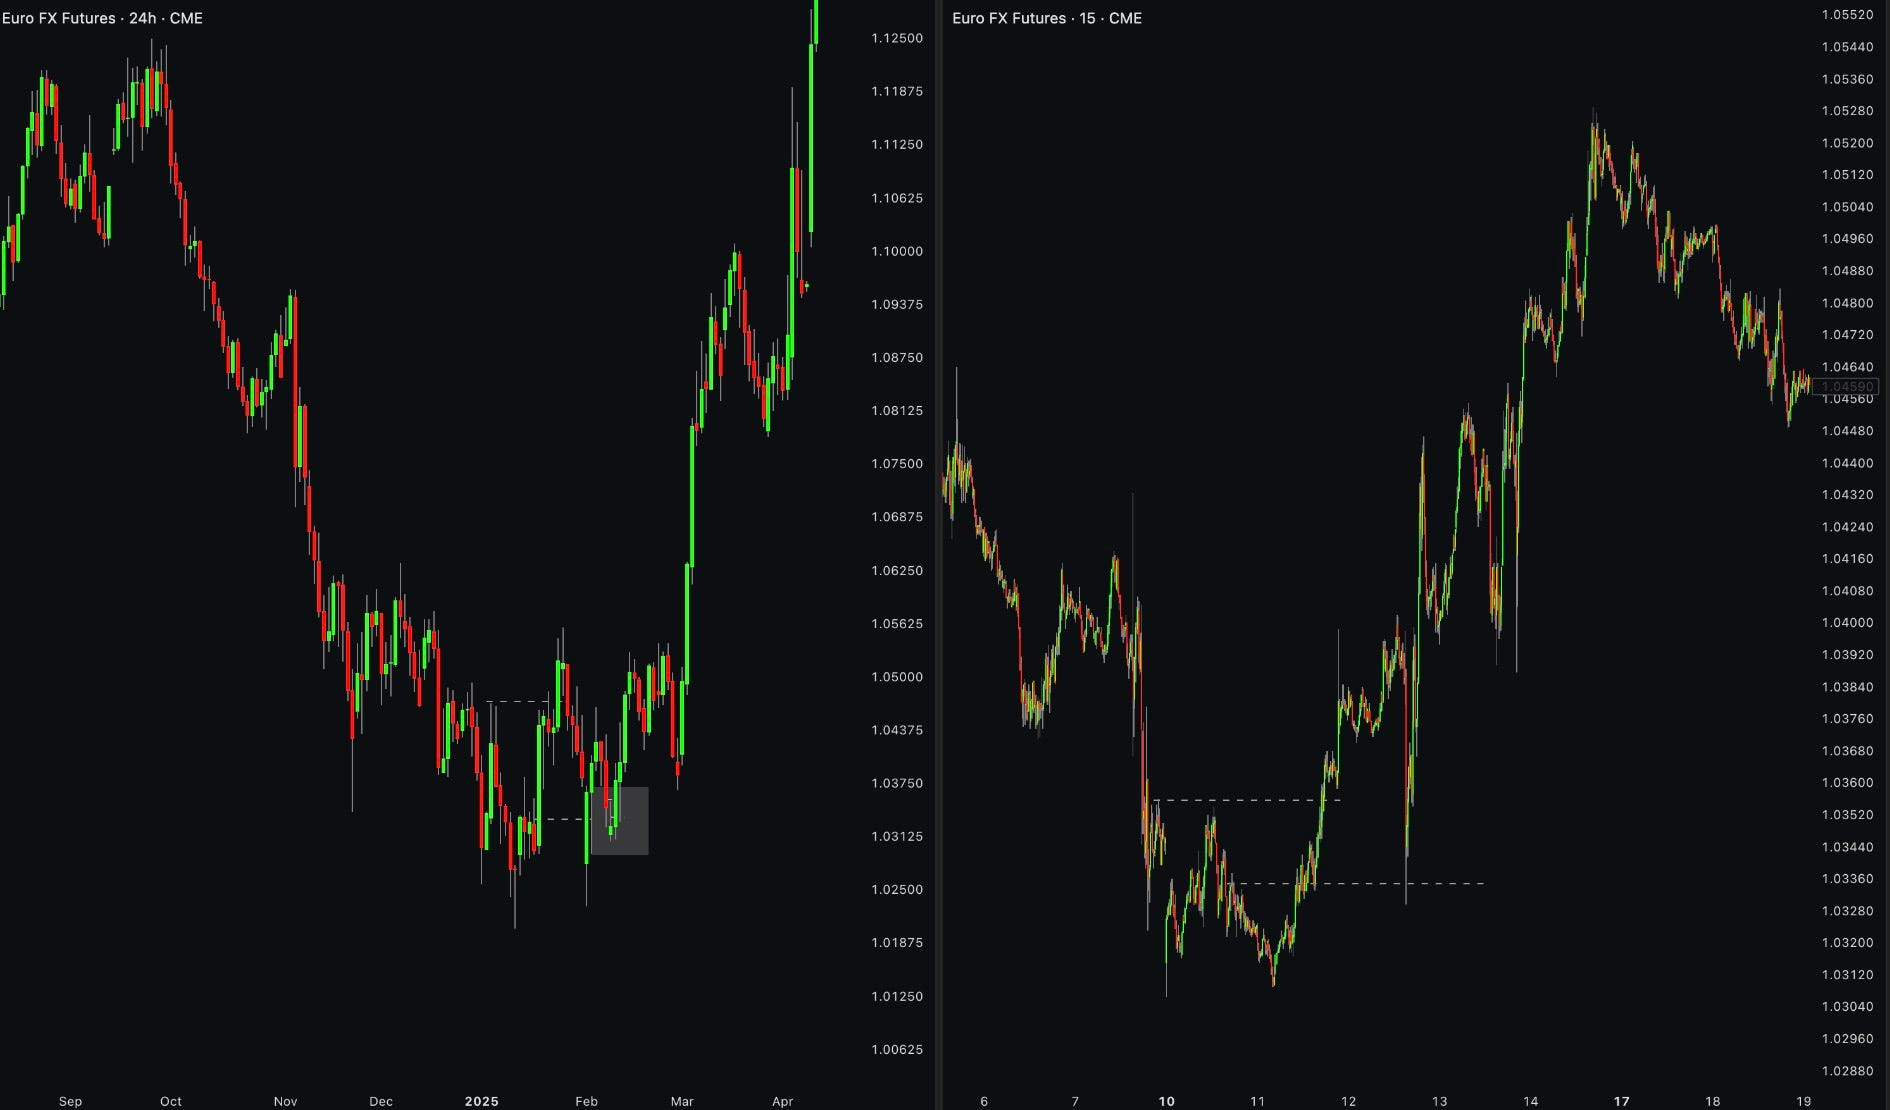
You can see on the chart above that on the left there is a daily chart of euro futures; the price went down, and then it made a higher high; thereafter, it retraced to the origin of the move and rallied higher. This whole thing took about 1-2 months on a daily timeframe. On the right side, the same thing happened on the 15-minute chart within this bigger price move over the span of just a few days.
This is why timeframe selection doesn’t really matter; there really is no difference between hourly and 45-minute charts, apart from thefact that the 45-minute chart will be more granular.
The main reason to stick to popular timeframes like daily, weekly, 4-hour, or 5-minute is that everyone is already using them so they trigger crowding reactions.
Support and resistance
Probably the simplest and most popular price action concept. You can probably teach a 5-year-old to find these; all you have to do is look left and look at prior areas where price has bounced from. Once these are broken, they are often tested from opposite sides, so support turns into resistance and resistance into support.
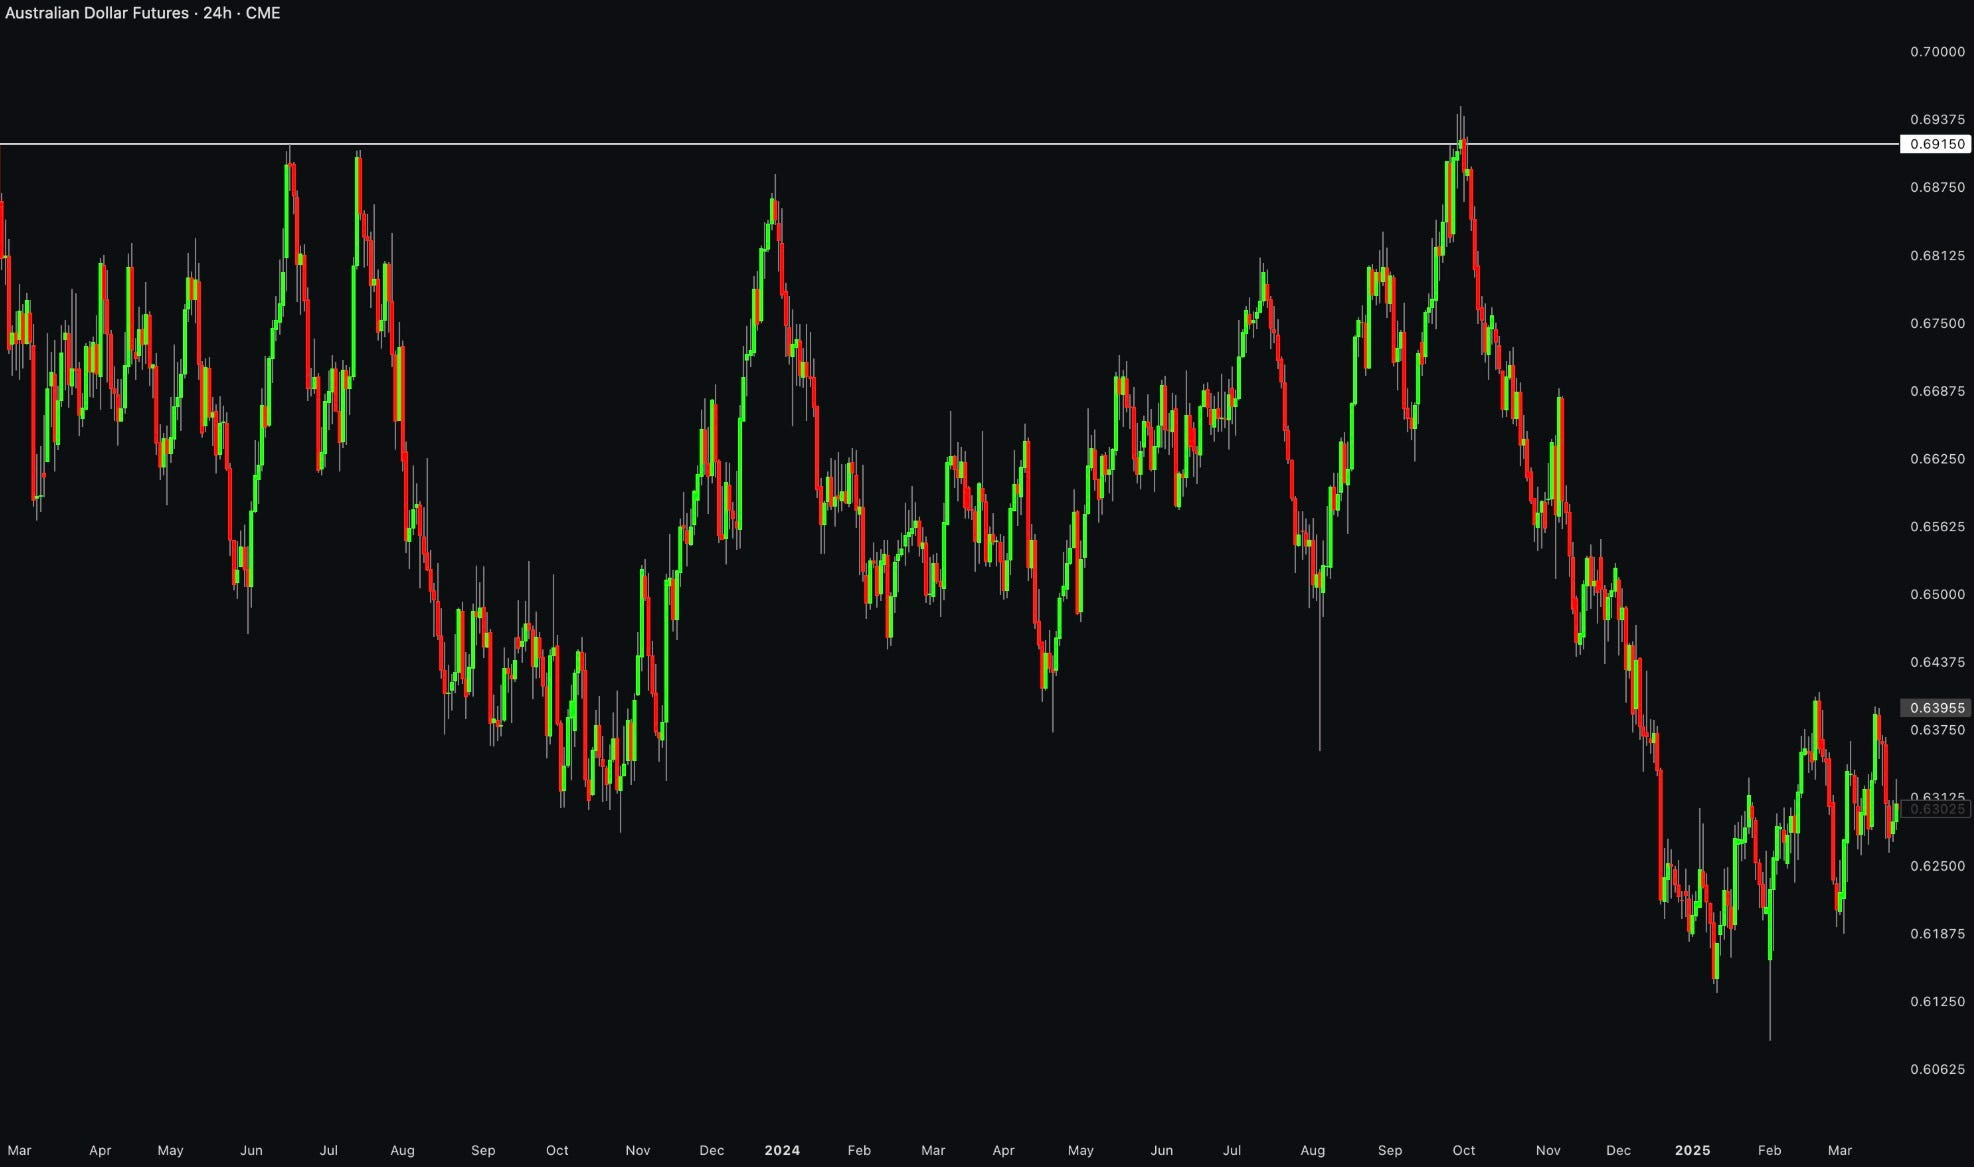
These work because of herding; people see these levels and want to participate around them. Every level has a certain amount of resting liquidity: limit orders from people who want to buy support or sell resistance. Each test fills some of those orders. Each test leaves fewer of them. Eventually aggressive traders on the other side don’t have much to push through, and the level breaks.
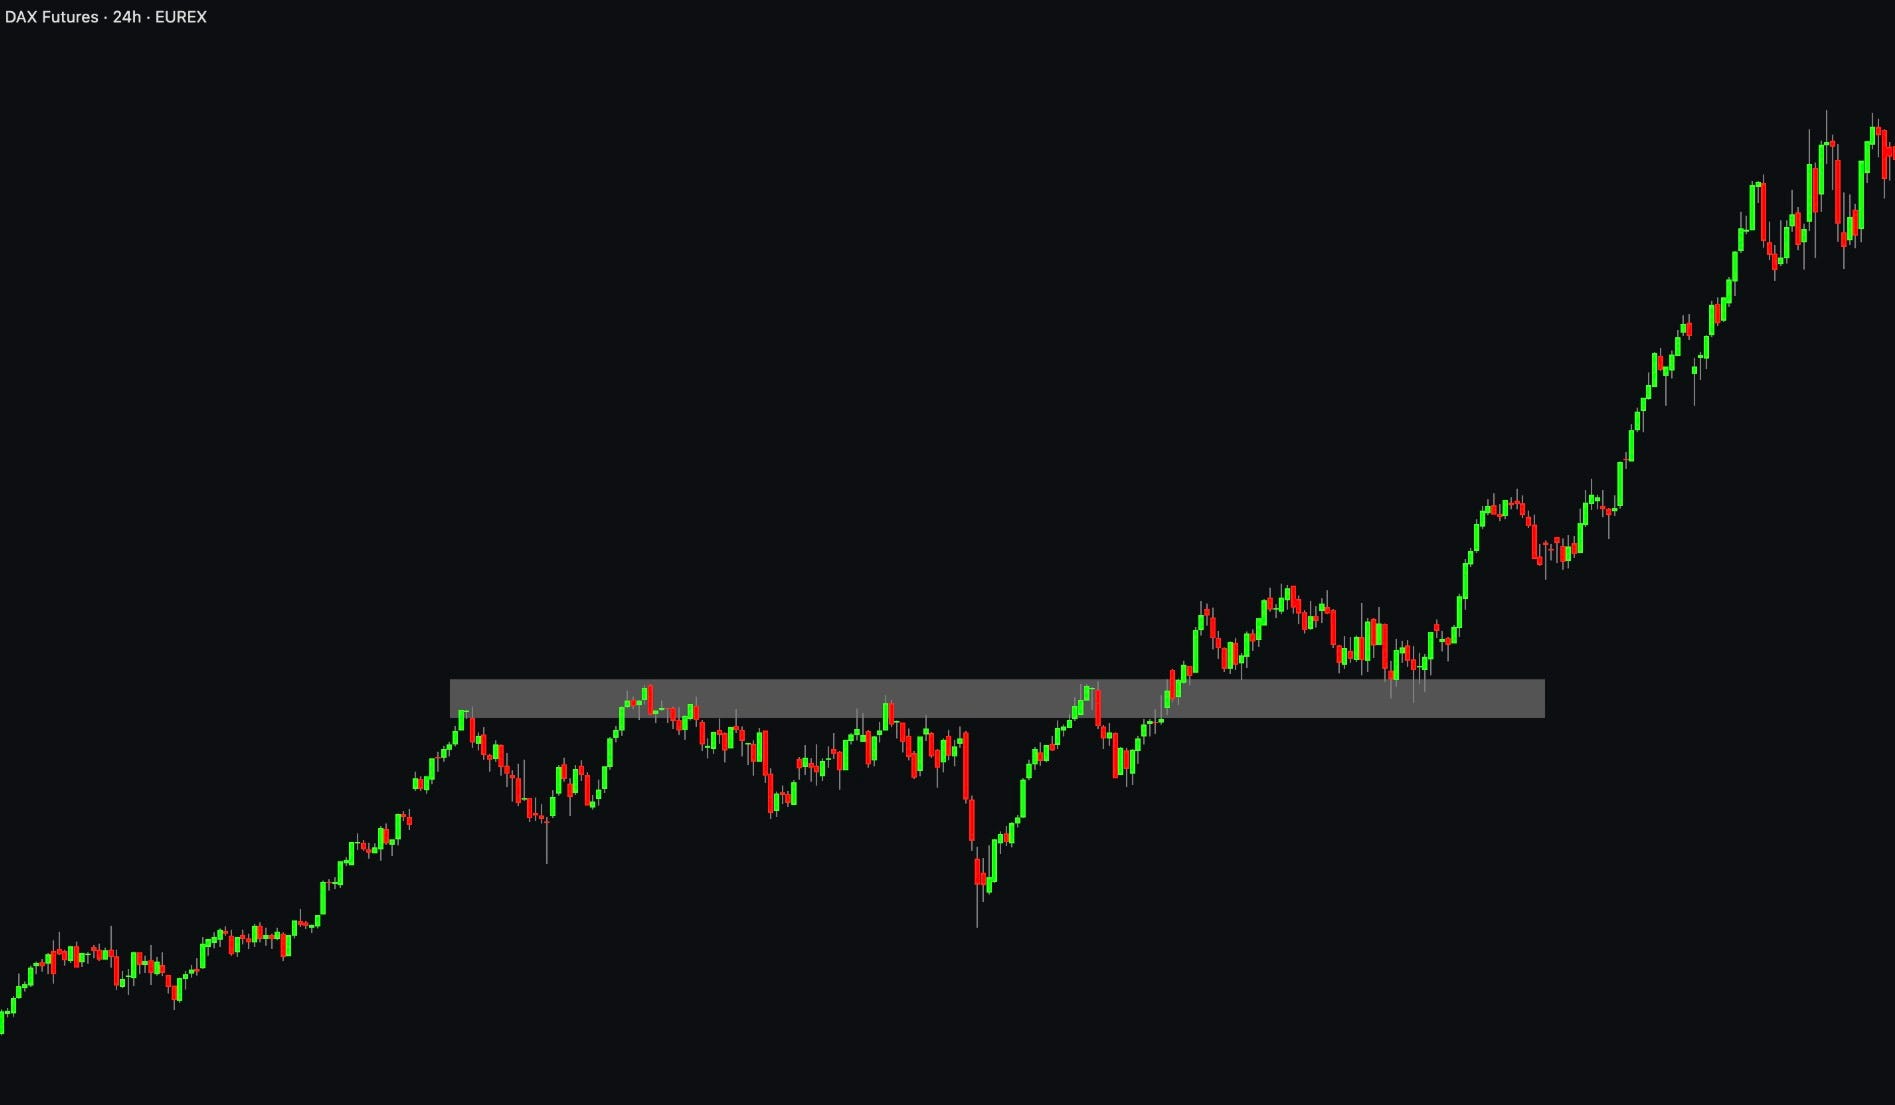
There are two ways to trade a level. I, you, and the trade support tested as support and resistance as resistance. Liquidity pools sit just beyond the level: stops and breakout orders. You can either wait for confirmation of the price reacting at the level, and if you see support being supported, you can jump in; a more brave approach would be placing your limit order blindly at the prior support and resistance levels.
While this will often present a better risk-to-reward ratio, the support might break completely or have a really deep swing into the level, which can easily shake you out before the move happens.
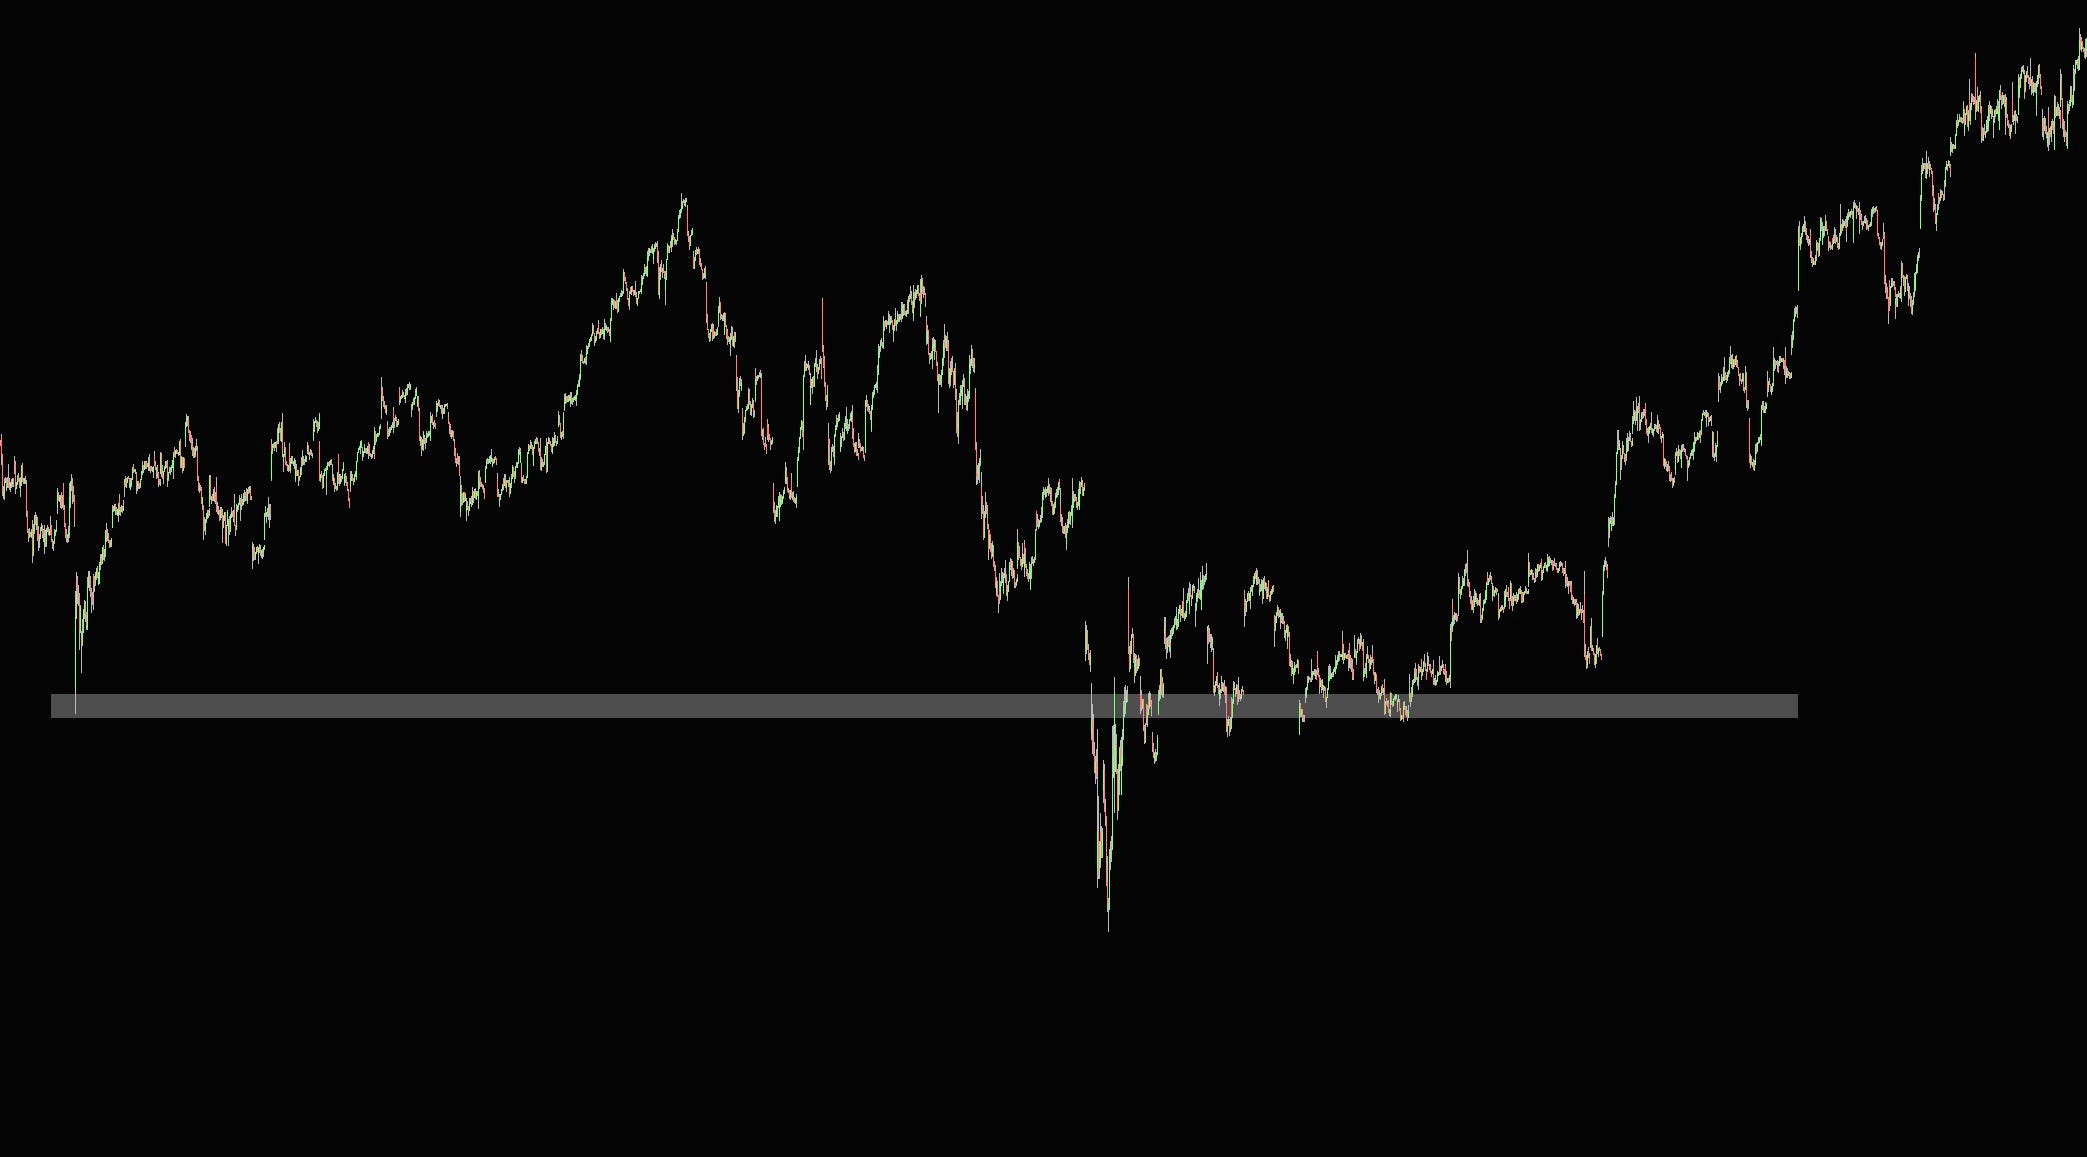
There is a pretty common misconception that the more time level is tested, the stronger it is; this is false since each test consumes residual liquidity and levels become weaker. Because of that, if you want to play a hero and buy these blindly, you should only do it on the first test of prior support or resistance level since the probability of holding is higher.
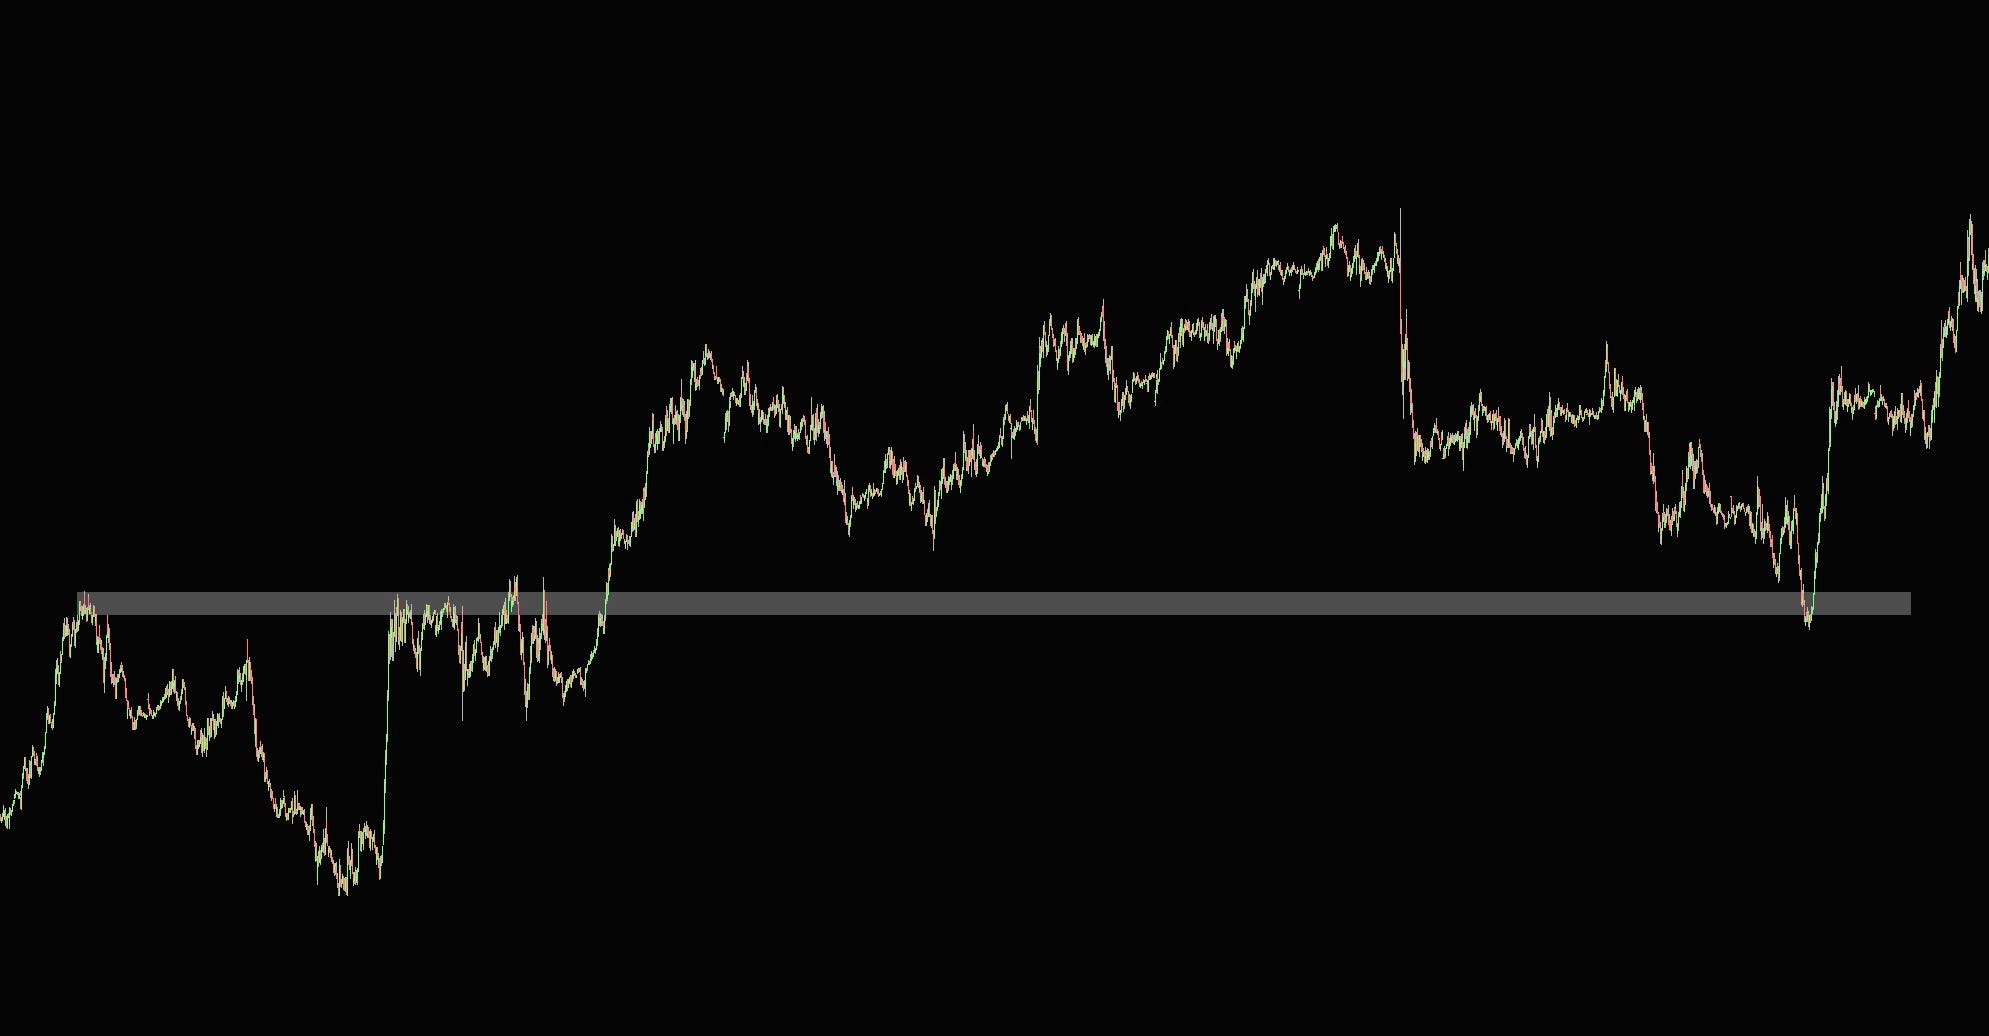
If you trade broken resistance retested as support, broken support retested as resistance. Again, untested levels will be the best, and choosing an exact place to place your limit will overlap with some supply and demand trading principles, which we will cover later.
Why false breaks happen
When resistance breaks, breakout traders buy with market orders. Shorts that were sitting at the level get stopped out, which is also market buying. That’s a wall of aggressive buying.
If you’re a large trader who wants to sell size. You can’t just hit the bid wherever you like. You’d move the price against yourself. You need someone to sell to. That burst of aggressive buying above resistance is the best liquidity you’ll see all day. So you fill your sell orders into it, passively, with limit orders.
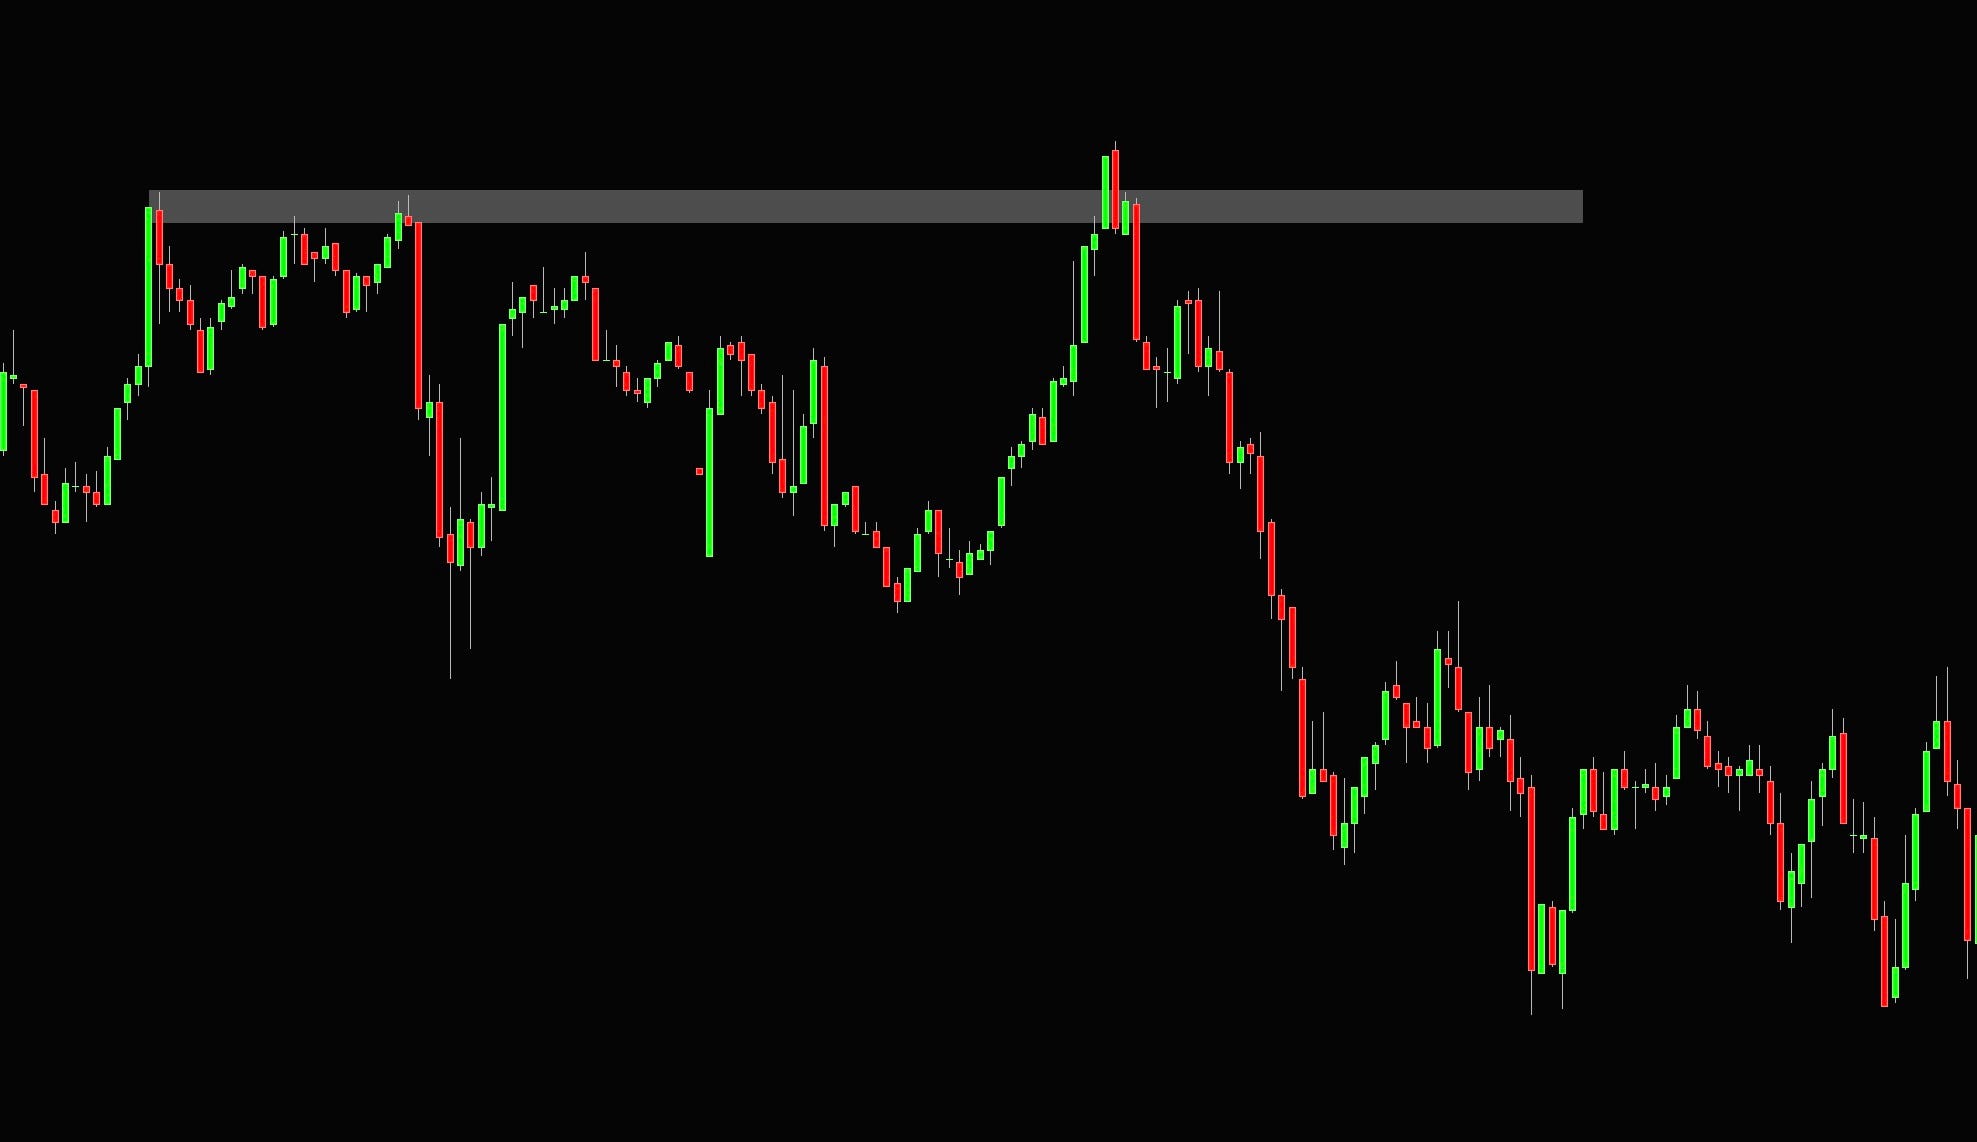
The breakout runs out of buyers. There’s no follow-through. Everyone who bought is underwater, and when they exit, that’s more selling. Price drops back through the level. This happens in every market on every timeframe.
People love to dress this up as evil market makers hunting your stops. It’s not. Market makers make markets. They quote both sides, try to stay delta neutral, and earn the spread.
Markets do get manipulated, but nobody at a bank is running the 1-minute EURUSD chart to take out your 10 pips. Clustered orders at obvious levels are basic human behavior, and large orders need liquidity to get filled.
Liquidity pools
These areas that draw a lot of participation are often called liquidity pools; you will find them not only at support and resistance levels but also prior day/week/month highs, double tops and bottoms, clean swing points, and other areas that naturally stand out on the chart.
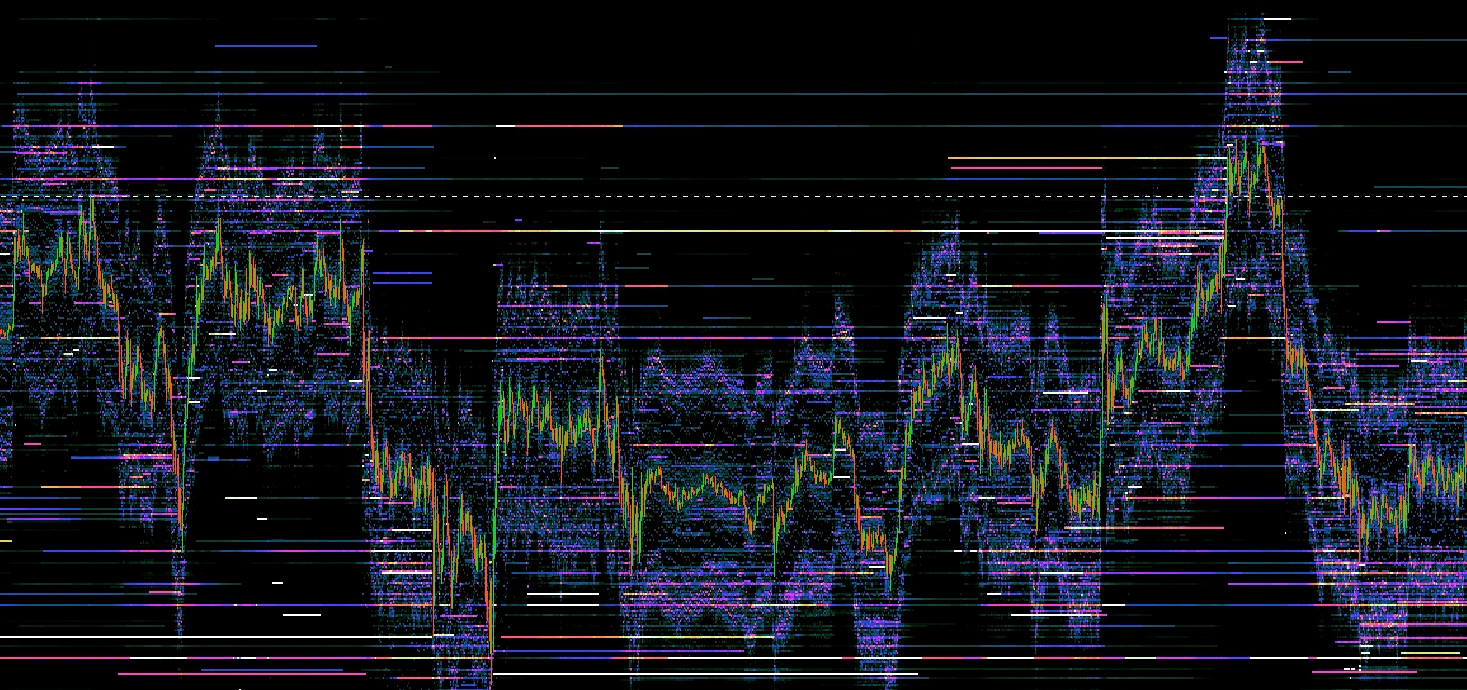
The chart above is slightly messy, but it shows a resting liquidity in the form of limit orders. If you look to the left, the dashed white chart represents the prior resistance areas; as the market overshoots above it, it hits a wall of limit orders (yellow line), which allowed many participants to fill the sell orders and price sold off.
We can also explain this from the opposite standpoint.
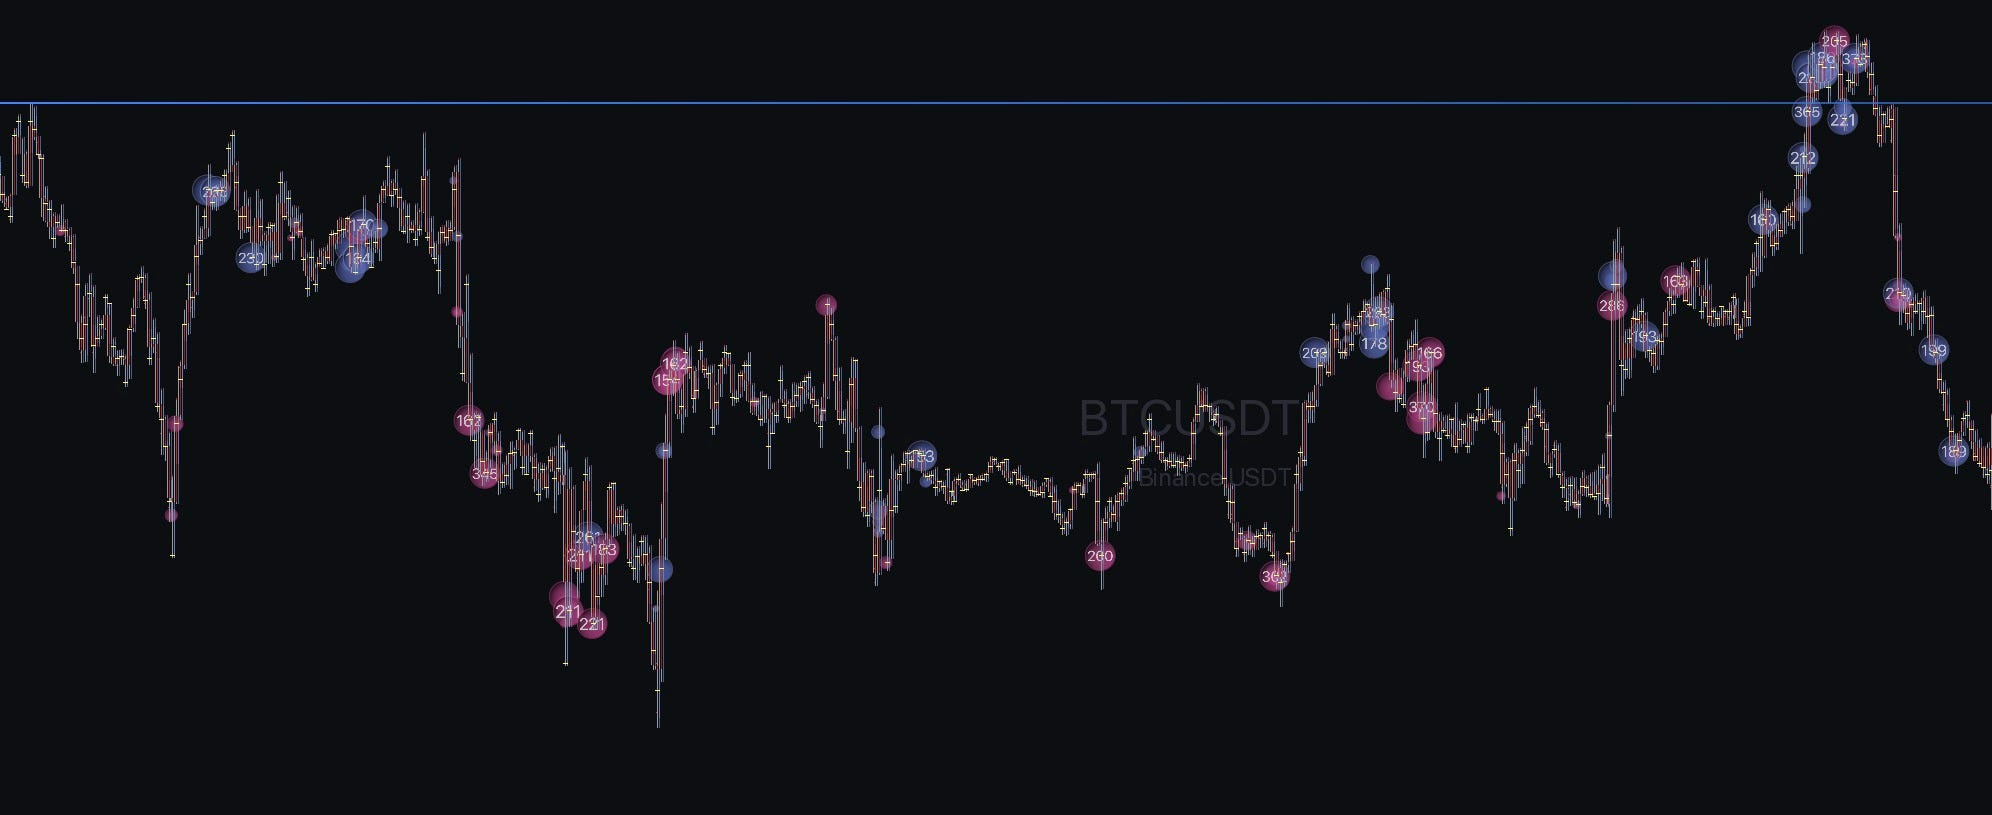
This chart does not show a pending limit order, but the bubbles represent market buy orders. You can notice that there is a lot of buying represented in blue bubbles as the price tries to break the resistance. Why isn’t it going higher when there is so much buying? Because there is someone sitting on the opposite side getting their sell orders filled with size.
These are often called SFPs (swing failure patterns), false breaks, or excess. While you can trade them using only the price action chart, orderflow tools help heavily here, and we will look at them after this chapter.
Efficient and inefficient moves
When you start looking at charts, it is good to recognize the type of environment you are in. While conventional wisdom usually separates trends and ranges, I think it is well worth looking at how price behaves.
Efficient moves are two-sided. Buyers and sellers both get filled. On the chart it looks like overlapping candles, a grind with pullbacks, every bar trading back into part of the previous one. Plenty of volume traded at every price along the way.
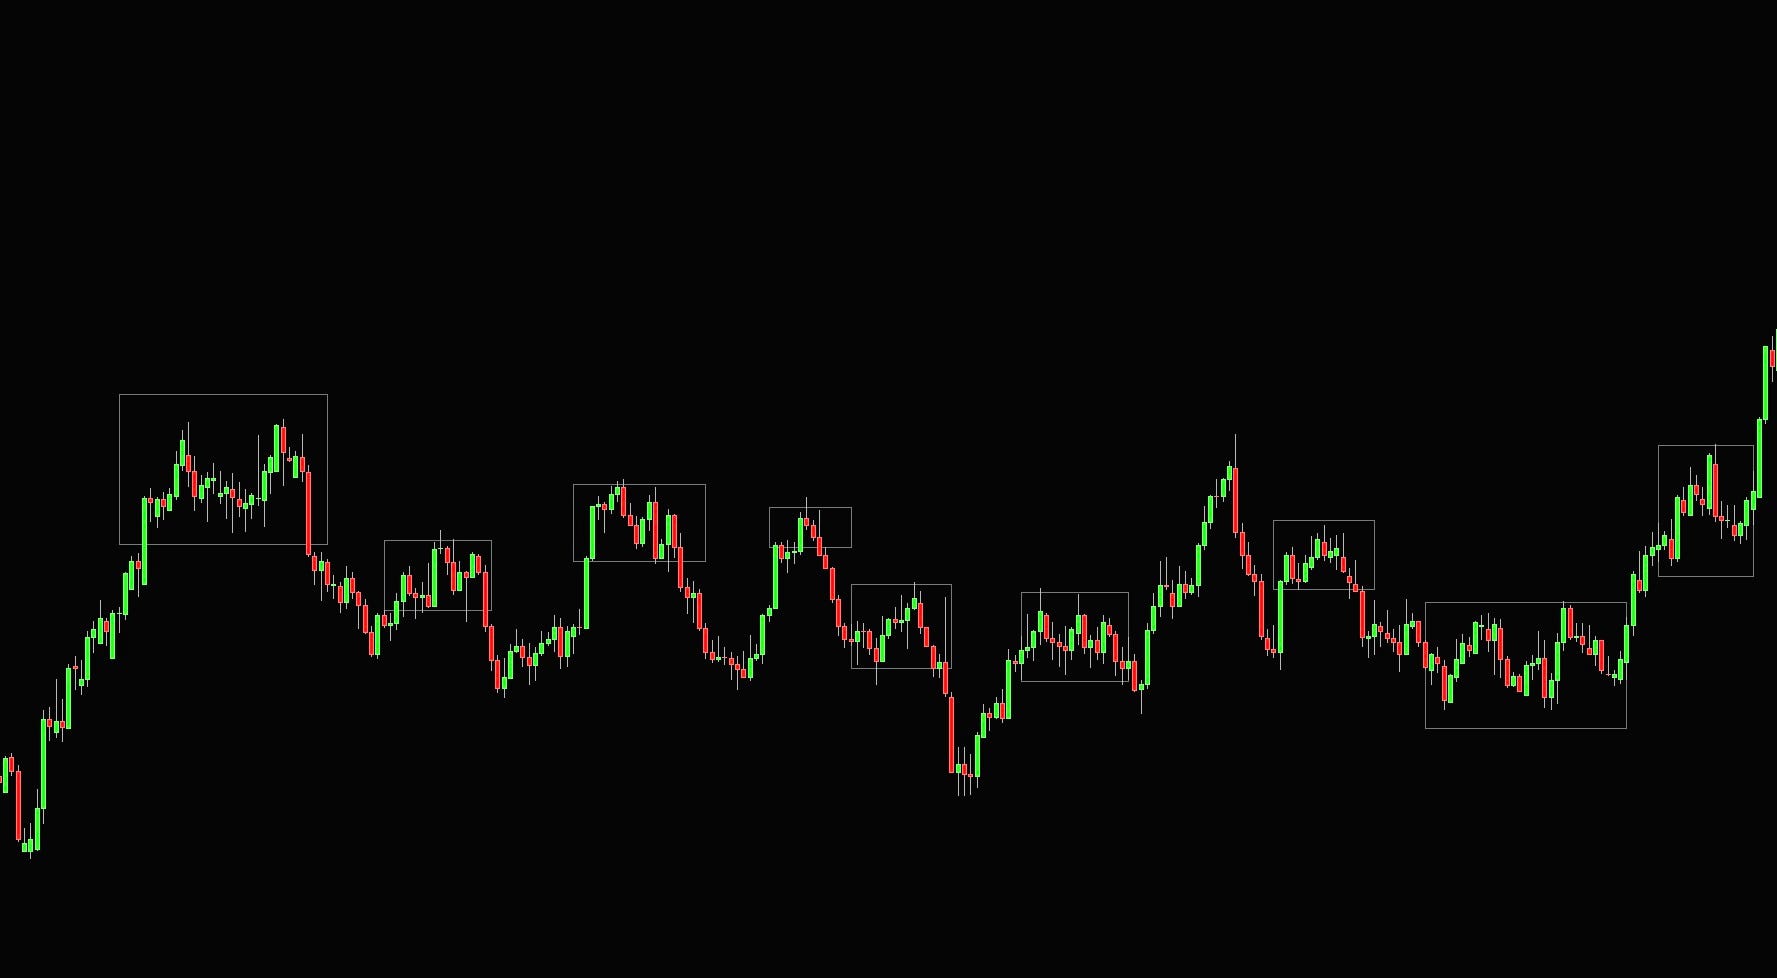
Inefficient moves are one-sided. Someone needed to get filled urgently and lifted every offer in their way. On the chart it looks like big candles stacked on top of each other with very little overlap.
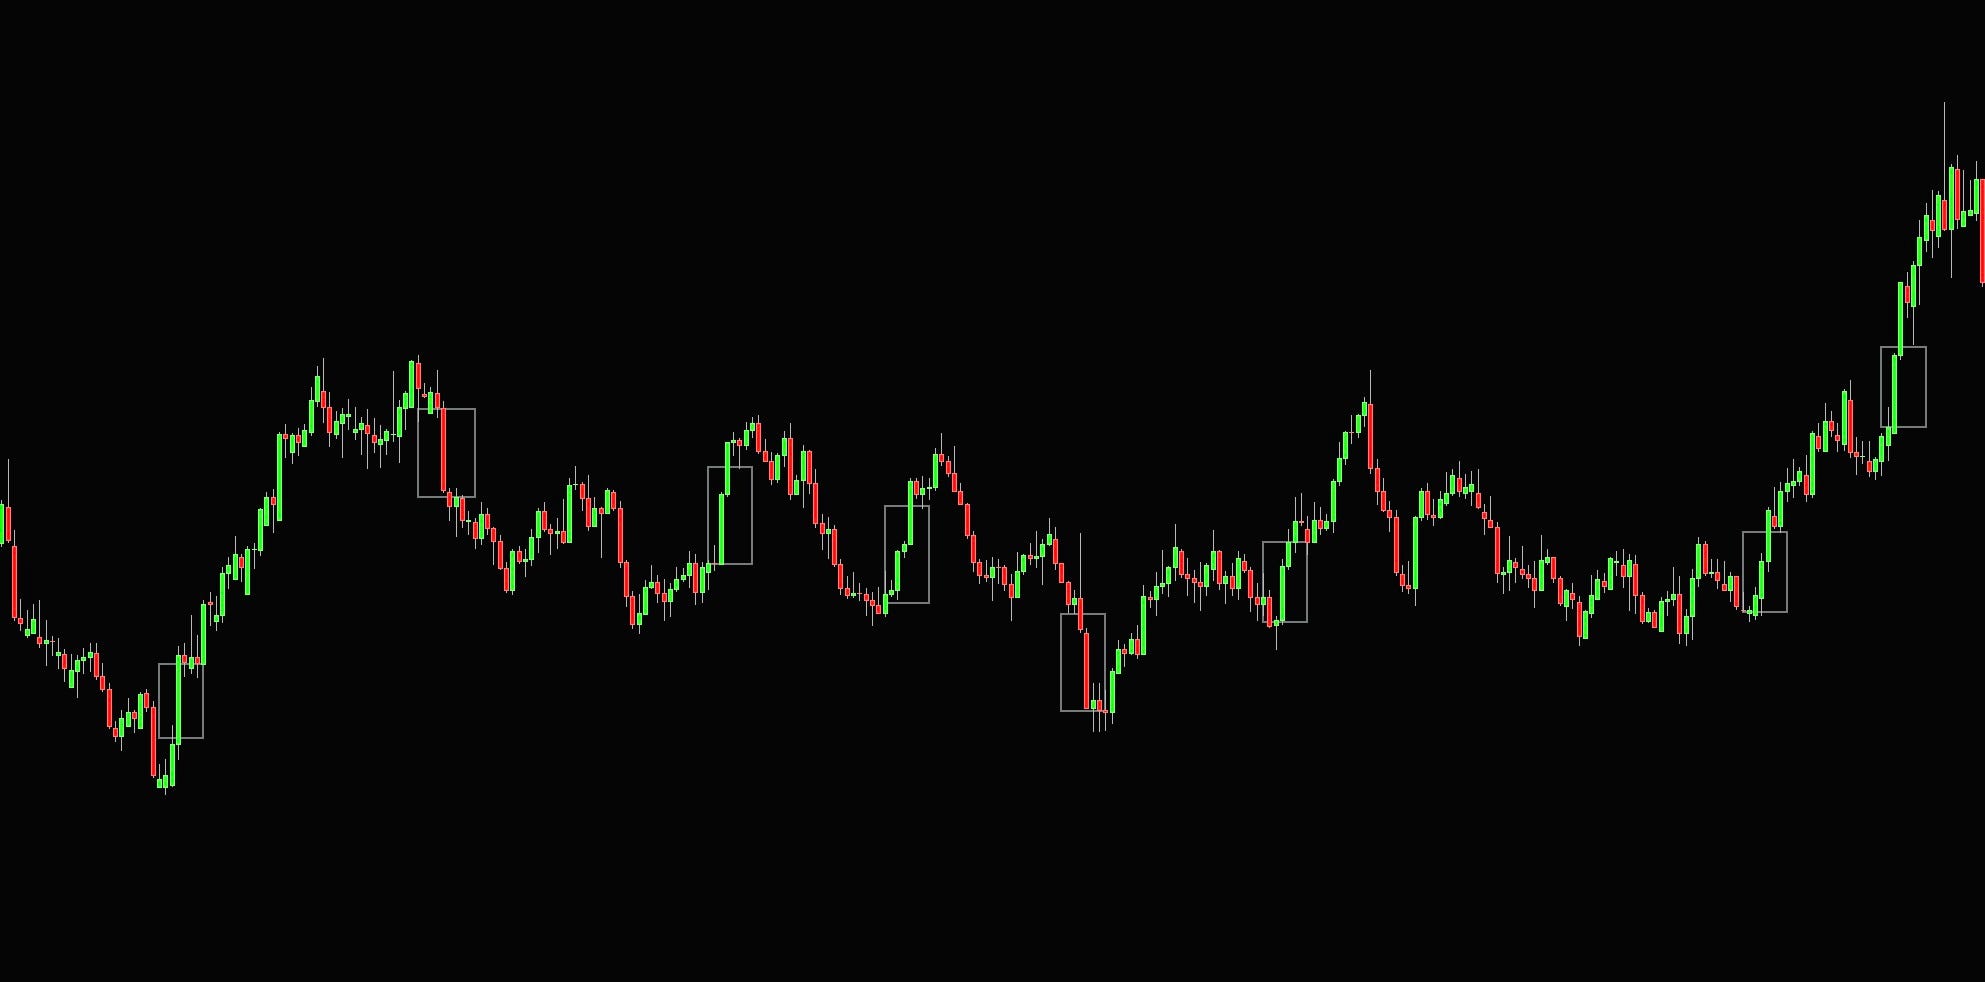
Why do these matter? Because inefficient areas tend to get revisited. The move happened because one side overwhelmed the other, which usually means the large trader behind it didn’t get their full size done.
On the retests, they’re often still there to defend it. And other participants, who missed the move, want in at those prices too. This is covered more in-depth in the market microstructure article.
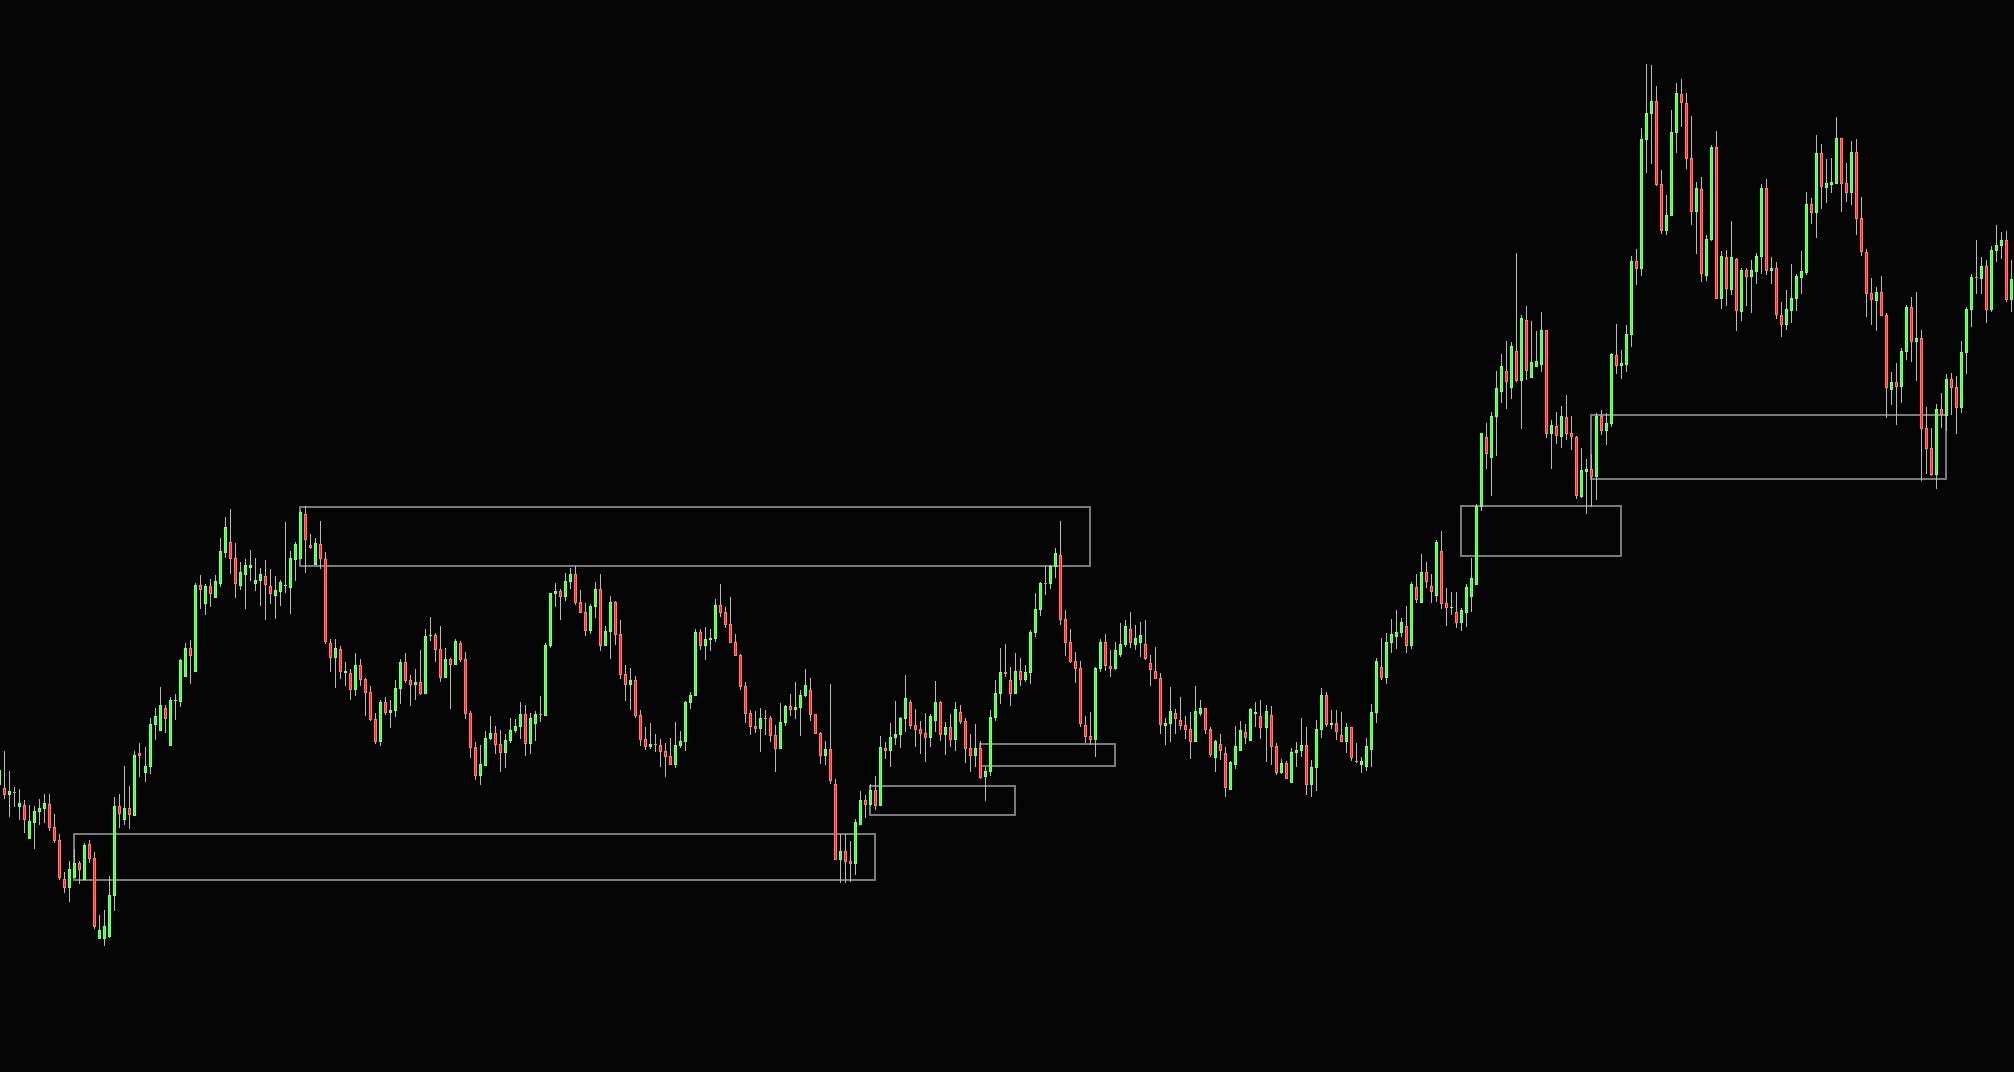
When price moves fast through thin liquidity, the market makers and dealers who got run over are left holding inventory at bad prices. Price tends to get pulled back towards the least liquid side as the market looks for two-way trade again. The market doesn’t like leaving prices that were barely traded for too long.
From liquidity to liquidity
Price can go whatever it wants; the price of any underlying can go to zero tomorrow without really any reason. This is useful to understand because you will otherwise get into this mindset of “price has to do this now.”
While you can’t ever predict what price will do next, if you actively start to look at areas with potential resting liquidity, it can offer your trades with favorable risk-to-reward ratios. Equal highs and lows, clean swing points, the prior day and week extremes, session highs and lows, and retracements of inefficient moves into prior efficient consolidations. Being a good discretionary trader doesn’t mean you have to predict what price will do next; it means you need to be able to spot areas where it is worth for you to participate and do business.
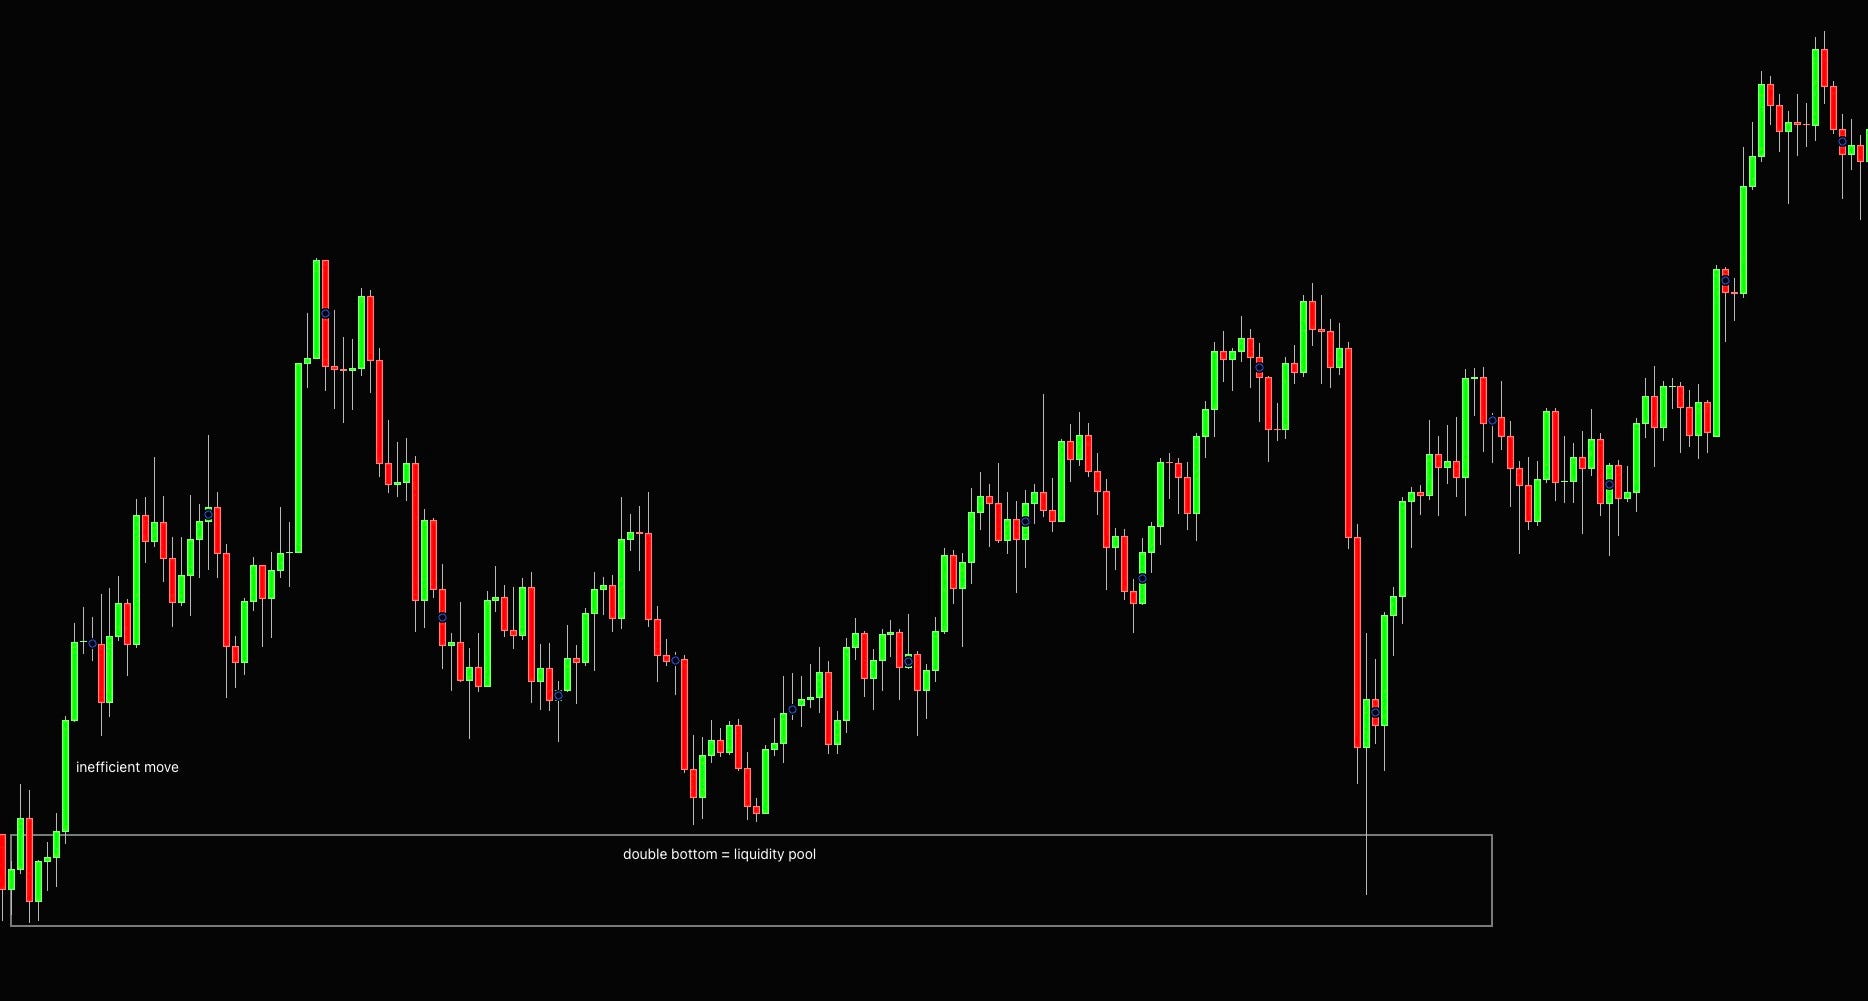
Supply and Demand Clusters
I am sure you have heard about these supply and demand zones, clusters, bases, order blocks, and many other different names these were given over the years.
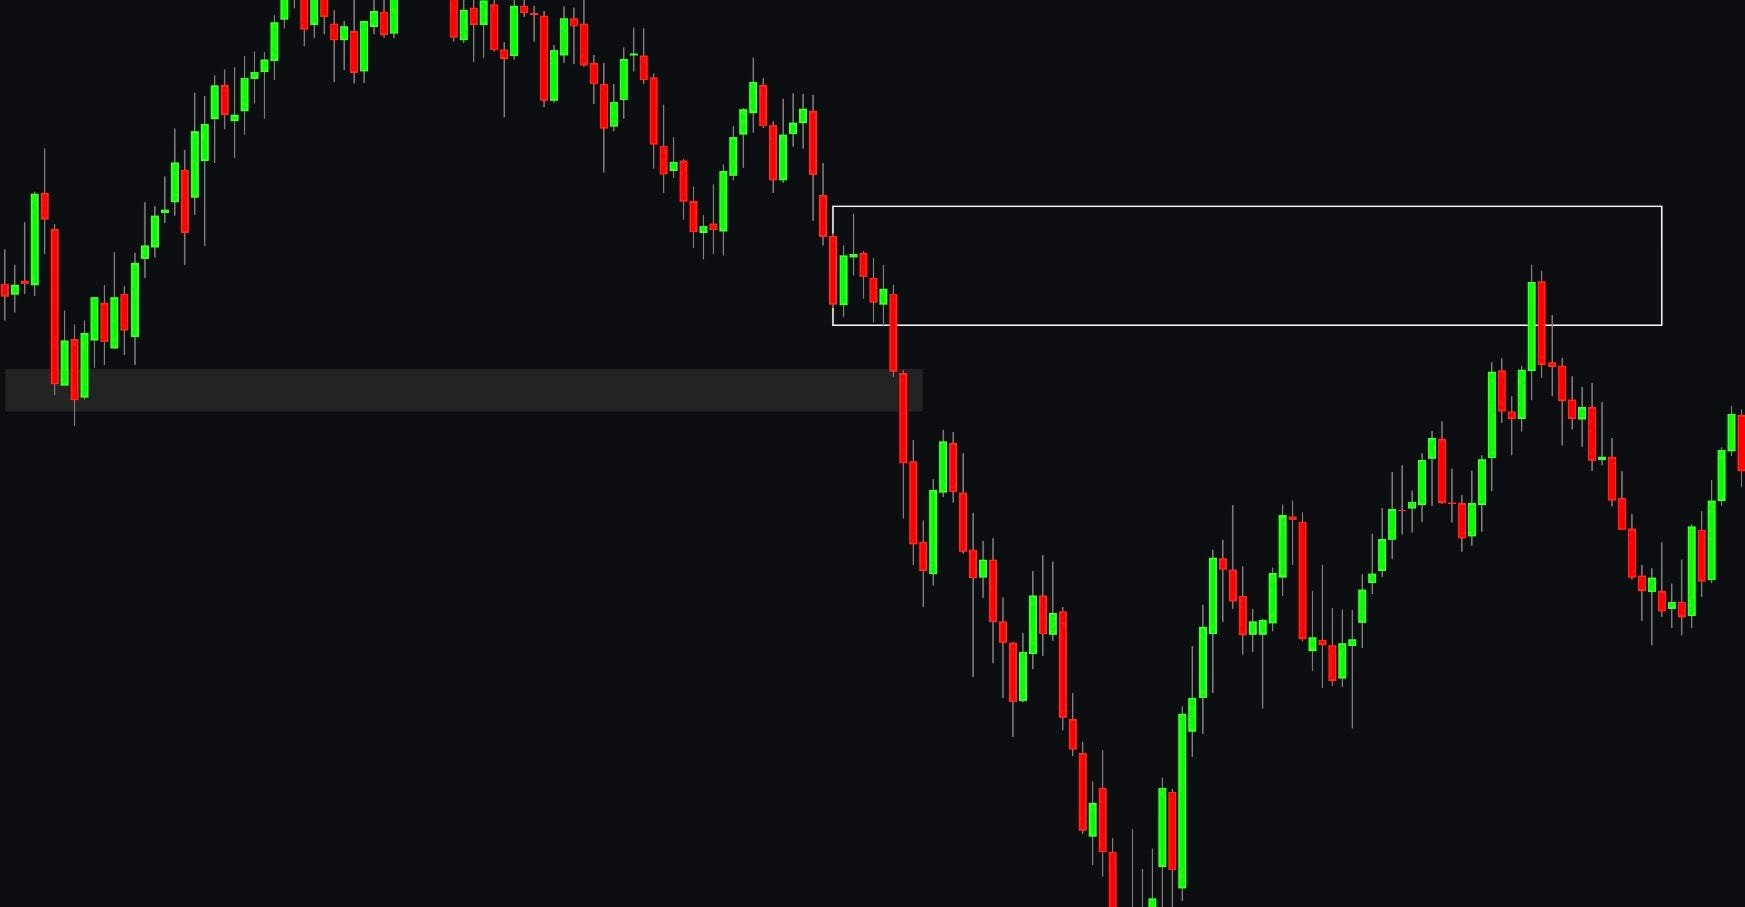
Essentially these are the efficient price ranges before the inefficient move happens. As I mentioned before, these areas of balance allow two-sided trading; thus, large participants can fill their orders there and eventually overwhelm one side. When these areas are revisited, they often have some residual liquidity present to cause reaction; moreover, herding and exit of underwater positions that traded in that consolidation on the wrong side take place.
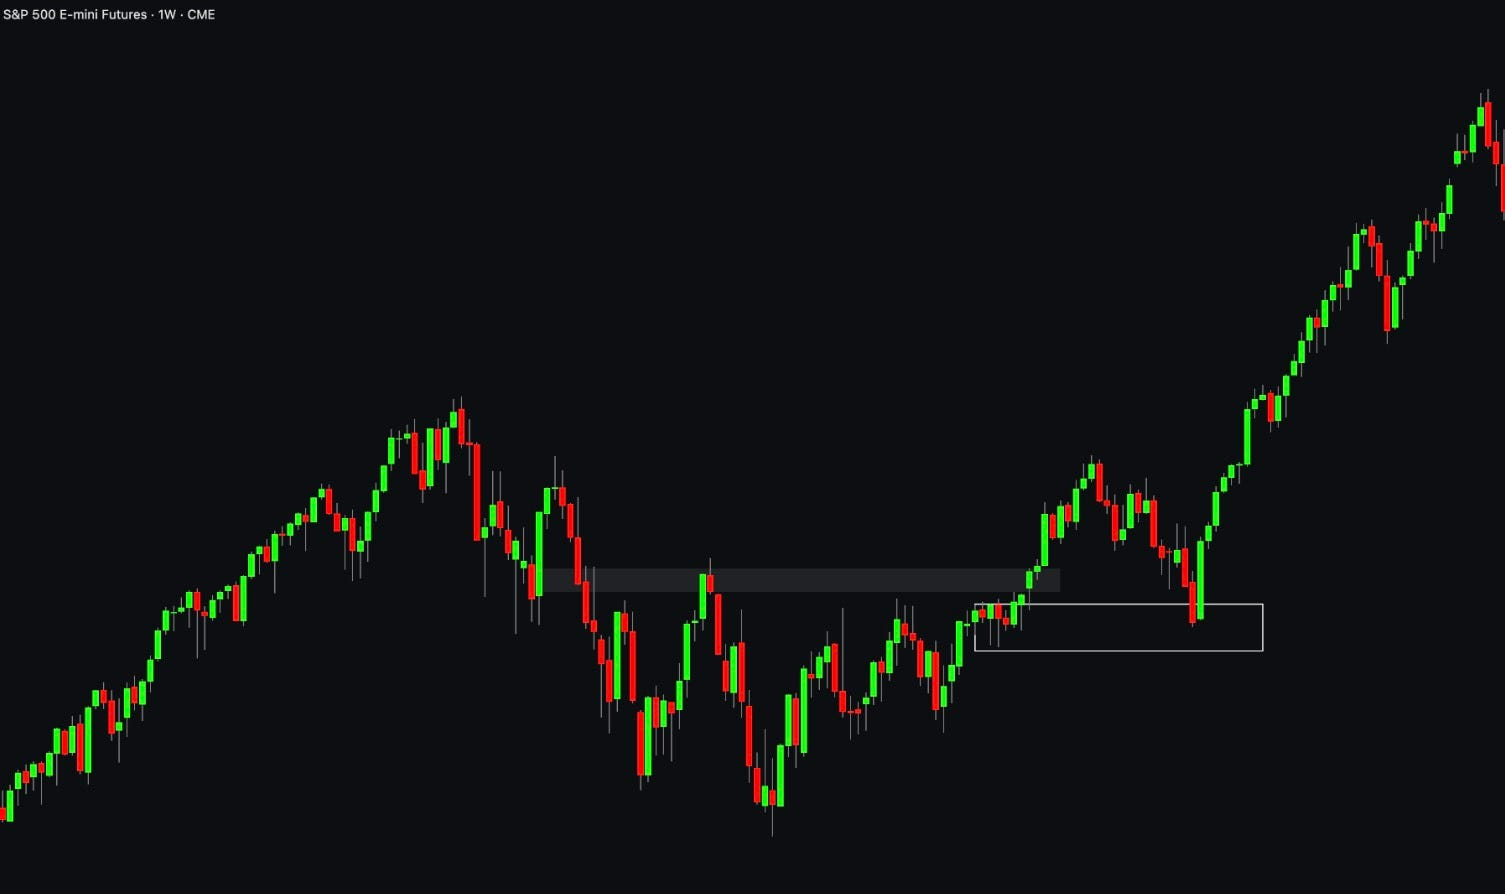
When I look at these, I want the inefficient move to be significant, meaning it should have enough demand to break through the prior level of support or resistance.
Demand zone: consolidation before an inefficient move up that breaks structure (closes above the previous swing high).
Supply zone: consolidation before an inefficient move down that breaks structure.
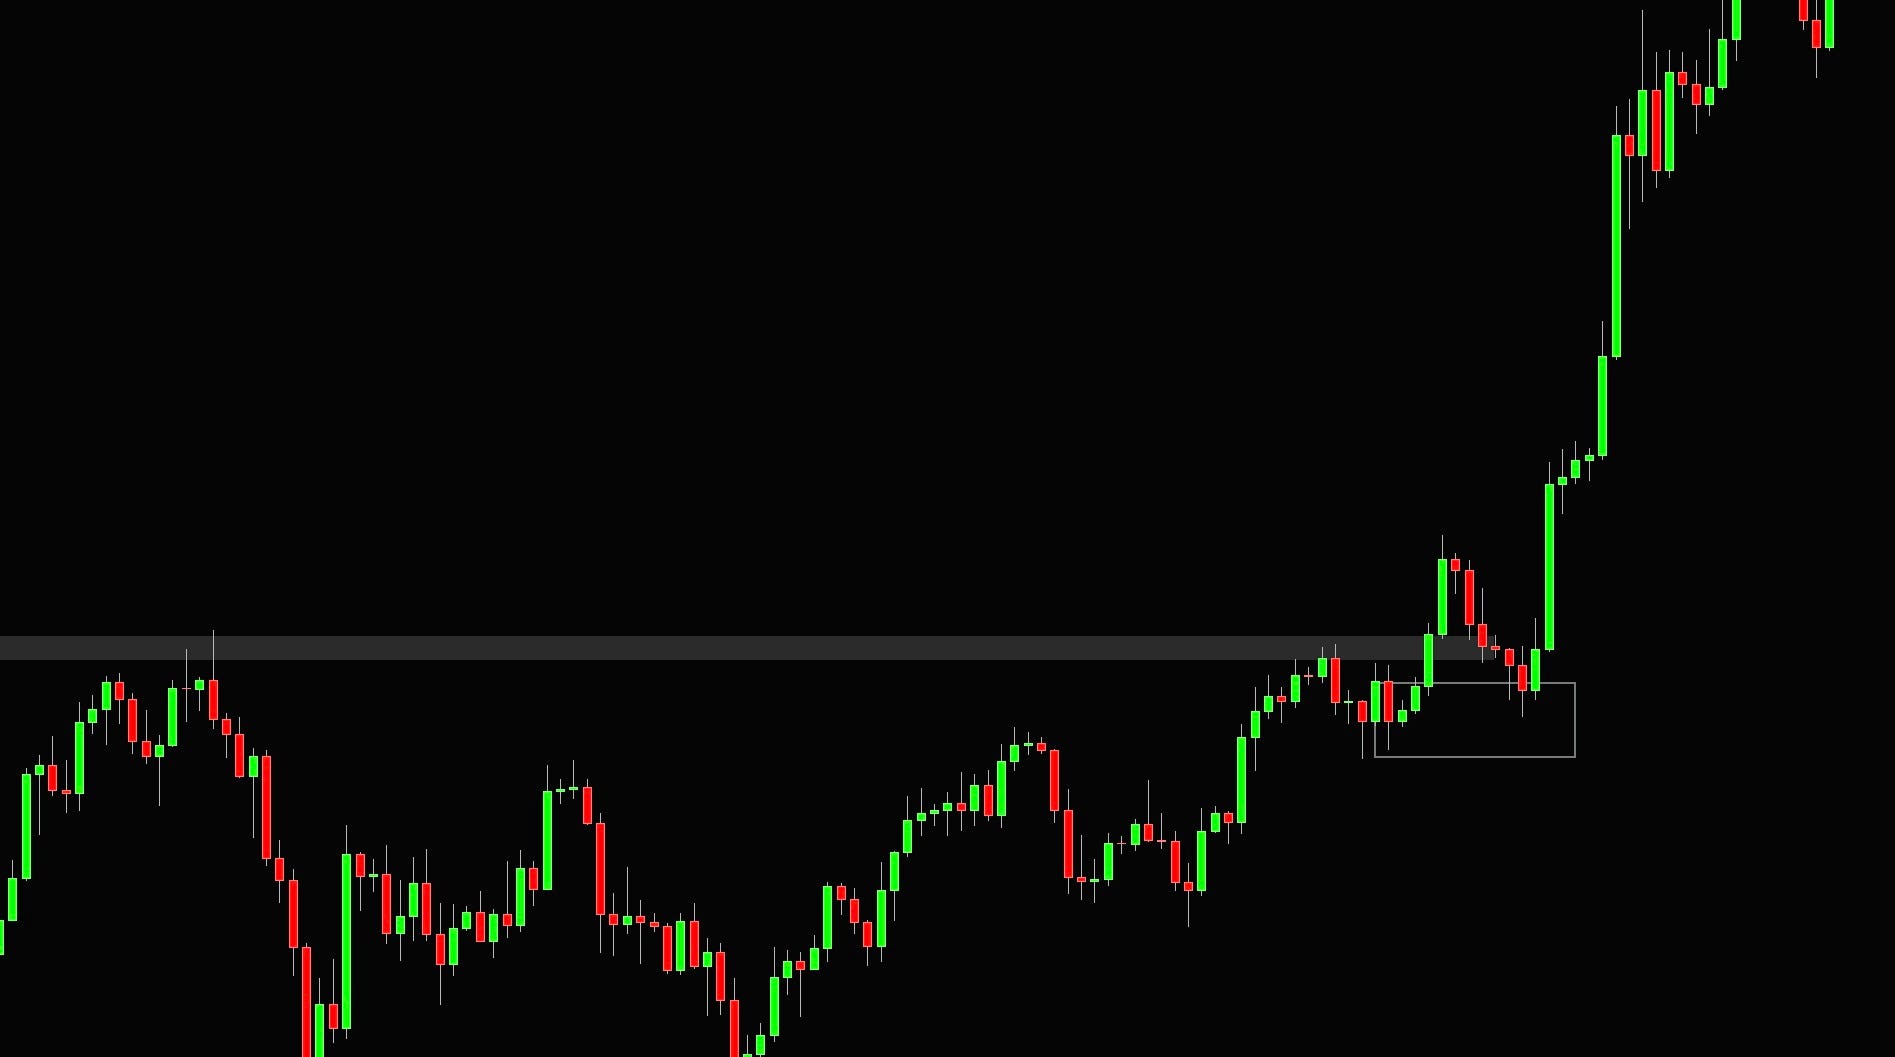
Since the prior consolidations clearly establish the areas of these, you can trade them using limit orders with invalidation on the opposite side. The same as with support and resistance, the liquidity gets consumed with more touches it has, so your first touch is always the best one.
Liquidity gaps
When the move is directionally strong, price tends to revisit the supply and demand clusters any time soon.
What it tends to do instead is hold the inefficient move as support or resistance; this often happens as there is just too much urgency and not much of a counterparty pressure to fight the move.
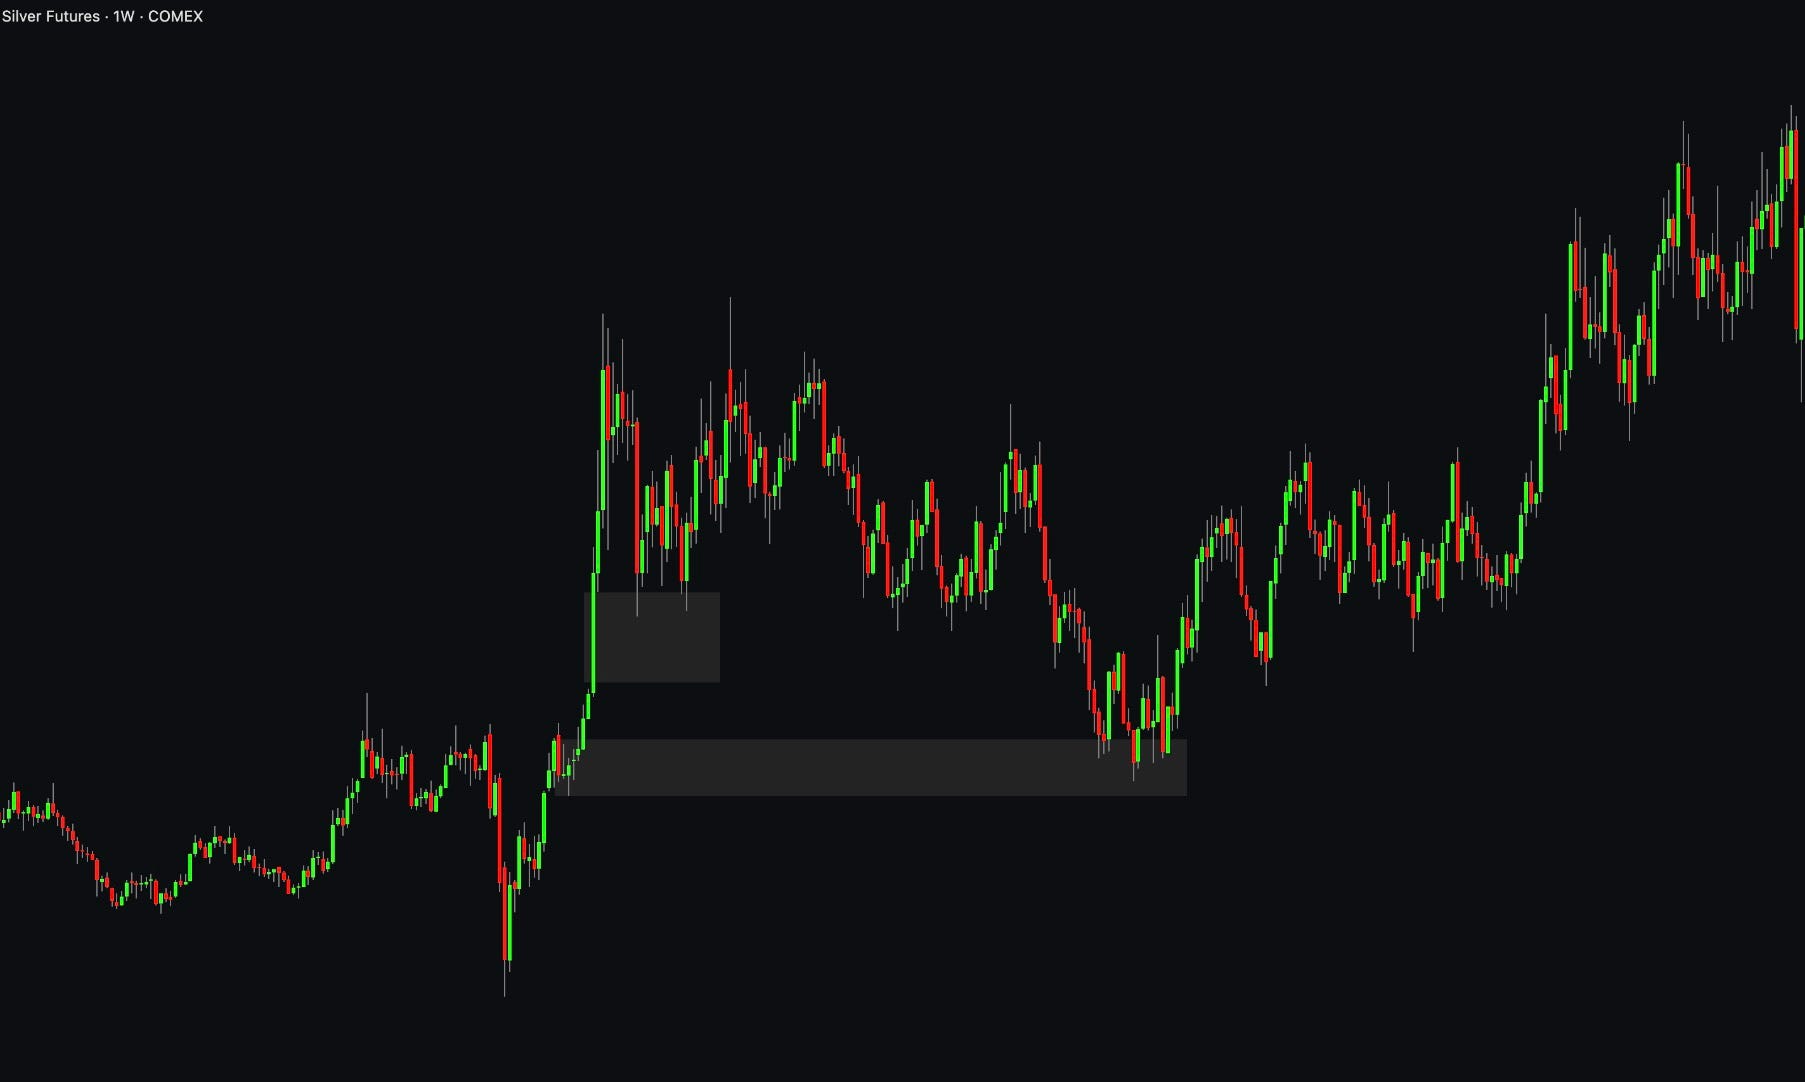
Here you can see that after the initial leg up, the market did not pull back into the demand area but only tested the inefficient candle and acted as support there.
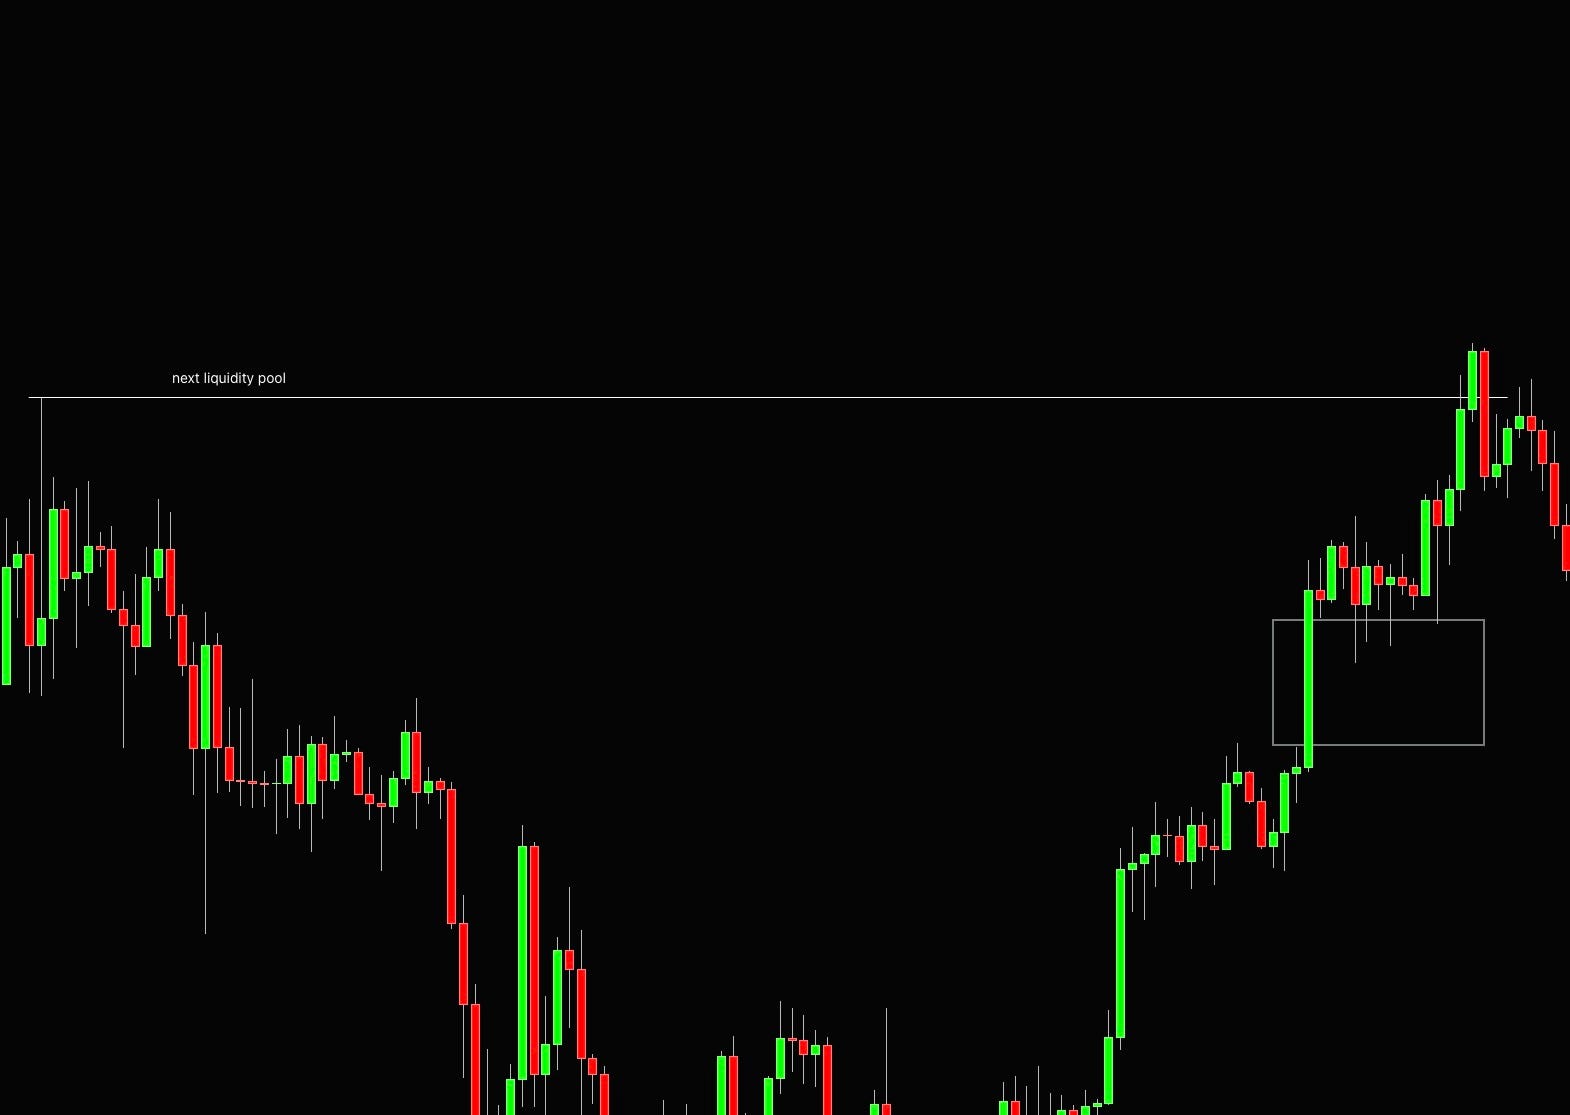
From my personal experience, when you see a large price move, you often won’t get the full retracement into the efficient price zone, as this is something everyone is betting on. Price rather uses the body of a large inefficient move as support/resistance before making the next leg up/down.
Over and Under
Another very common pattern that you will see paying out often is called over and under, sometimes quasiomodo, or maybe a completely different name.
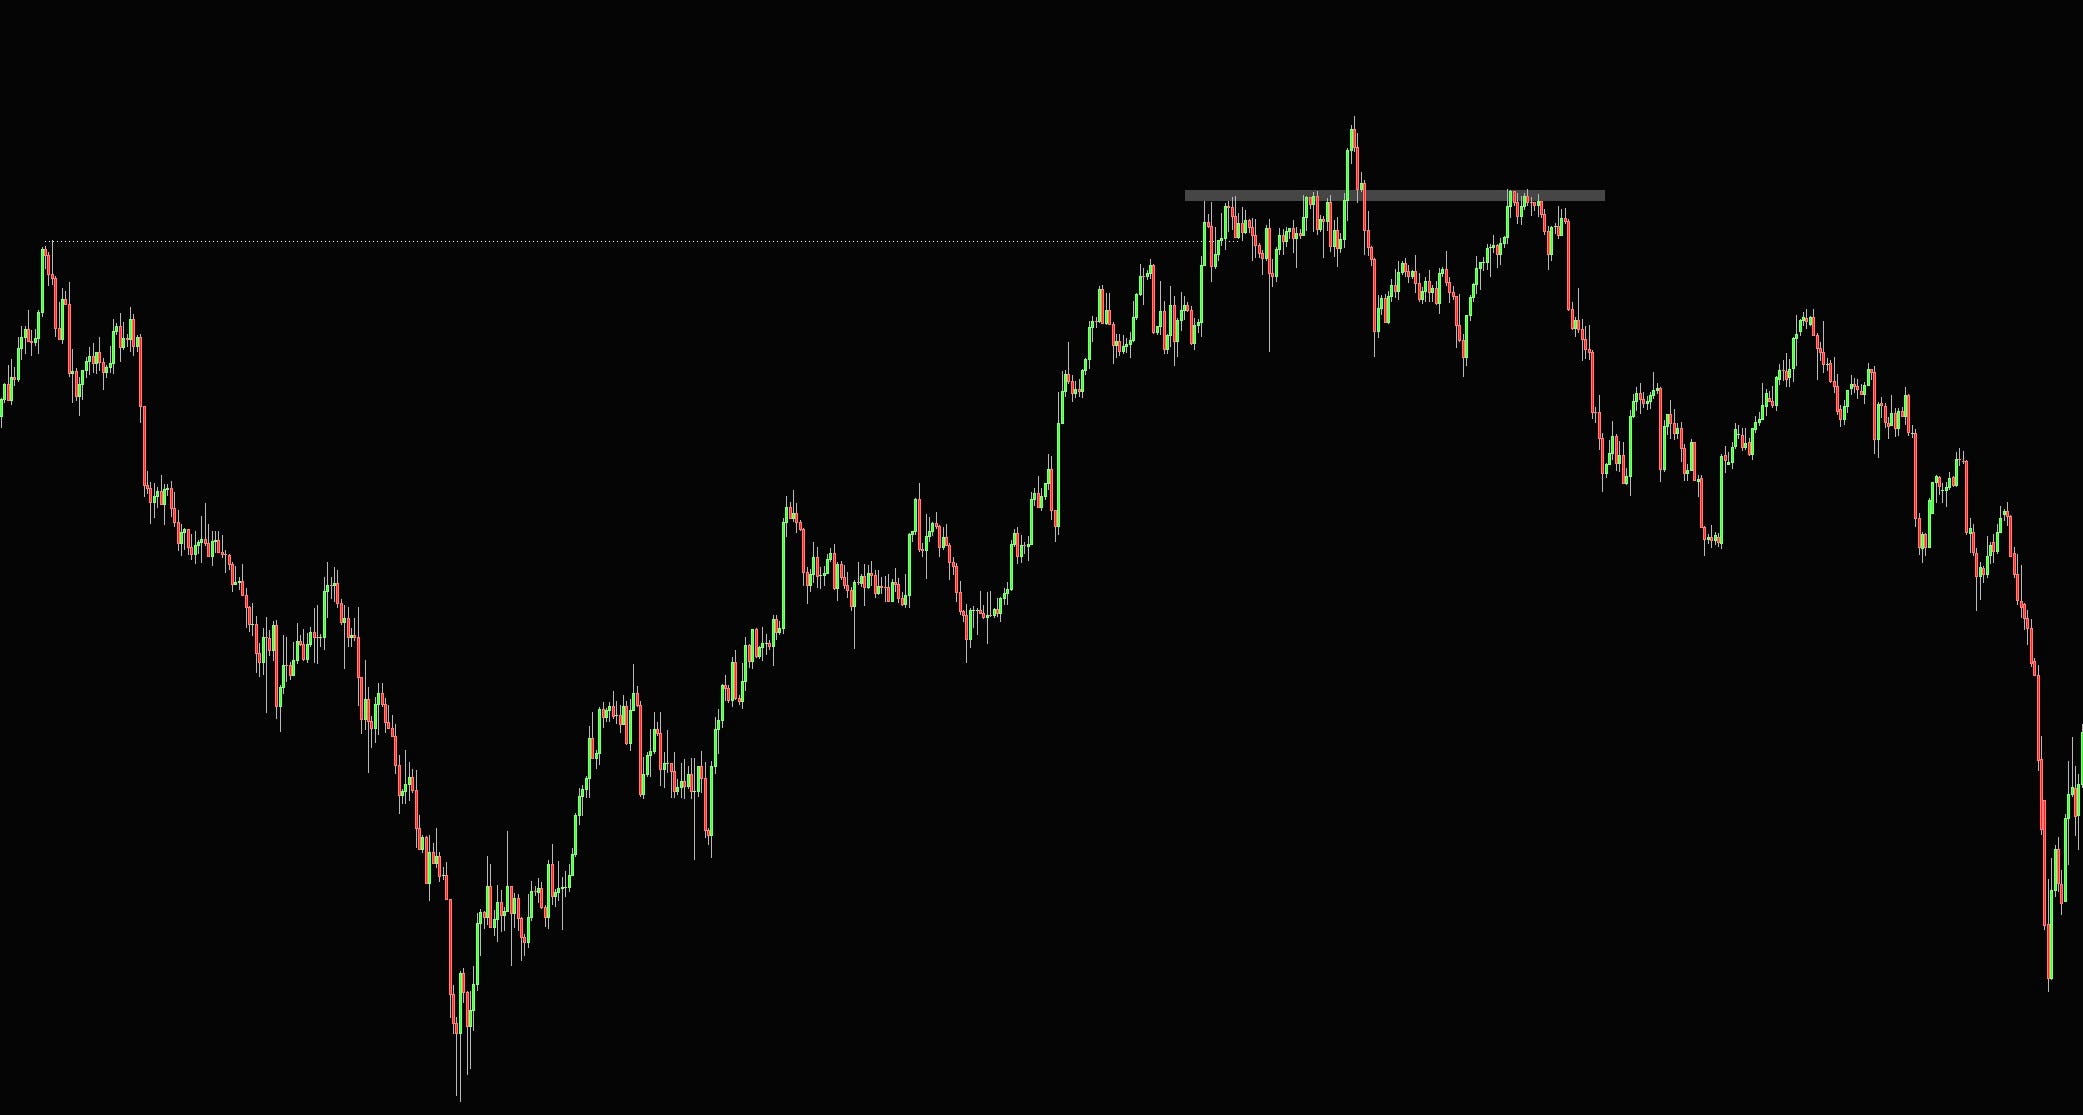
Think of it as a head and shoulders where, instead of waiting for the neckline to break, you trade the right shoulder.
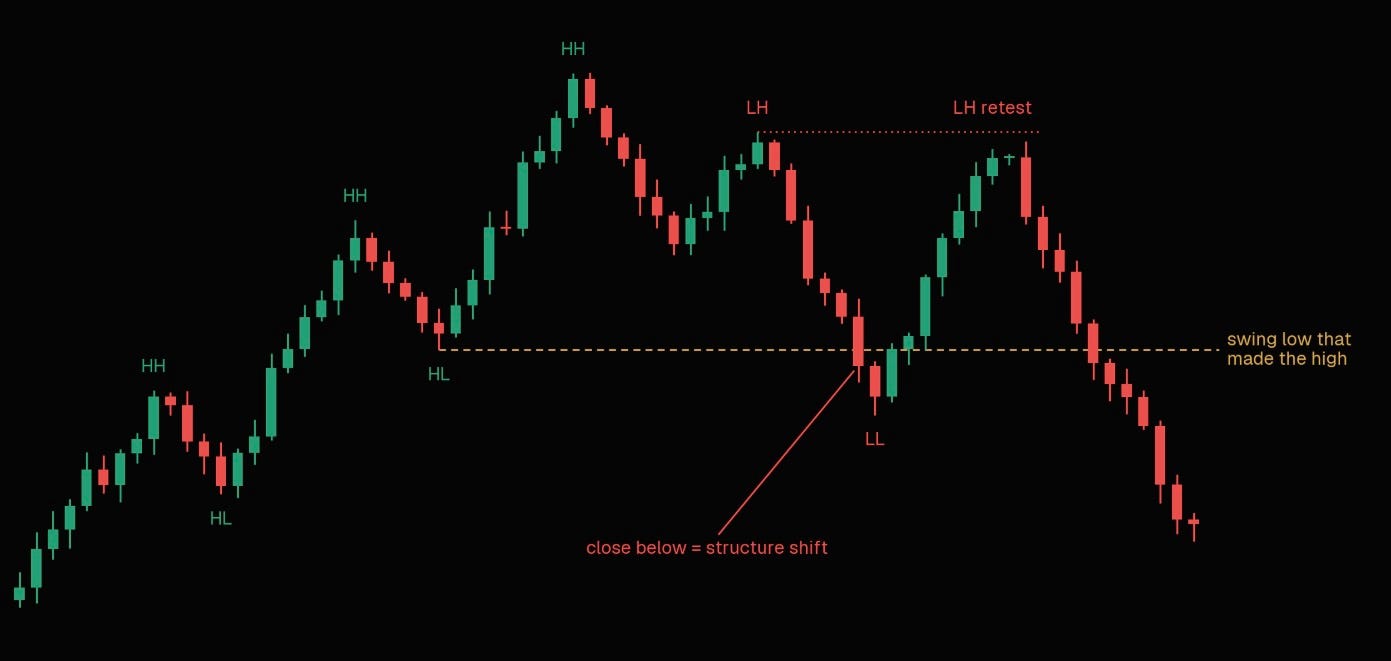
Price breaks above a level, can’t hold the momentum, and falls back hard enough to break market structure. Everyone who bought the breakout is now trapped above.
This is the only time when I would also use a market structure in the classical sense of looking at higher highs and higher lows since price does not behave as conventional wisdom teaches for most of the time.
Once you start looking for these, you will start seeing them everywhere, so be very picky about which ones you trade. These are reversal structures at key areas of interest, not something you blindly trade on a 1-minute chart.
Compressions
I am not a big fan of trendlines; horizontal support and resistance by themselves can be pretty subjective. When it comes to diagonals, it is even worse.
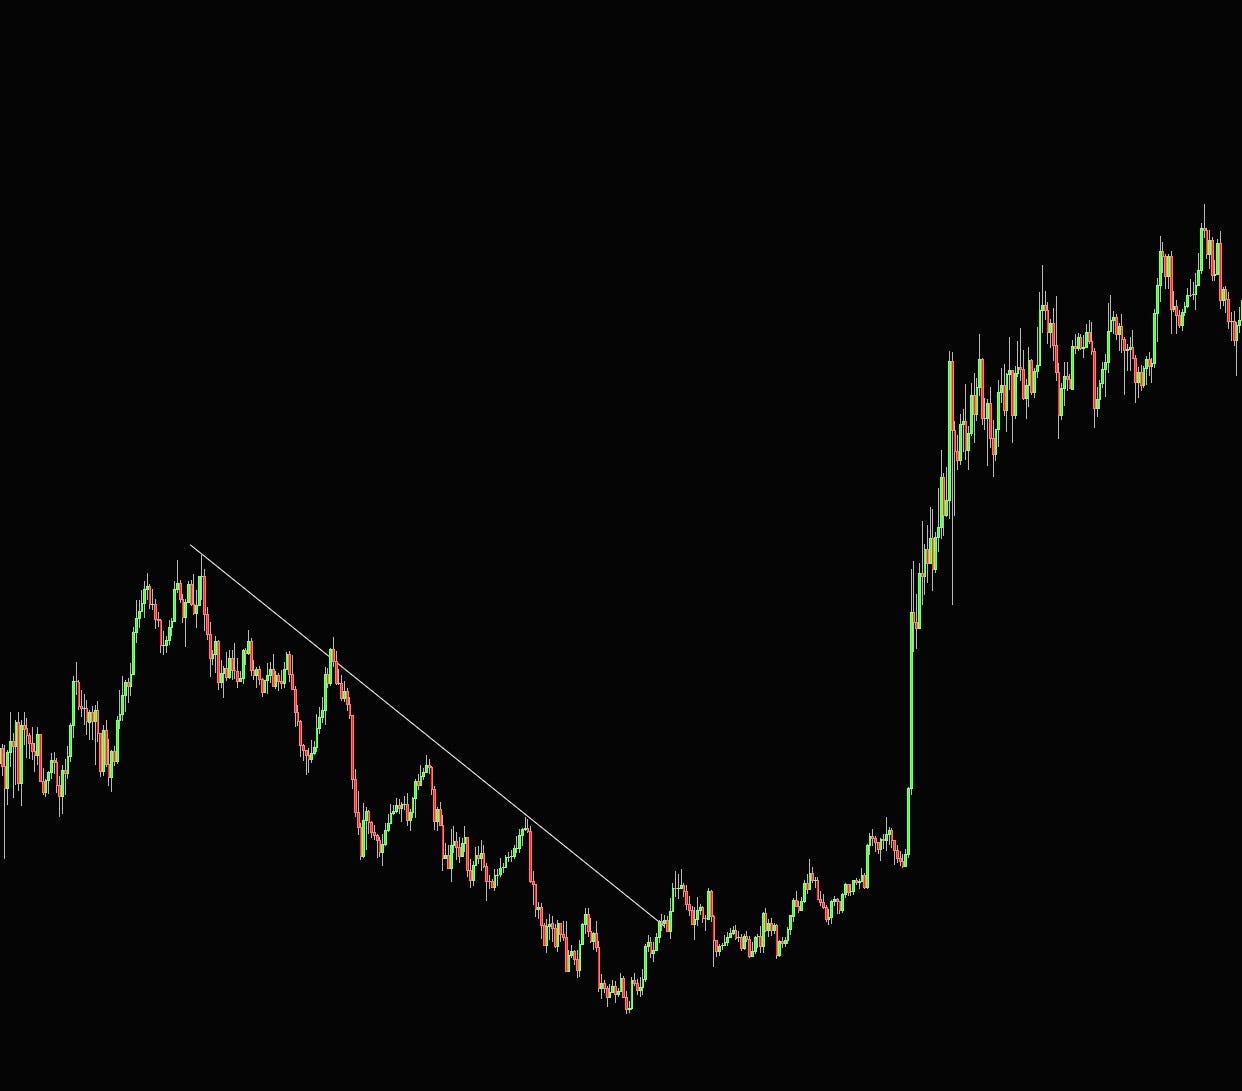
For that reason, I don’t really draw trendlines on the chart, but there is one pattern that I think is well worth paying attention to, which is called compression.
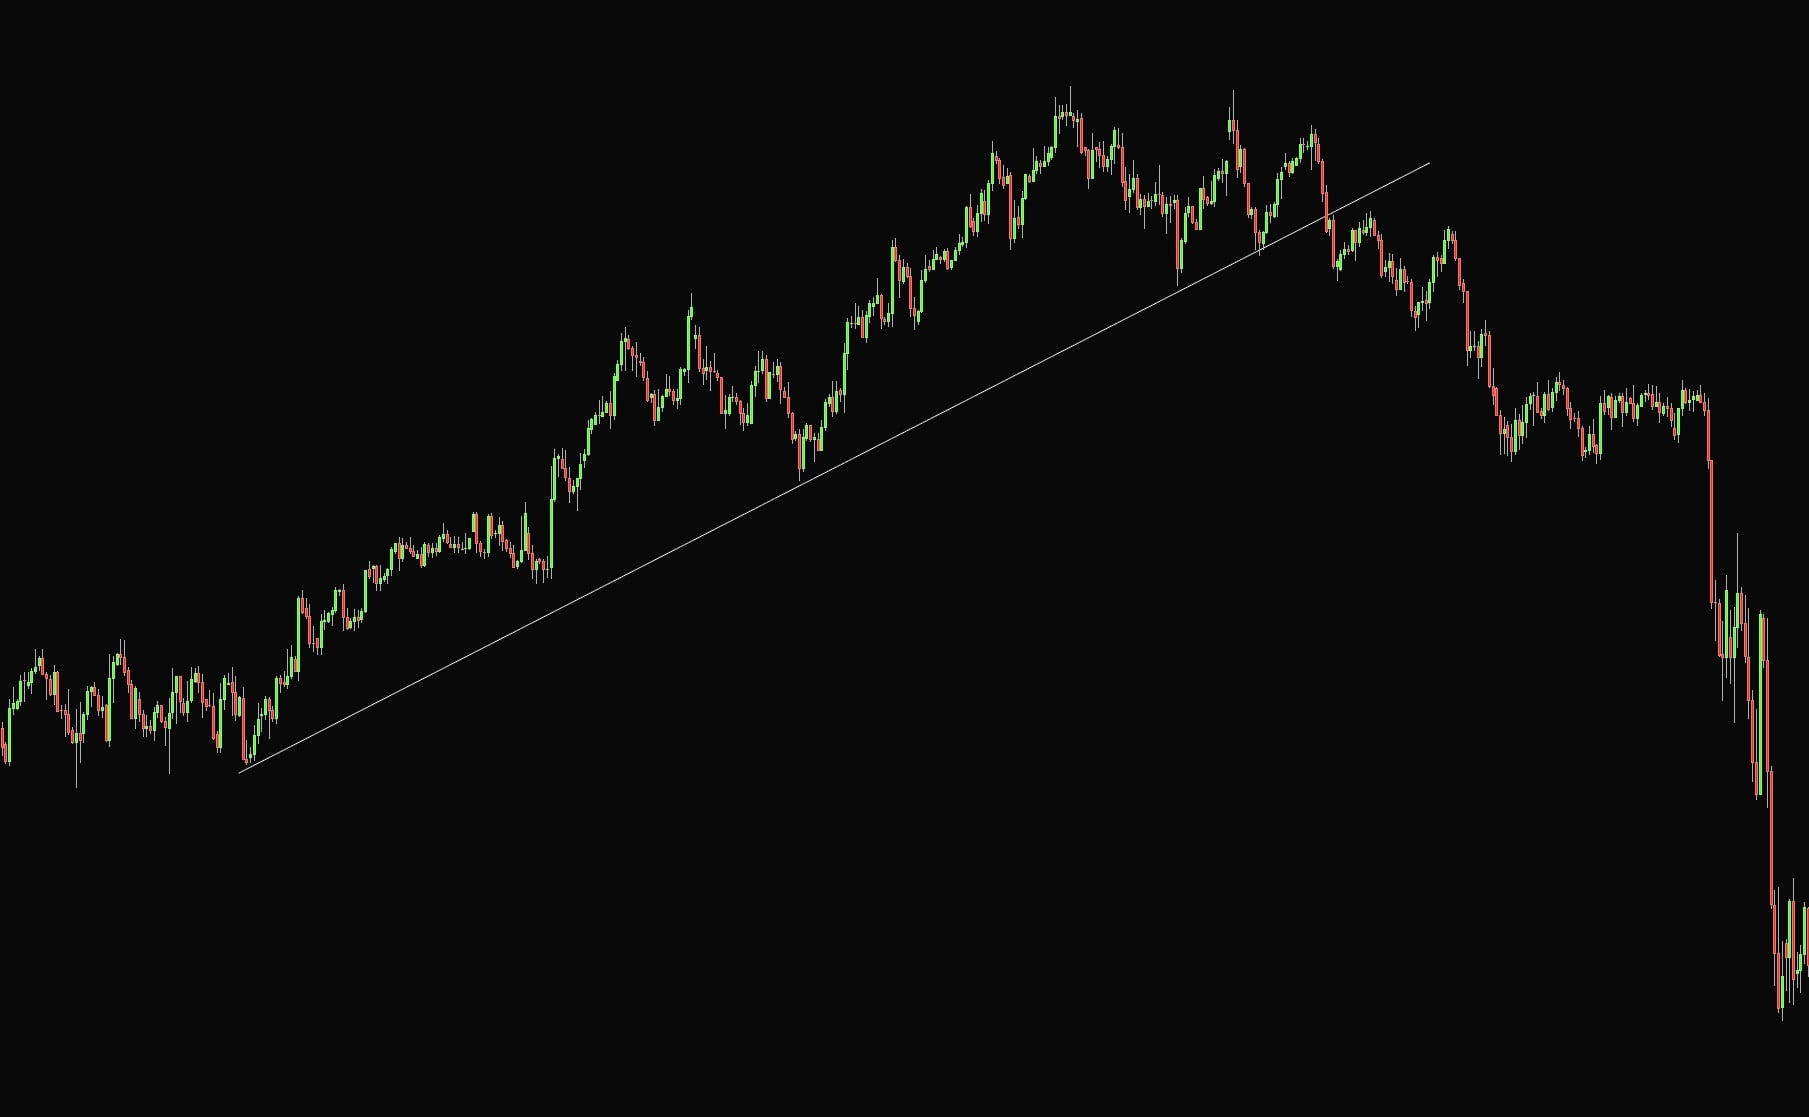
When markets trend in almost a textbook manner, making clean higher highs and higher lows going up, it brings in many flows from both price action traders and traders using things like moving averages and so on. As the price continues to grind higher, the stop-losses start to cluster behind obvious swing points.
Once this move starts to crumble and stops, it starts to get triggered; prices often cascade lower very fast as the move gets very illiquid. These can often be spotted any time you can draw a perfect trendline as support or resistance. If these break, you can find great trading opportunities targeting full retracement of the move.
AMT and Orderflow
Similar to efficient and inefficient price moves, auction market theory boils trading down to two jobs a market does: it facilitates trade, and it searches for fair value.
Foremost, profiling methods and order flow are two utterly different trading techniques and are not dependent on each other. Auction market theory and profiling tools can be used anywhere, but orderflow is strictly a lower timeframe trading tool. There is no point in using the things I will talk about on higher timeframes.
When people get into orderflow they immediately think it’s a holy grail, especially since it’s often presented as the way “professionals trade”. Orderflow tools need markets that trade on CLOB. Legacy and perpetual futures are the best.
There are also nuances within those; for example, spot forex is OTC with no real volume, and currency futures only show you a slice of the market, so the readings can mislead; commodity futures expire every month, and volume tends to be scattered all over the place; ES futures are the most liquid and traded ones, but there is an equal amount of volume traded in SPX and SPY options, and a lot of flows you might represent as directional can be just MM hedging their 0DTE exposure; Bitcoin and other cryptocurrencies can work, but nowadays they also trade on about twenty different exchanges, so orderflow can be all over the place.
The takeaway from this is that you shouldn’t use anything in isolation; order flow works as a great confluence for existing setups. These setups can be found at key areas using both price action and profiling methods.
Auction Market Theory
The Auction Market Theory breaks down the market’s primary purpose and how its participants interact to fulfill this purpose.
Trading is no different from any other auctions where there are only two main goals to be achieved.
Facilitate trade and act as a place where buyers and sellers meet
Seek for fair value
When prices are too high/low, and below/above fair value, the buyers/sellers are expected to push prices back to the fair value; this is called responsive activity.
Then market trades above/below fair value; buying/selling is not expected. It is called initiating activity, which is when we can see a market trend until they find a new fair value.
As in every auction, volume confirms or rejects new prices. Stock prices are a straightforward example. Let’s say that right now, Samsung stock is trading at $50. A new Samsung phone comes out, and it’s bad; the battery is not working, overheating, etc.
Because of this event, Samsung stock starts to drop in value until it finds new buyers at, let’s say, a $30 per share price. This is where the new value area was created.
After some time, phones get repaired, and the price of the stock starts to rise again. Where is the market likely to stop? The previous value was around $50. This is eventually what every market does as market participants negotiate prices between balanced and imbalanced values.
Auction Market Theory defines an area where 68% of the volume has traded as a Value Area.
There are 3 key components of Auction Market Theory:
Price—Advertise opportunity in the market
Time—Regulate price opportunity
Volume—Measure the success of the failure of the auction. Volume is variable and represents the interaction of market participants at different levels.
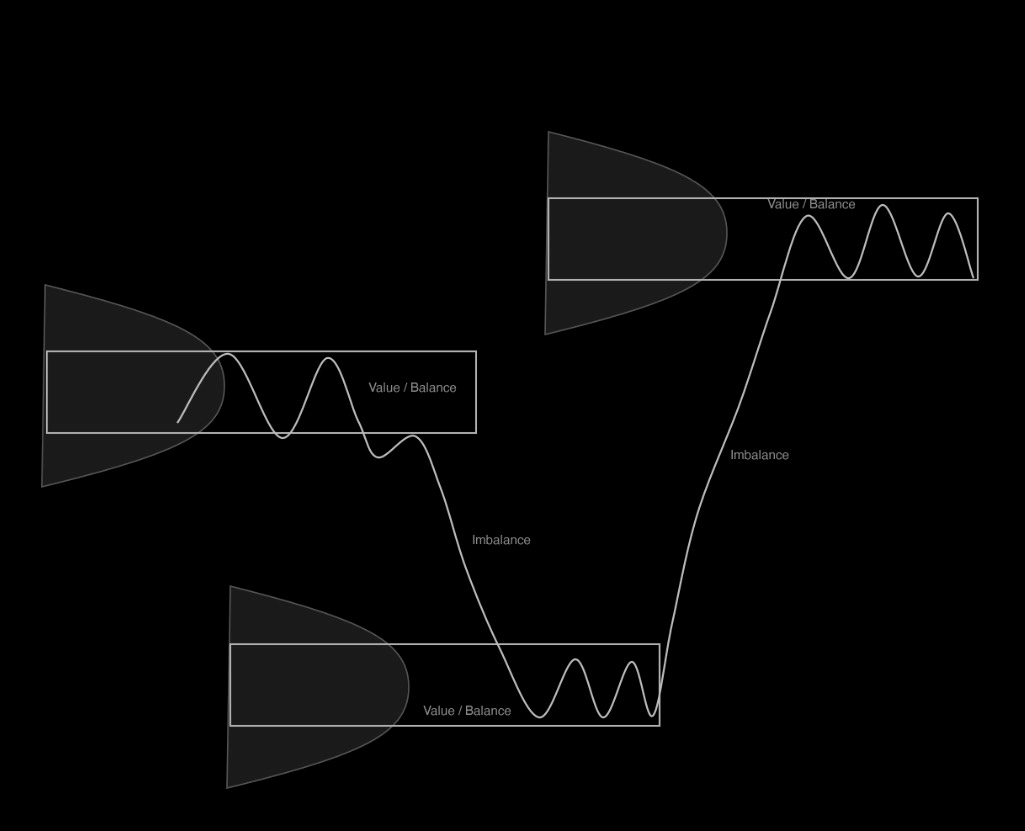
To sum up the auction theory, you always have to understand the context of a given market, as there are two types of auctions. When the market is trending up/down, we can see a fair value constantly moving in the direction of the trend.
Range represents balance between buyers and sellers that is represented by overlapping values. The general rule of thumb is once the market is inside the value, it will more likely stay in balance and explore inside the range of the value.
But if the market is an imbalance, it will often drift higher/lower until it stops, which is usually inside a previous value area.
The 5 Auction Market Theory Rules
When it comes to actual trading, these five rules are all you need. You can use them for both daily and composite profiles. These rules are what I follow and keep at the back of my head every day. Of course, for actual execution there are more factors that have to align, but these rules can make bread and butter setups for trading.
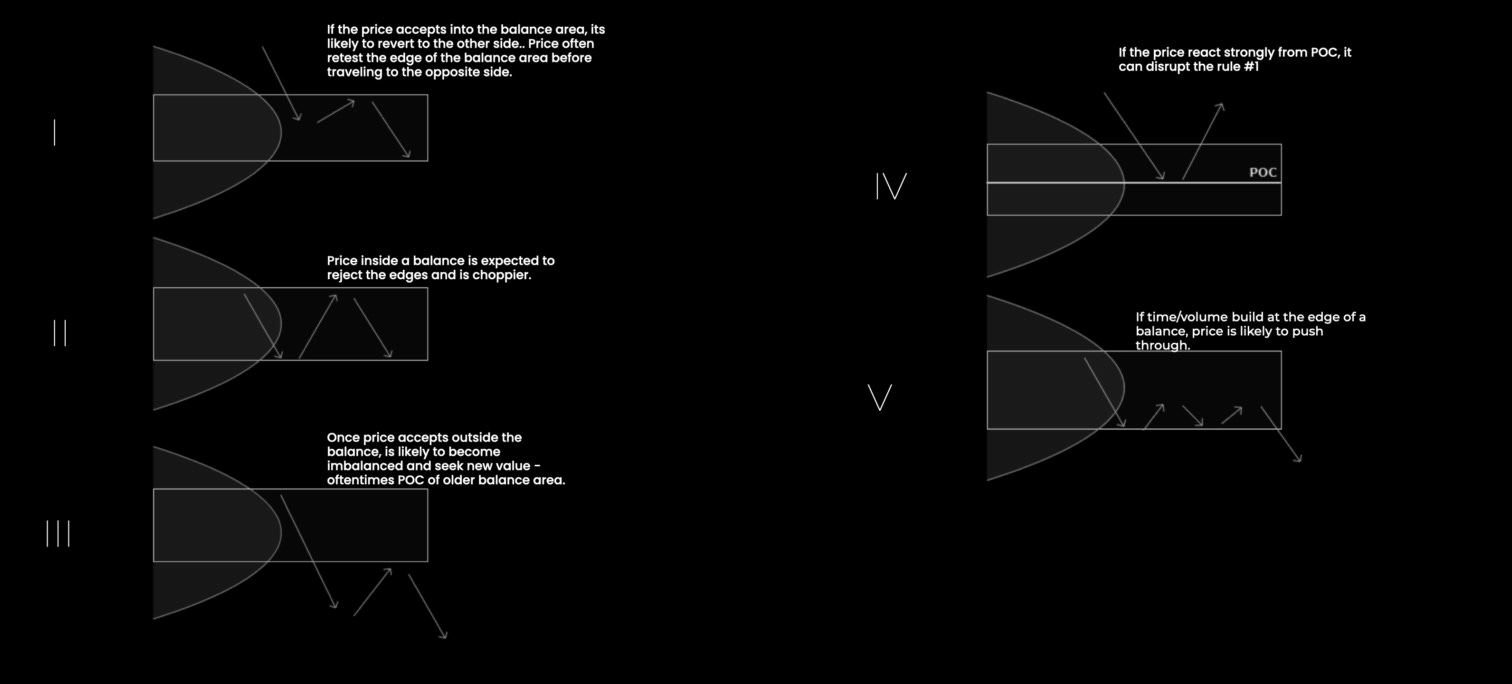
Market Profile
Market Profile, also known as TPO (time-price-opportunity), arranges separate trading sessions for the so-called profiles instead of classical chart representations. In one trading session, the time is not separated by the position of elements but only with a typographical separation for different trading periods. These are called TPOs, and one TPO usually represents a 30-minute period.
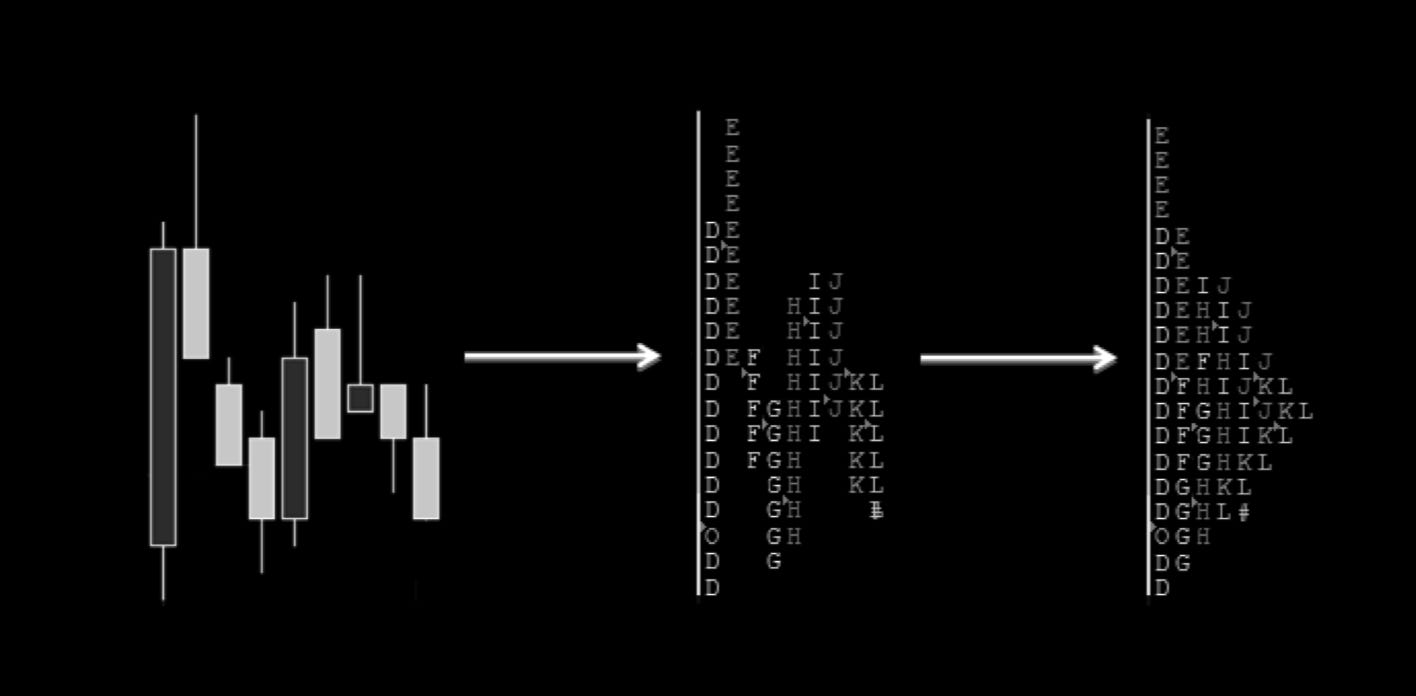
On the left picture is a typical 30-minute timeframe chart. Individual candles are replaced by letters of the English alphabet; in the above example, starting with a letter D (picture in the middle).
In the first period, Letter O highlights the opening price, and symbol # represents the price close in the last period. At the end of each session, all the letters will line up so there is no space left between them. This way, the Market Profile (last picture on the right) is finished.
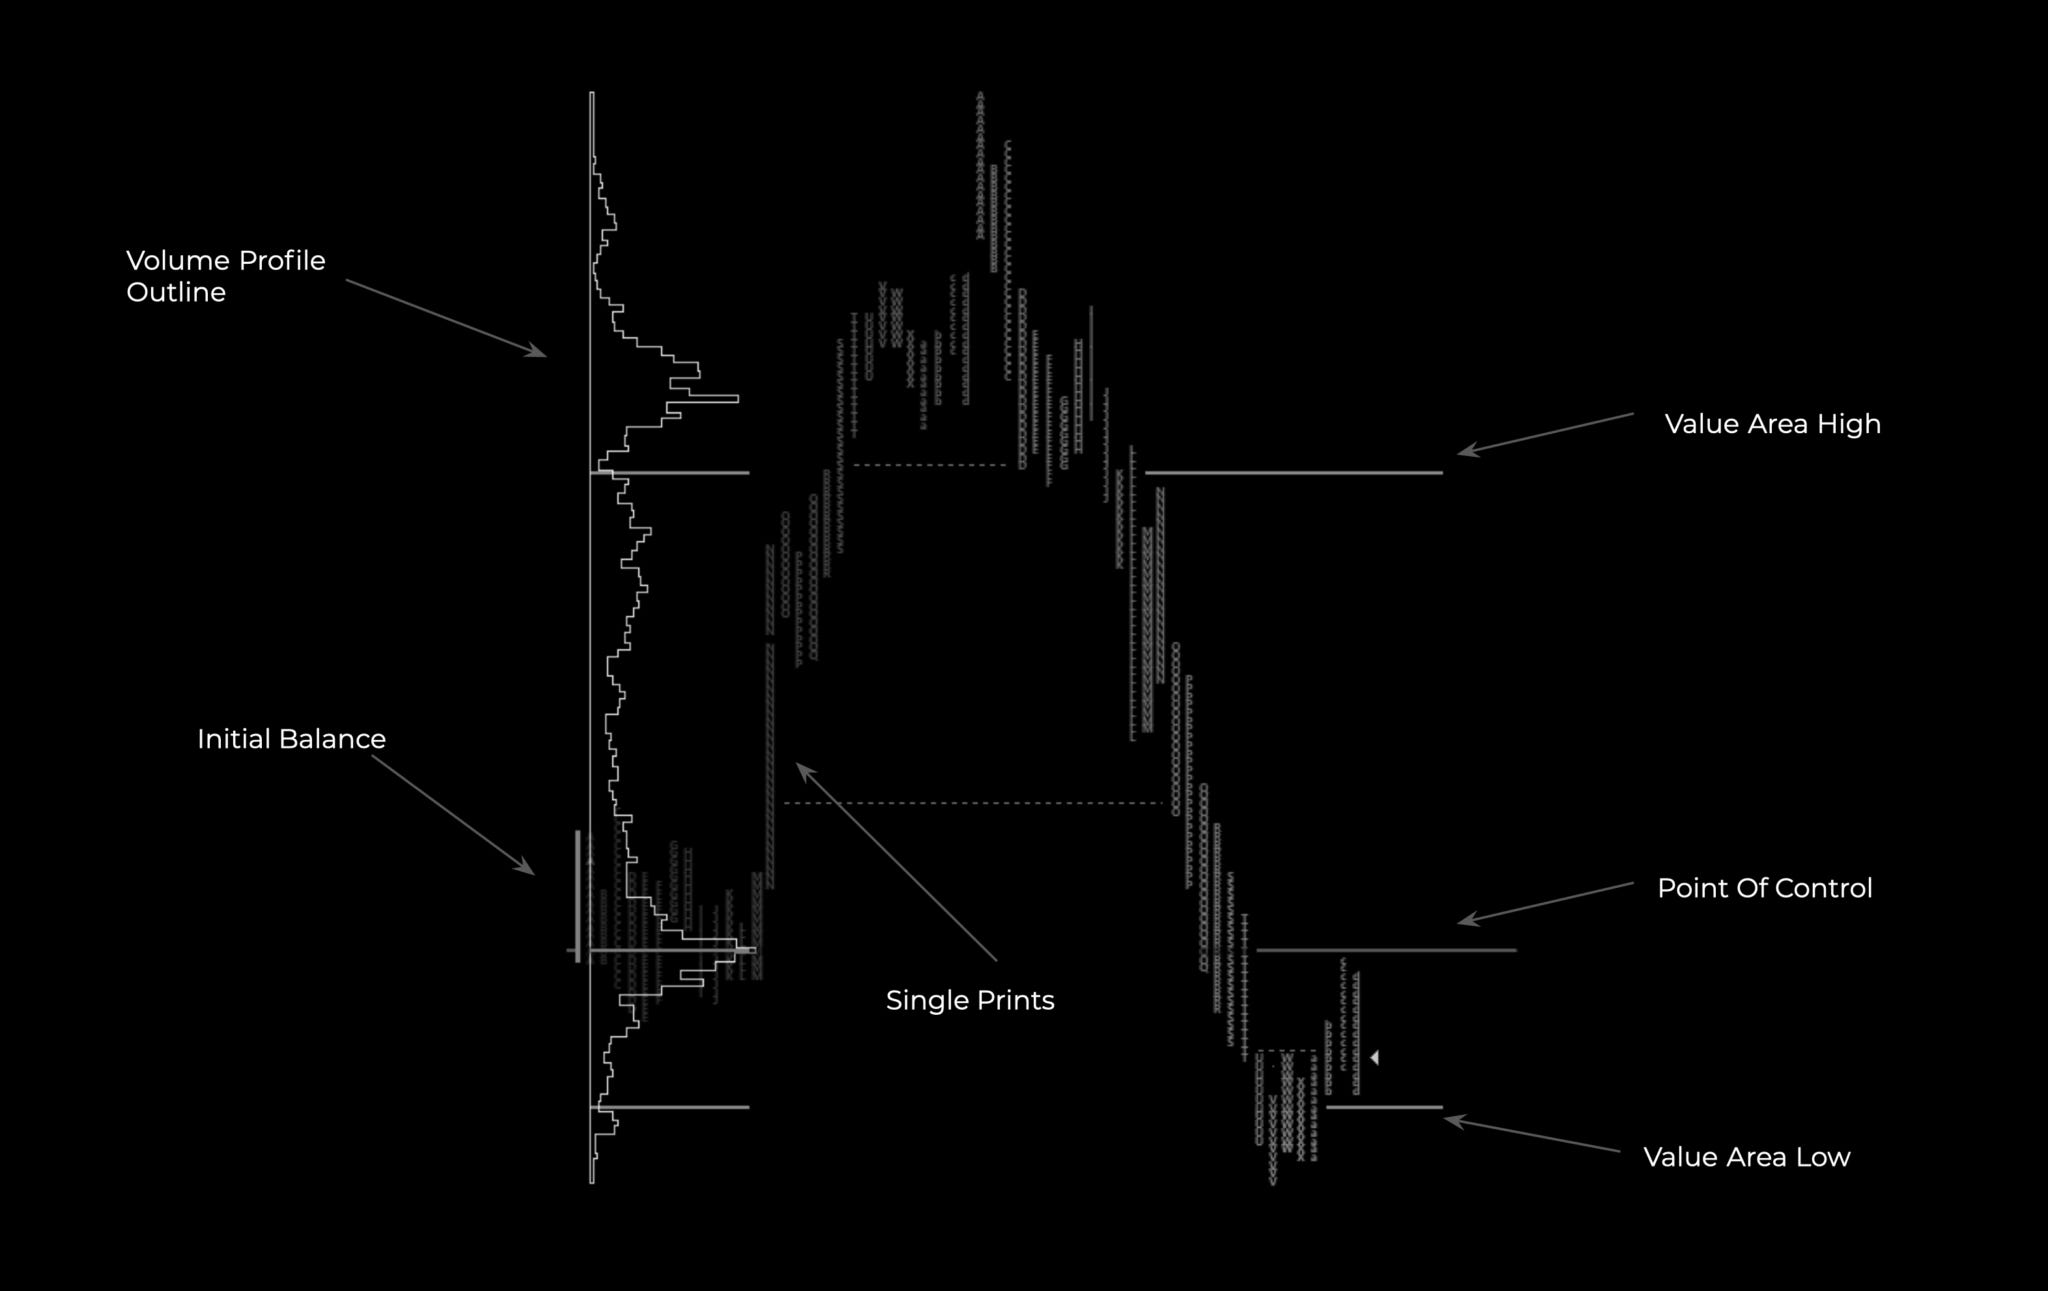
From the TPO profile, we calculate POC (point of control)—a line with the most amount of numbers—and VA (value area)—70% of letters around POC. Market profile is not a trading strategy. It is only the way to organize data.
If you are daytrading, having a market profile chart open on one screen provides instant information on where the value is, where we are trading, and what anomalies there are on the chart.
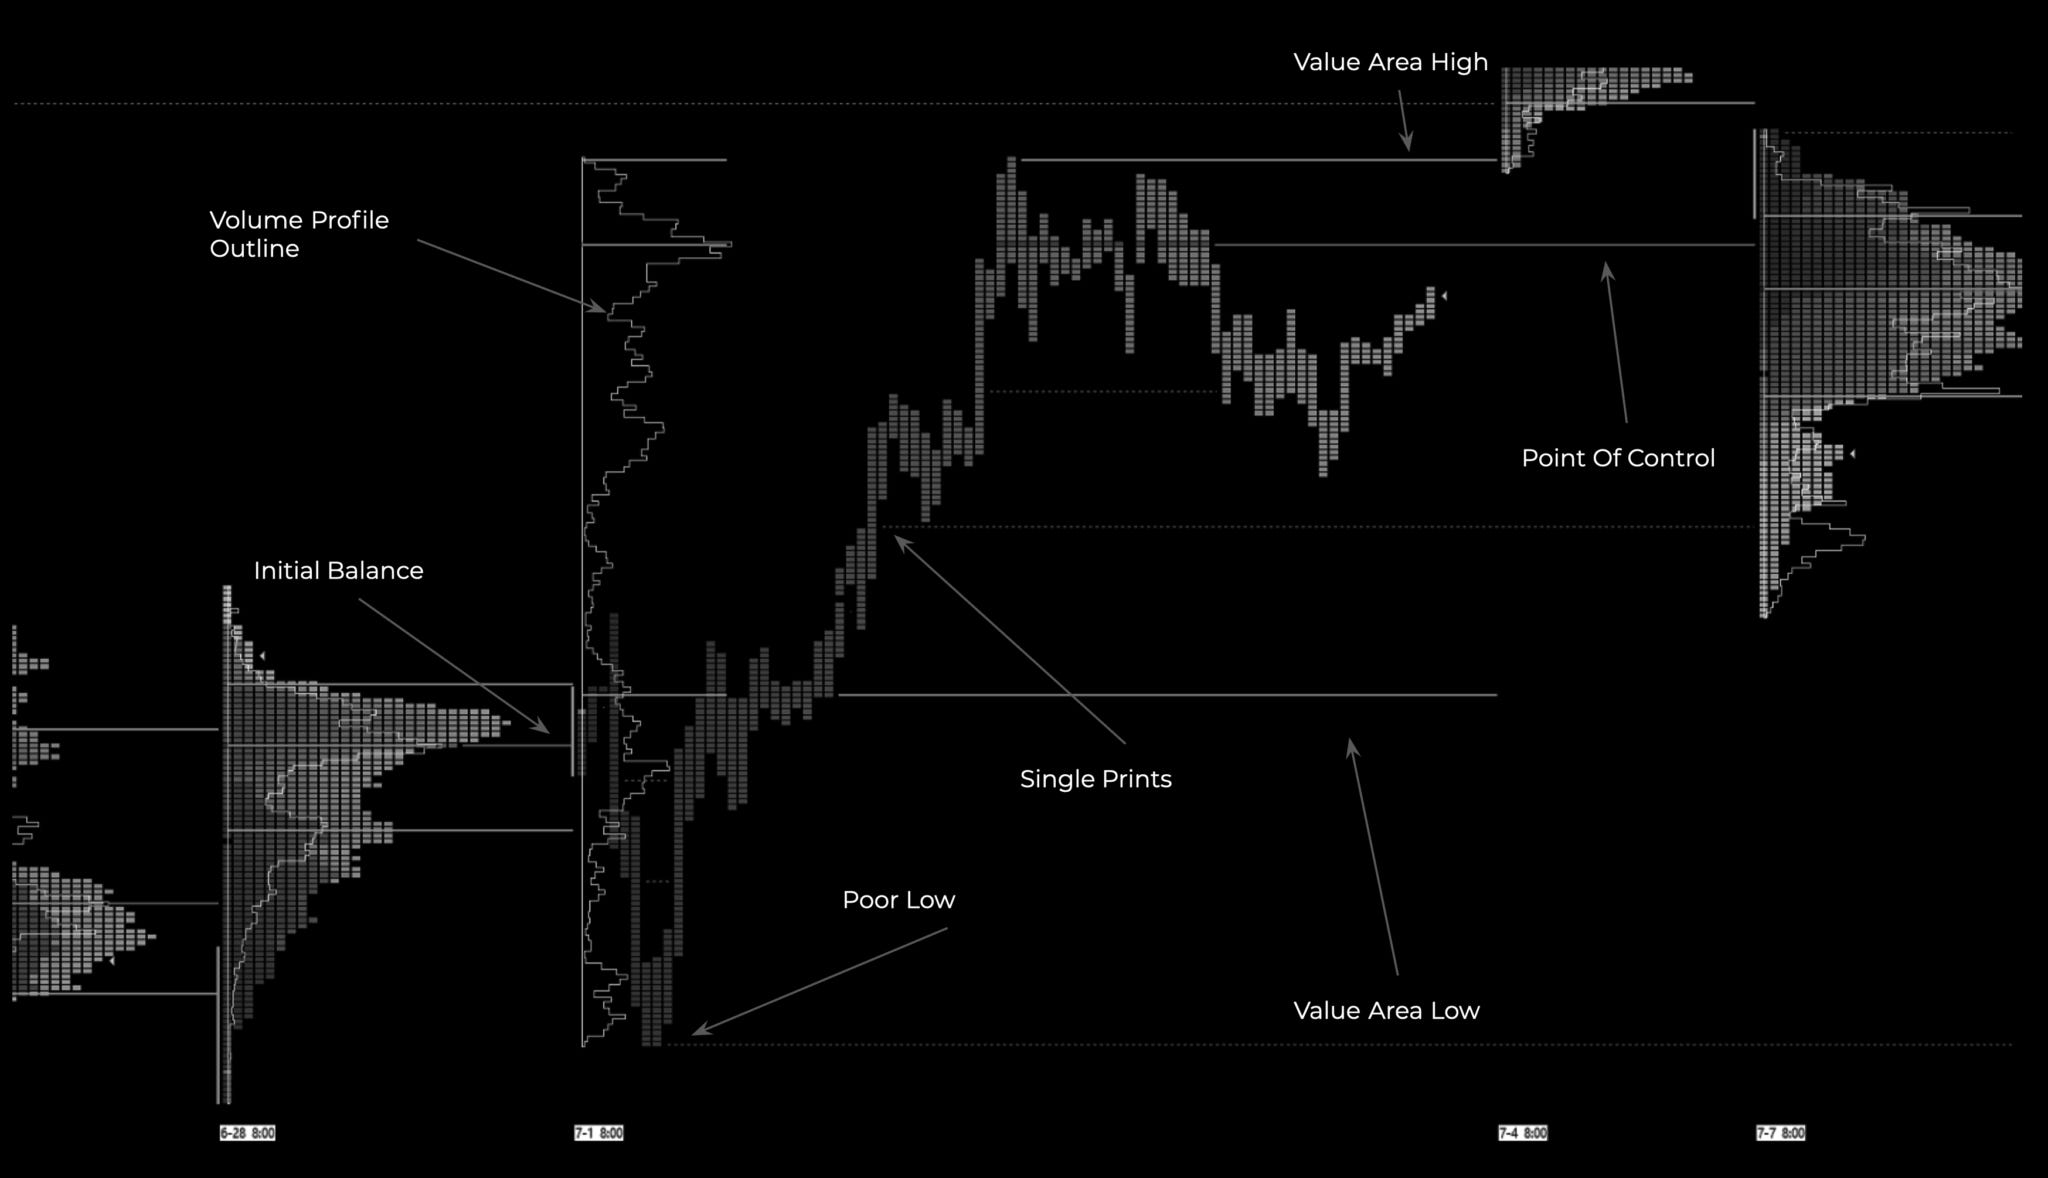
To not make this article an extra 20 pages long, if you are eager to learn more about Market Profile, search books from Dalton or Steidlemayer, who are considered founders of Market Profile; there you will find much more detail.
I will briefly explain the market profile glossary and point out things worth looking at.
Initial Balance
The first two TPOs (first two 30-minute candles) of a day. Every market has a different initial balance.
CME products differ from different indices and commodities. ES, for example, opens at 9:30 EST. Eurex products at 6 AM UTC. Crypto at midnight UTC,
Forex can have just about any time, such as the first hours after London opens, New York opens, or the whole Asian range.
Initial balance can be used as basic S/R lines; generally, you want to be long above and short below IB to stick to the day’s trend. If the price is too far from IB, you can play a mean reversion to it. Initial balance is a factor of confluence, not a standalone entry decision, but many strategies evolve around this concept, such as the famous opening range break.
Day Types
Normal Day, Neutral Day, Double Distribution Day, Trending Day.
There are even more of them; should you learn about all of them? Maybe. Was I ever using them in my trading? No.
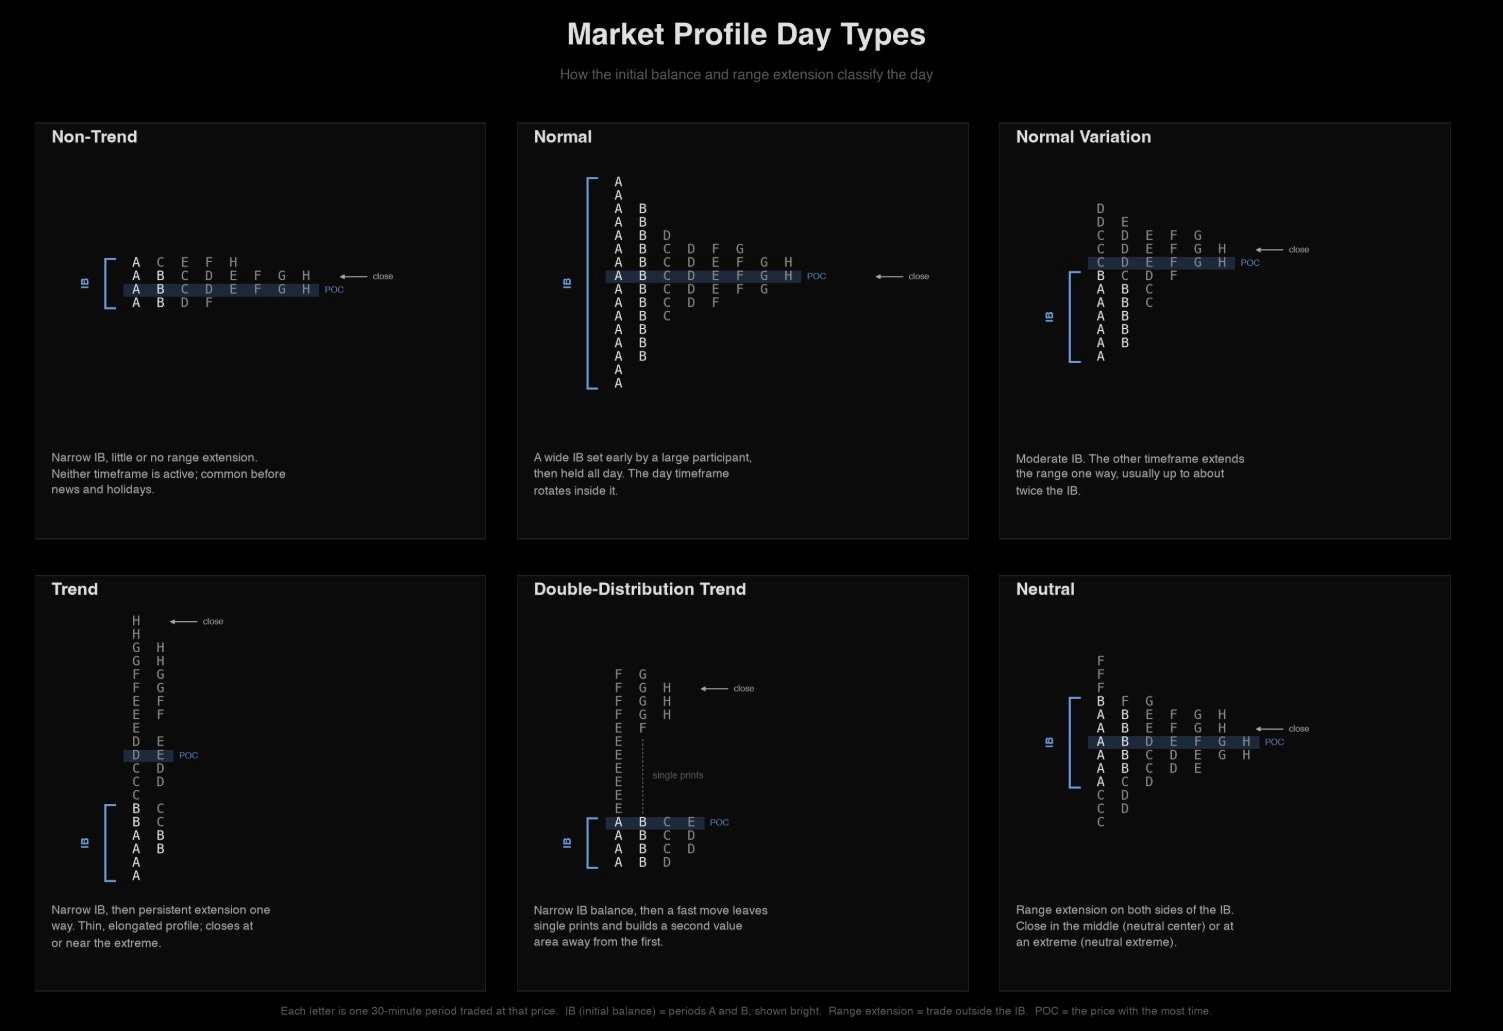
Trending and double distribution days are trend days, with trending days having the highest market conviction. You will often see one-time framing when the TPO doesn’t trade below the previous TPO’s low. In other words, the 30-minute candle doesn’t trade below the low of the previous 30-min candle in an uptrend. The opposite is true for the downtrend.
Double distribution has a lower conviction with a single print in the middle and two single distributions.
All the other days signal range days and balance, which built up for a bigger move in the future.
Opening Day Types
Open Drive, Open-test-drive, Open-rejection-reverse, open auction.
Again not that big of a reason to overfixate on these. They hold value when you can recognize them early on, but in my opinion, you don’t need to.
Poor highs / poor lows
Two or more TPOs at the same price point at the top or bottom of the profile.
On a 30-minute chart, these are the double tops and bottoms. These signal us the unfinished auction, which is often revisited to complete the auction.
These are great intraday areas of residual liquidity.
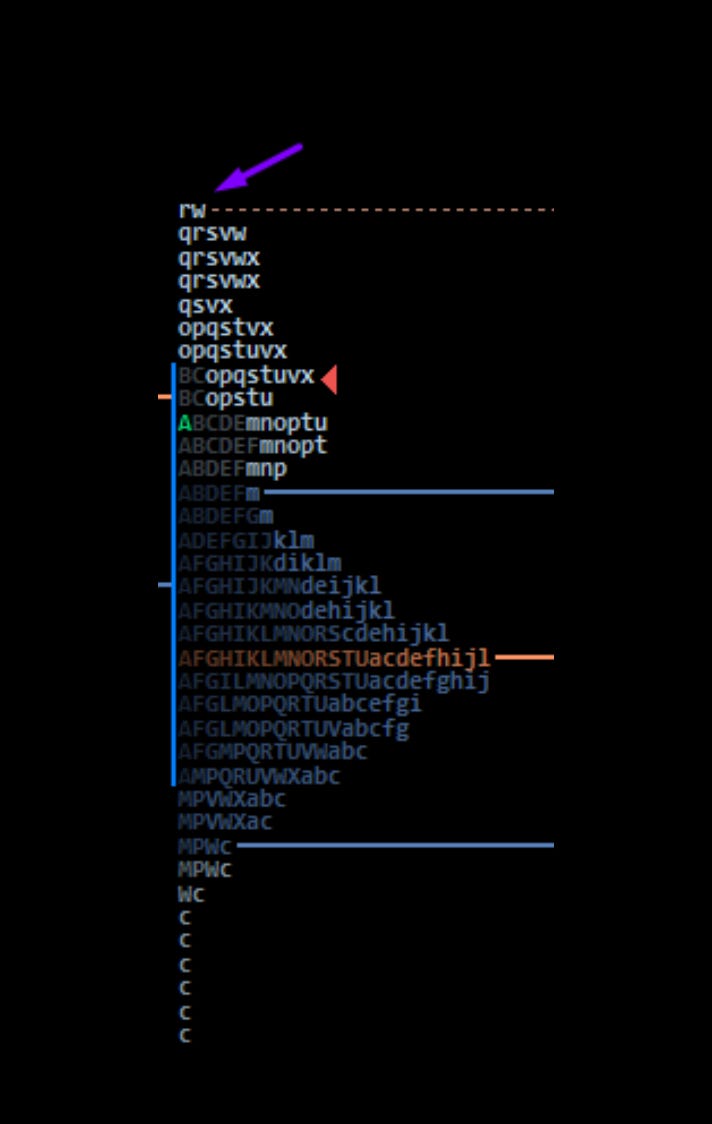
Excess
Excess generally indicates the end of the auction and the start of another. Excess is seen in the extremes of the profile with a strong pullback. On the candlestick chart, you see this as a candle with a long wick.
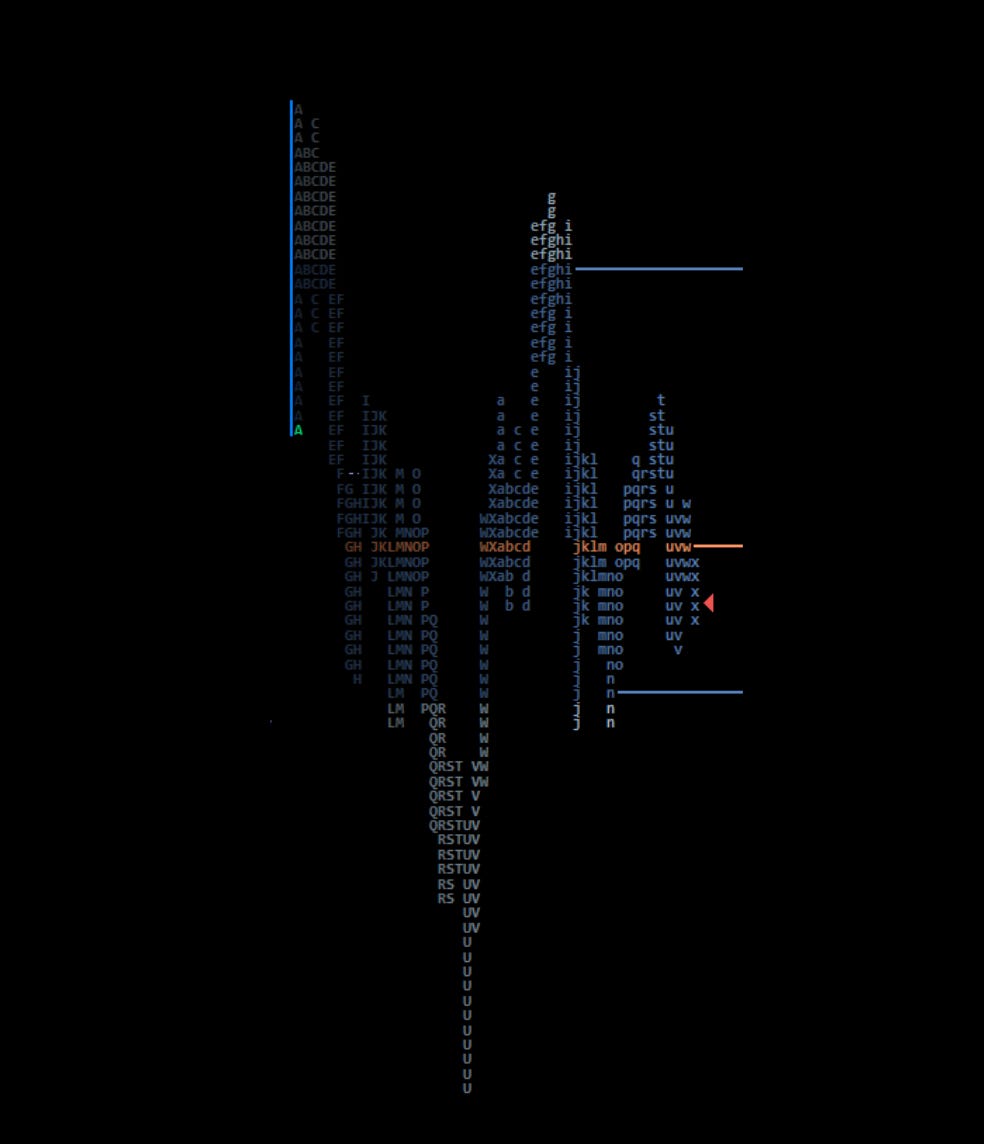
As you can see, on this day the market was trading lower until the U period, where it made excess to the low and the auction reversed.
Single Prints
These are the same as excess but in the middle of the profile, leaving low-volume nodes. On candlestick charts this is your inefficient move.
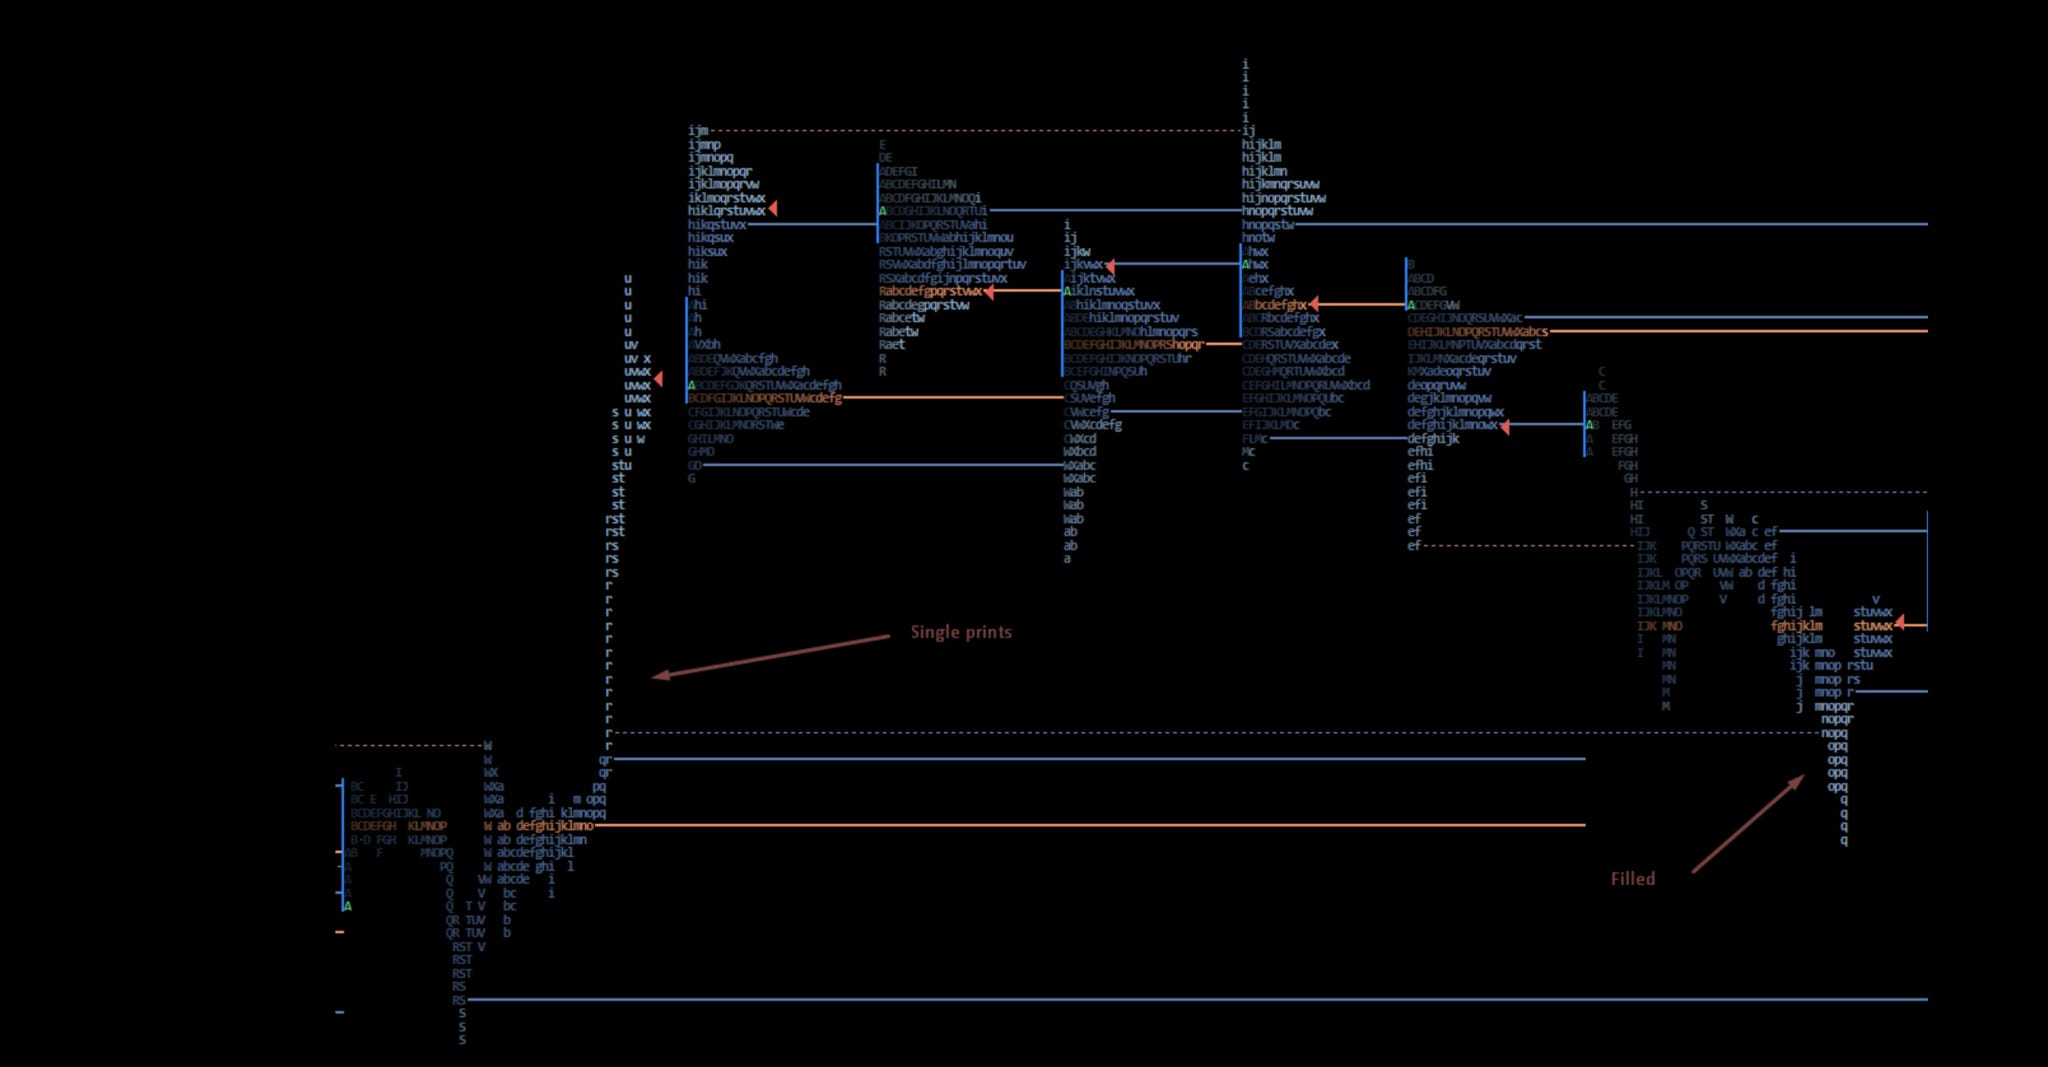
These show that the market might have been too quick to move in one direction. They often leave liquidity gaps, which tend to get filled, and because of them, you can use these single prints as both targets and entries.
Volume Profile
There are two ways to display an auction, with volume and price. Which one is better? It’s up to you to decide. They are essentially the same; the only difference is the market profile will use time, while the volume profile will use volume.
Value Area (VA) – 68% of the highest traded volume in the volume profile
Point of Control (POC) - Level of the most traded volume. Naked points of control bring the most significance, as they are untested.
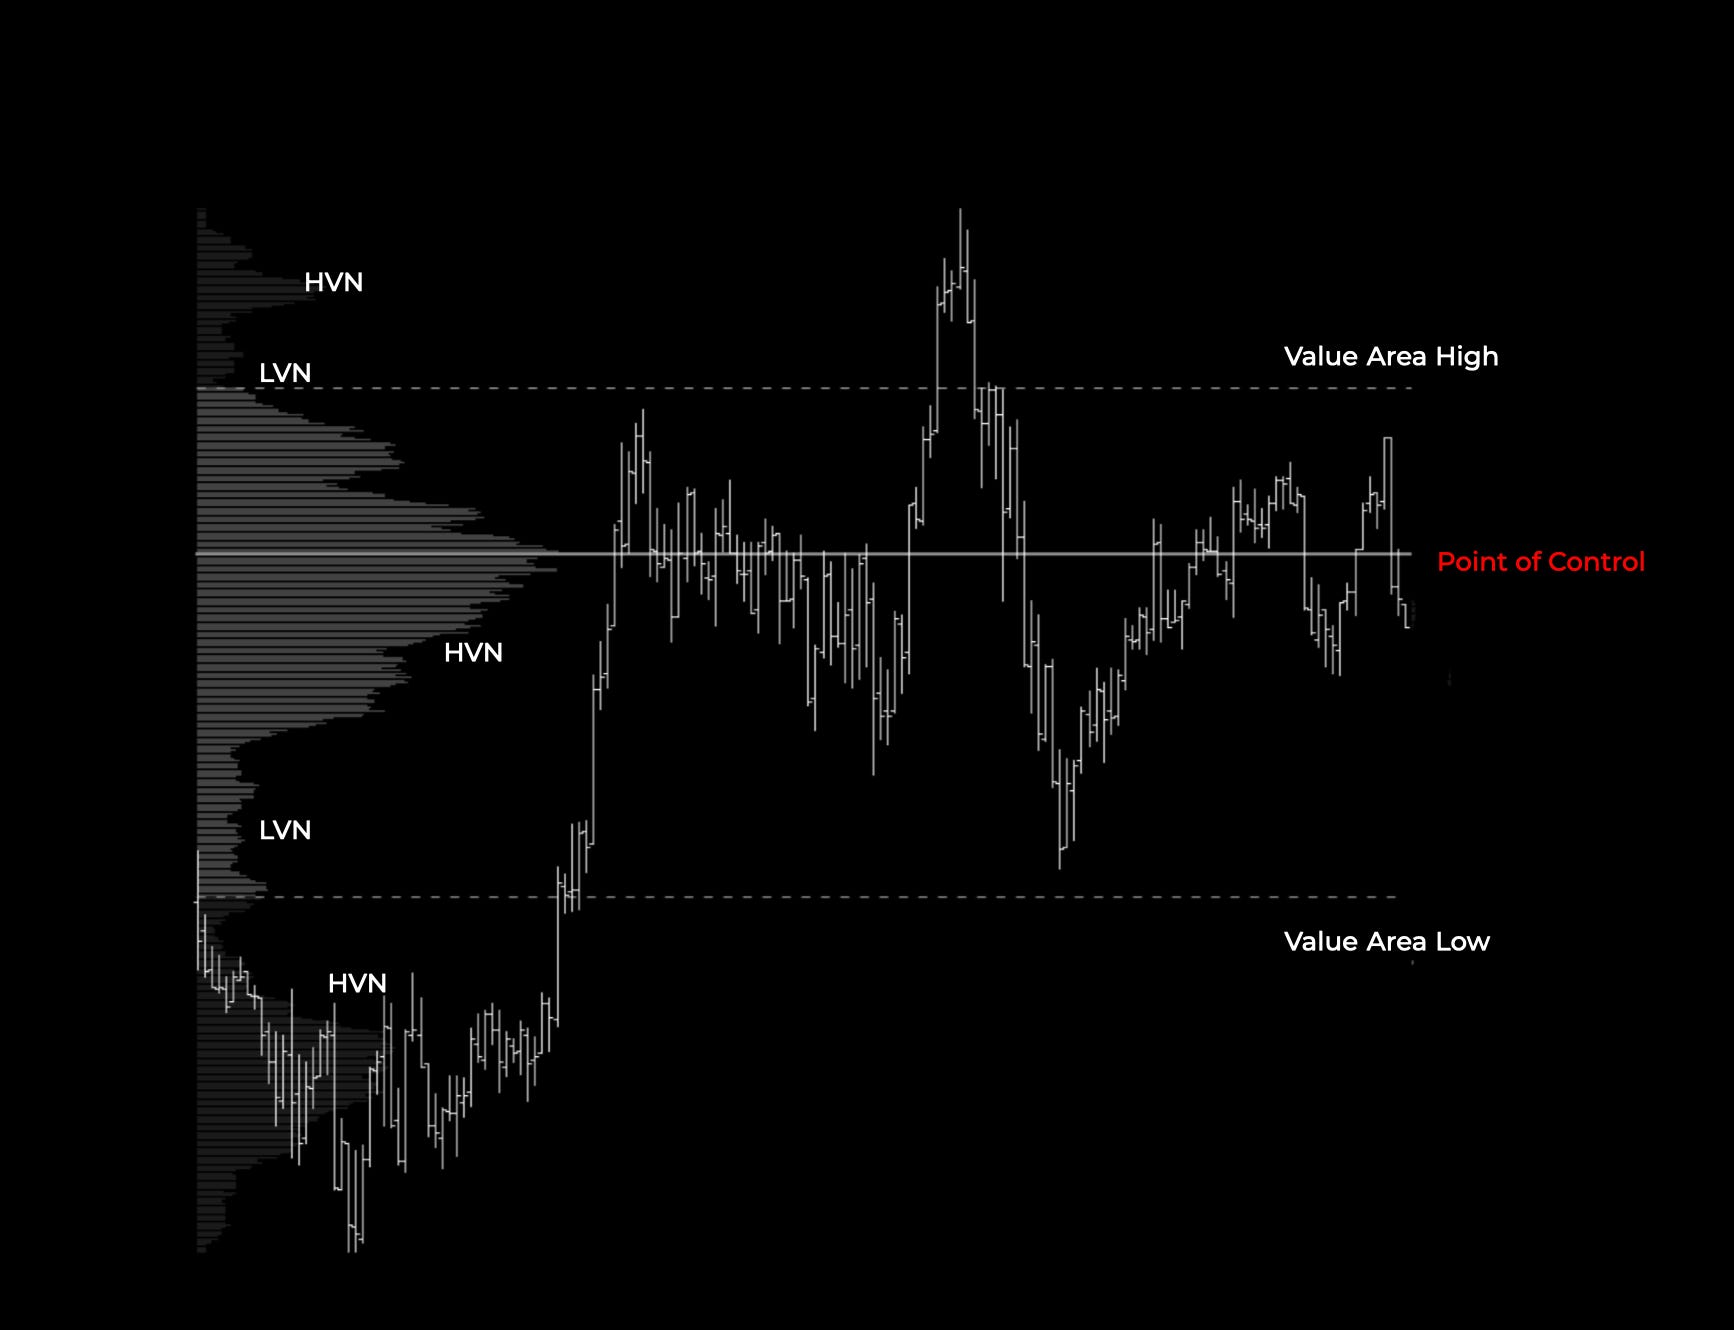
On the chart, you can see a volume profile representing one trading day; besides the Value Area High, Value Area Low, and Point of Control, we also recognize the High-Volume Nodes and Low-Volume Nodes.
High-volume nodes (HVN)—areas where price found acceptance in the past, so they should act as support and resistance areas in the future; we want to use edges of these HVNs as our entries and exits.
Low-volume nodes (LVN)—areas where price moved quickly through. Hence, we can find liquidity gaps there.
To recap this, when the market is in HVN, we expect more of a range-bound environment with price bouncing from the edges. When the market enters into the LVN, we can look for more trending environments.
Composite Profiles
Composite profiles are all profiles that consist of more than one trading day. It can be days, weeks, or years.
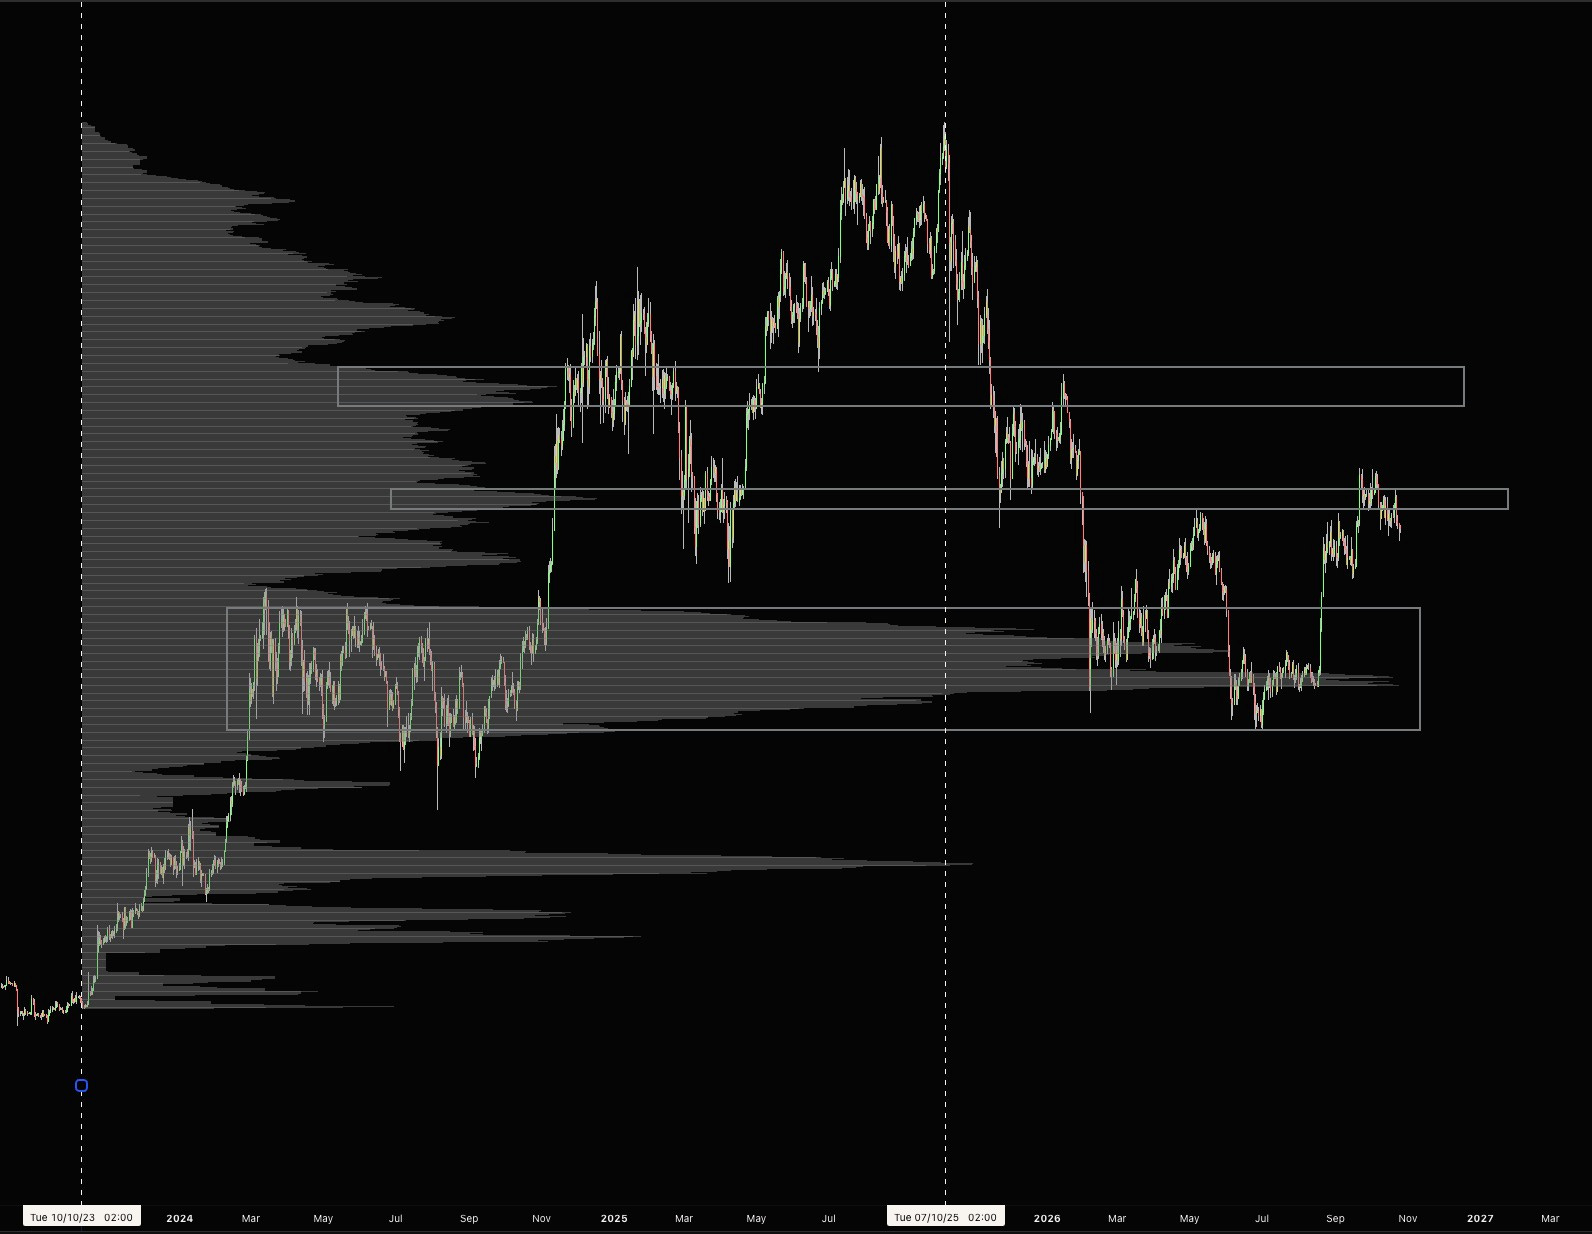
Above you see the composite profile on Bitcoin, which only draws the composite profile from the start of the rally in 2023 until the top in October 2025, so it did not see any of the future price action.
Even without that, you can notice that the price moved quickly down until it hit high-volume nodes and made a bottom this summer in the biggest high-volume node it could find. As it rallied up, prior points of control were acting as resistance.
Another popular way of making a composite profile is by putting together multiple days with an overlapping value, like this example with ten days of range.
Some simple rules for this:
If the POC shift is outside the value area of the prior day, don’t merge profiles
Trend days that break straight through the value without building new value do not violate the structure.
More recent composite profiles are more important
The more days the composite profile is built from, the more important it is.
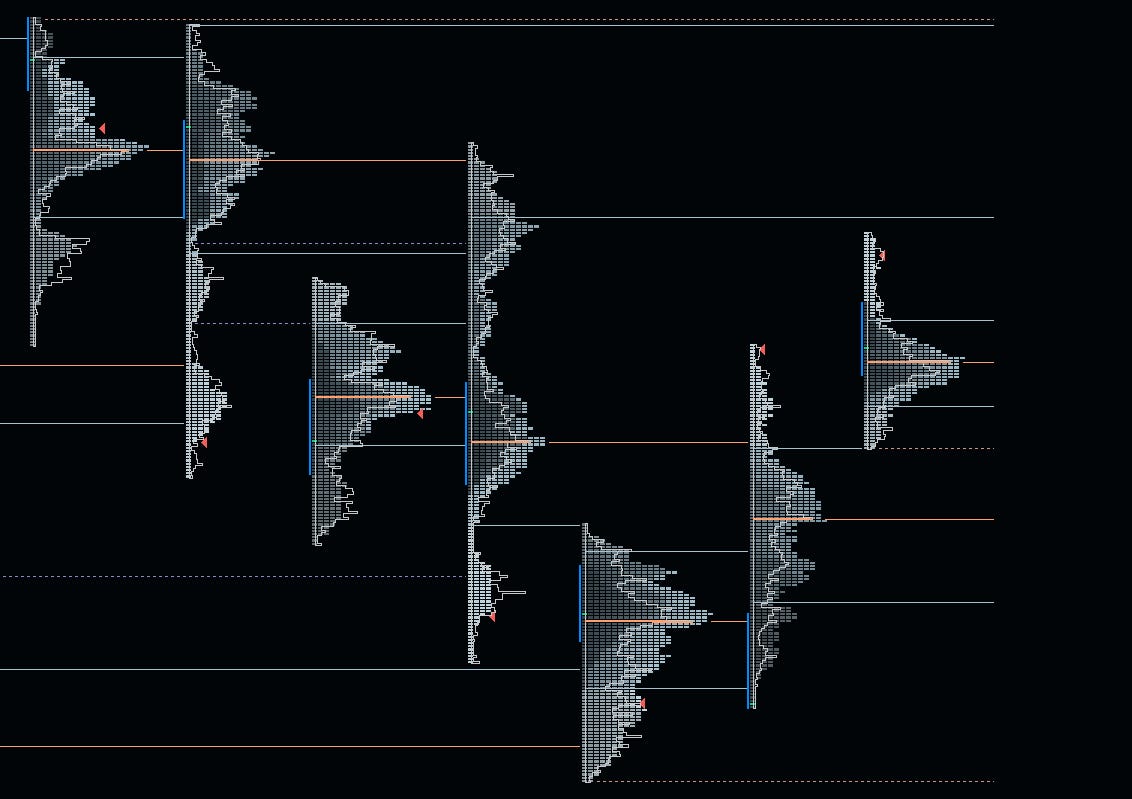
As you can see, here are 7 trading days. Which ones can we merge?
Day one and day two are a no-brainer, as they have overlapping POCs. The third day moved completely lower, so there is no merge there.
The fourth day can be merged with the third, although it was a big trend day; POC, and main value overlap the third day. The rest of the profiles are not a merge.
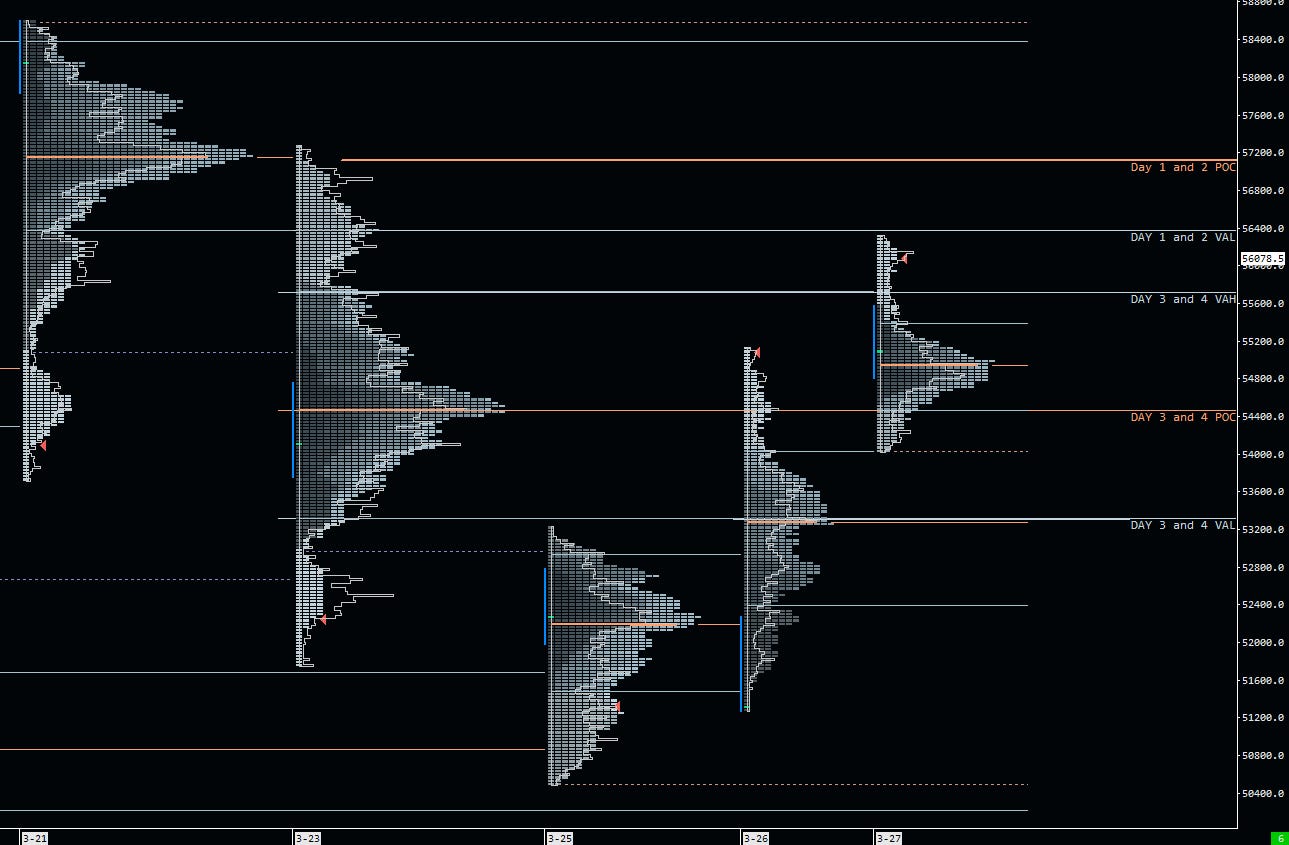
When the market is trading around these composite levels, we can put more weight on them compared to single-day profiles. As with everything in auction market theory, we are using the 5 concepts of value I described earlier.
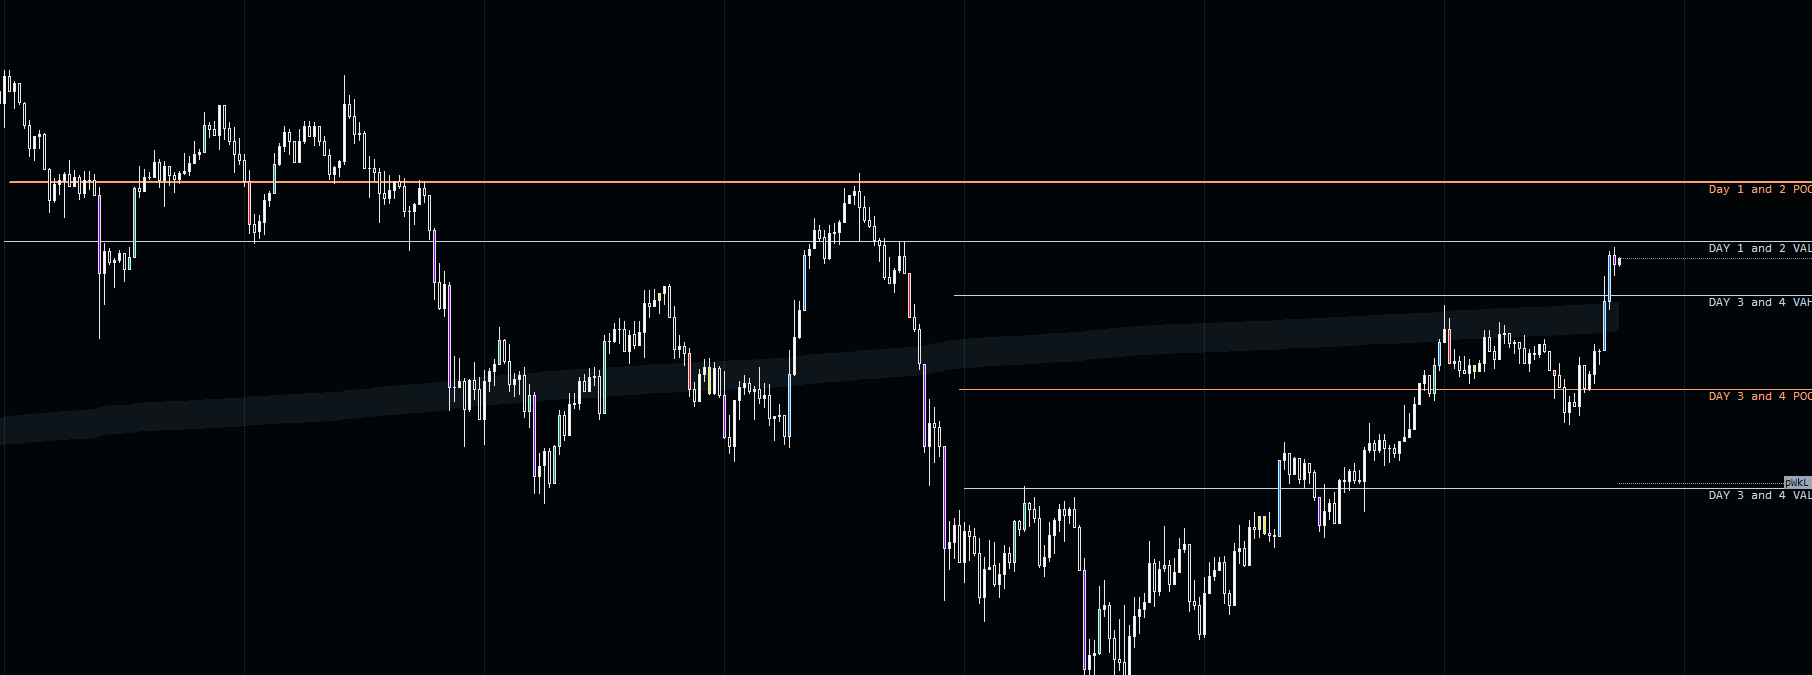
As you can see from the price chart, there was an acceptance of the day 3 & 4 value and rotation to the opposite side.
VWAP
Volume-weighted average price is a name that suggests moving average weighted by volume.
It happens to be pretty important. for a lot of trading strategies, therefore looking at a daily, weekly, monthly, or yearly VWAP can provide levels of support and resistance.
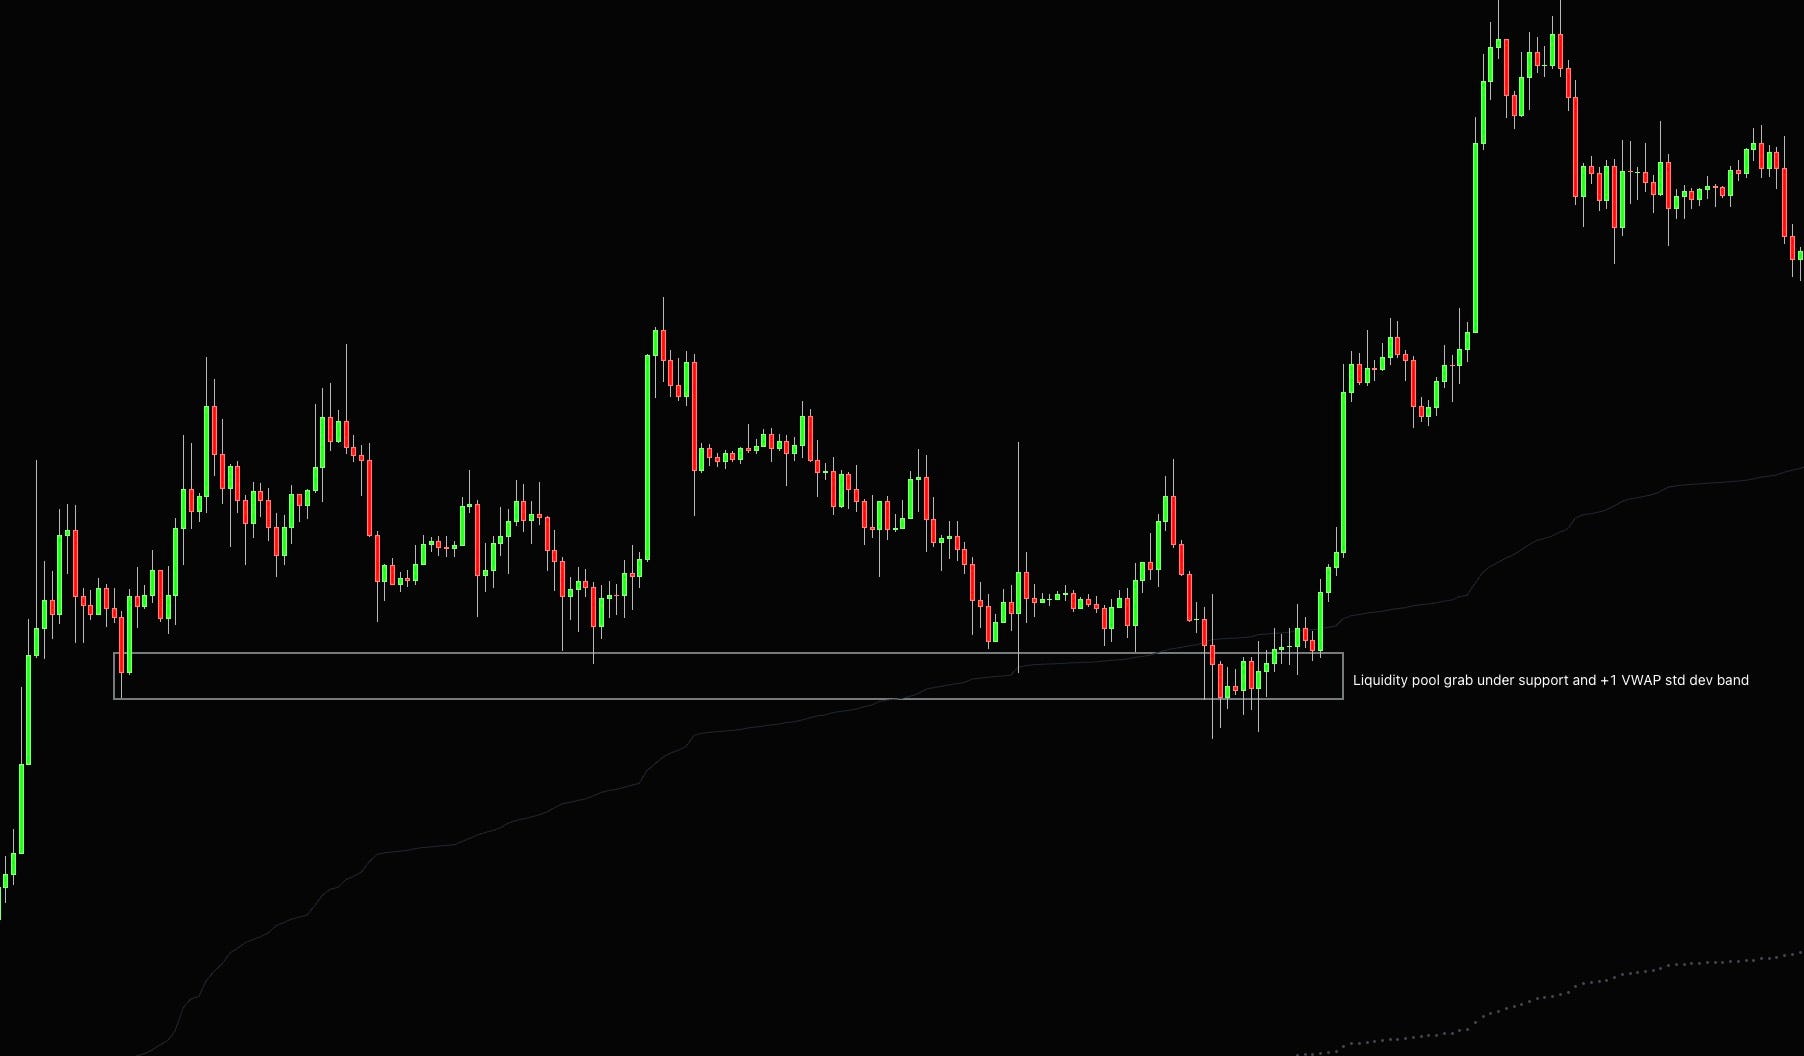
You can also plot one standard deviation band from VWAP to get a dynamic version of the value area and use the same auction market theory principles as with market and volume profiles.
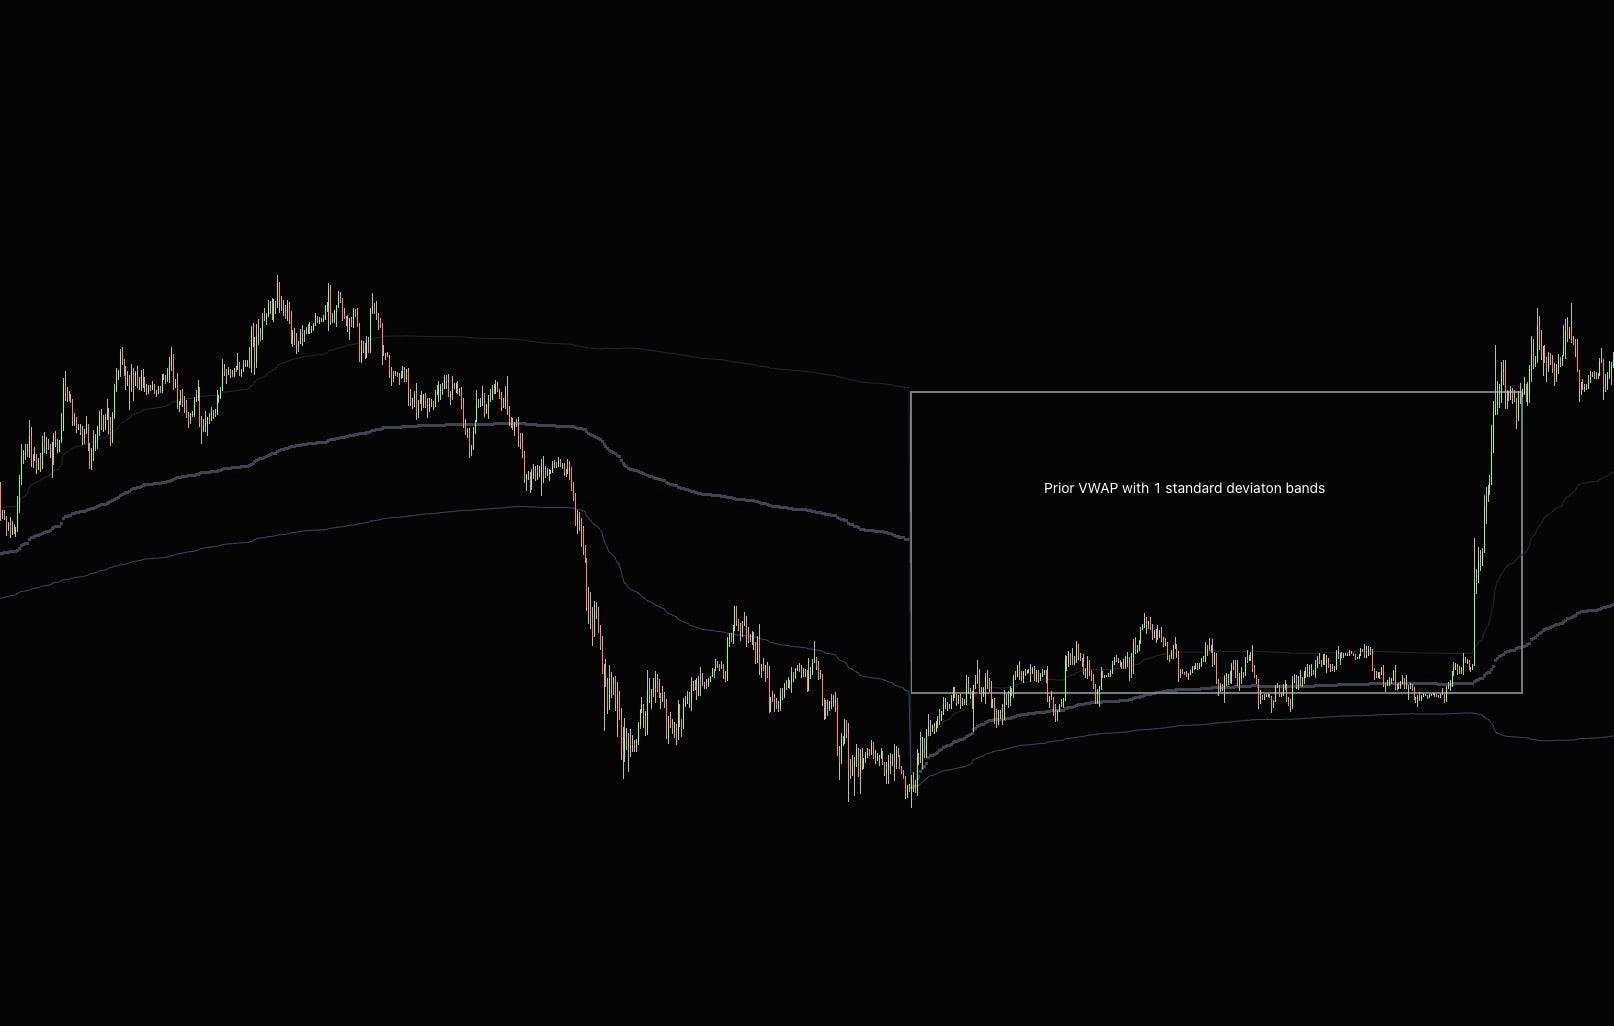
Accepted inside the bands, expect rotation to the other side. Accepted outside, use them as dynamic support and resistance for a trend. They aren’t precise, so don’t place orders on them, but they can give you a decent guide of where prices are likely to head next.
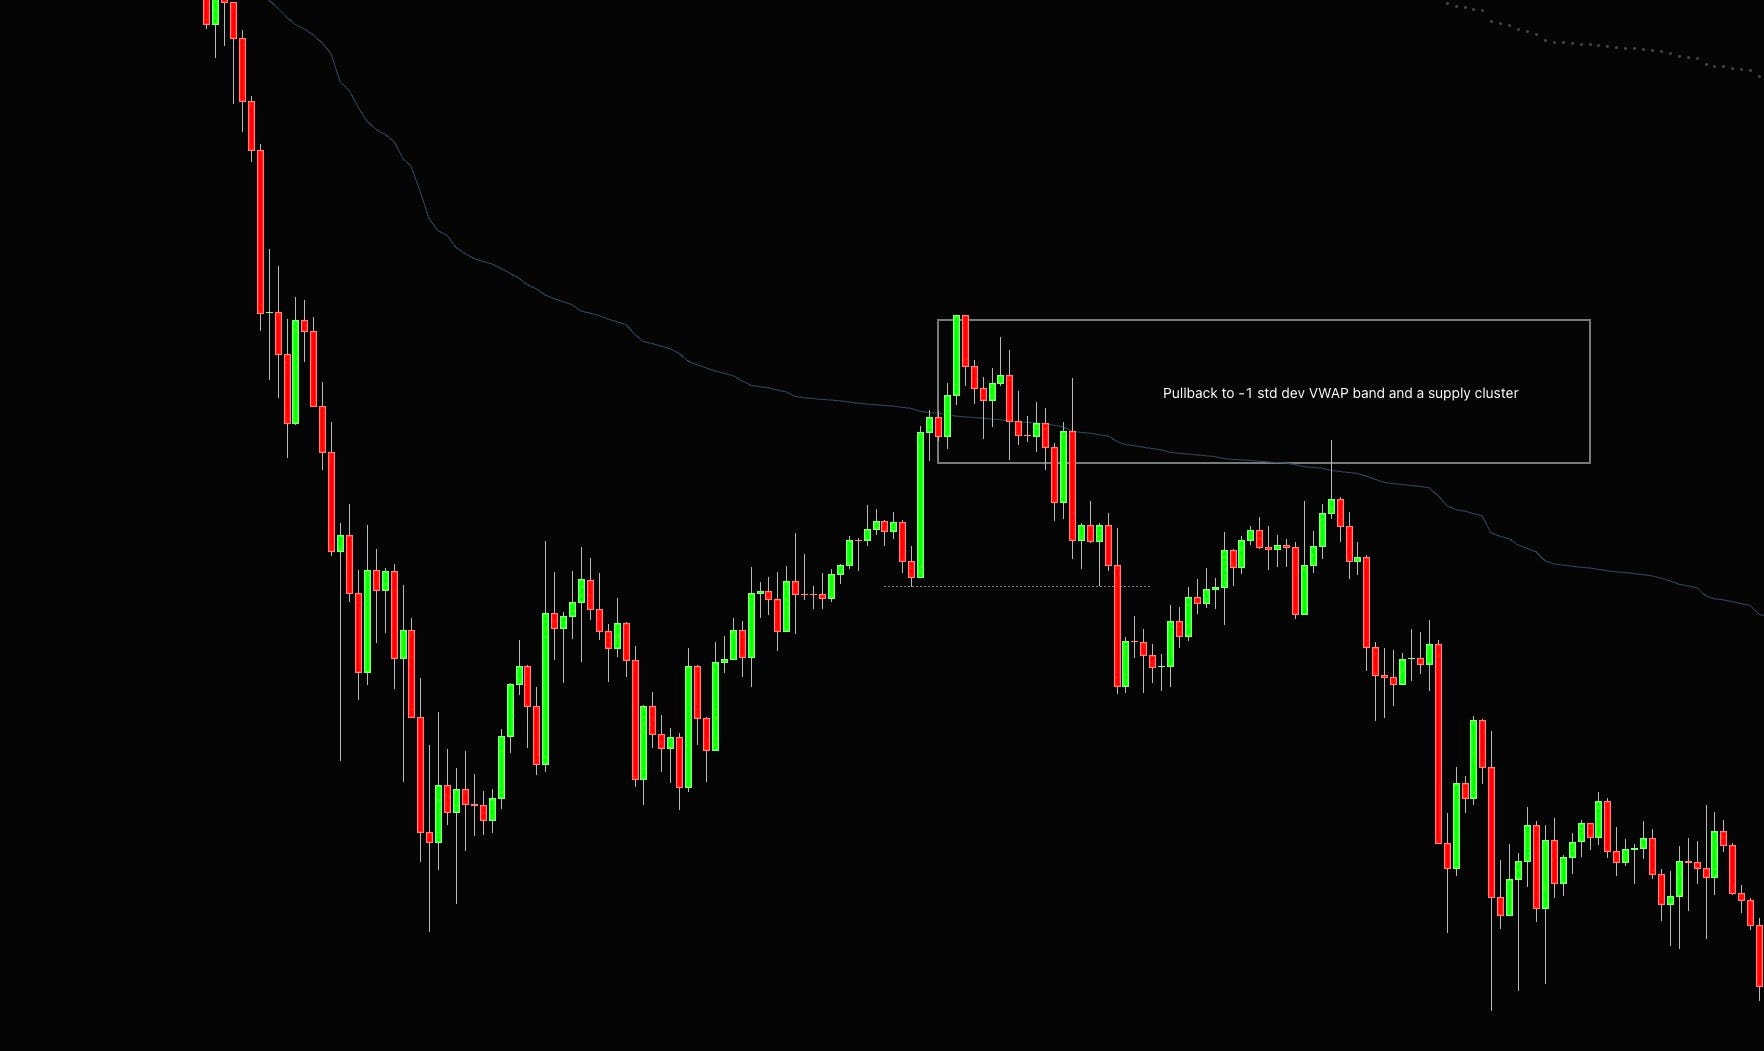
At this point of the article, you should probably know that on its own these are not that special, but stacking them on top of things you already know, you can find some decent trading opportunities.
Delta
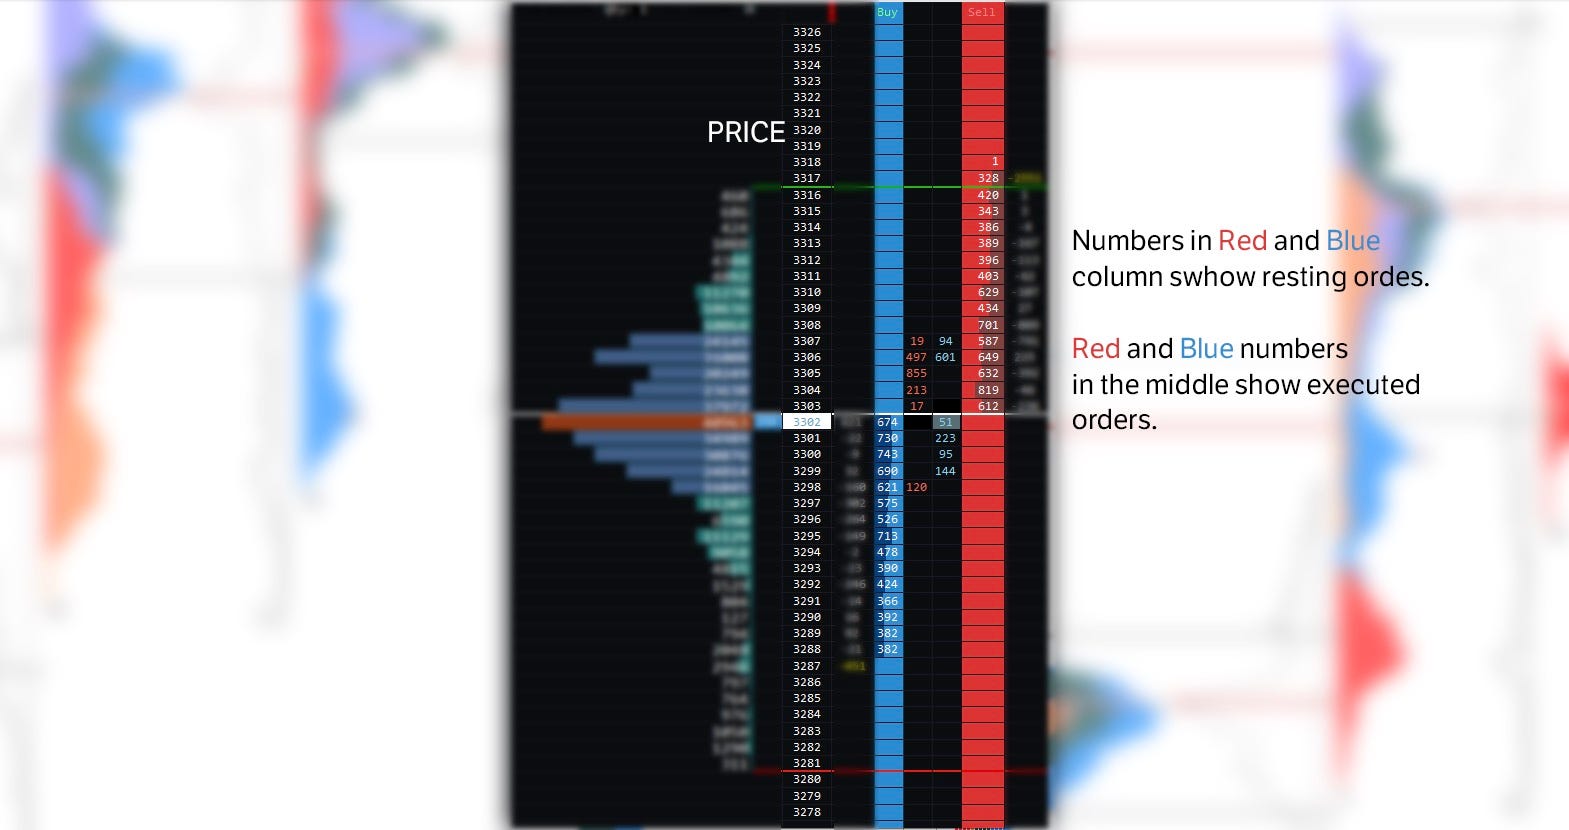
There are two types of orderflow. Active (market orders) and passive (limit orders). The active Orderflow is usually called the aggressor, as they don’t want to wait, so they execute their orders at the bid or the offer.
Market orders are typically used by smaller players because they aren’t concerned about the spread that much. If you are, for example, open 1 lot in German Bund (FGBL) and get in at the market, the one tick you pay in the spread is worth €10.
Trading only that 1 lot, a 10 € spread is something you can live with, but if you want to execute 100 or 500 lots, you won’t be so happy to pay a few thousand euros just in the spread.
Once you hit a market order, you are taking liquidity from the market. During high-impact news, for example, markets tend to get driven by the market orders; that means high volumes and low liquidity cause high volatility.
Those traders that use market orders to get in the market are usually the weaker hand, as they are less patient ones.
Passive order flow is the advertisement in the book and the resting bids and offers. Large players typically use them, and they determine the market structure.
More often than not, they are a heavier hand in the market, making the liquidity. In a healthy trending market, you want to market and limit orders that come in hand, but they do not agree frequently, which is where you can find trading opportunities.
Cumulative Volume Delta (CVD) shows us a running total of finalized executions at the bid and ask. If the cumulative market volume delta is rising, buyers are more willing to trade into the offer than sellers hitting the bid. And vice versa, CVD is not the leading price but shows us where we can find out absorption areas, which will present as divergences in the chart.
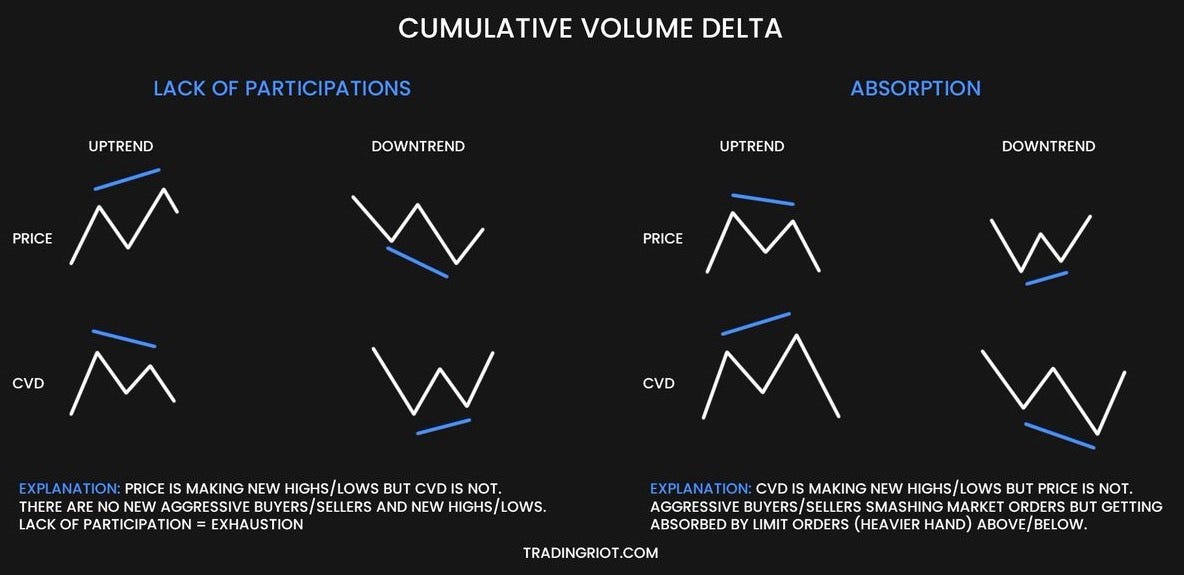
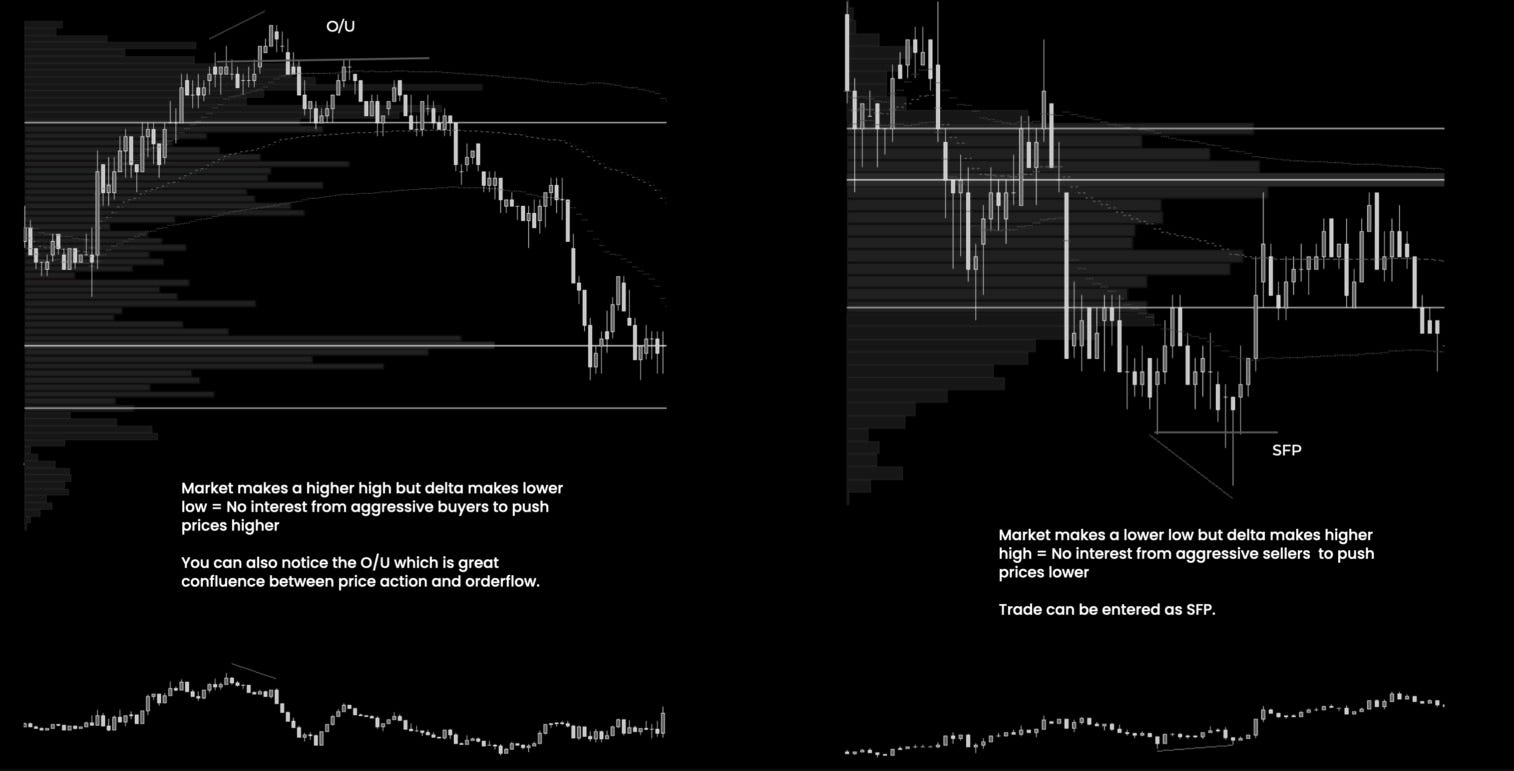
CVD can work as a great confluence for price action setups I have shared in this article, as it can confirm numerous principles I spoke about.
Another is the delta attached to the daily volume profile. This shows us price levels where large buying and selling occurred.
As you can see in the example, we had two areas with very high selling pressure displayed with long red delta bars during the down day. In these areas, there are also supply levels we can use as entry levels.
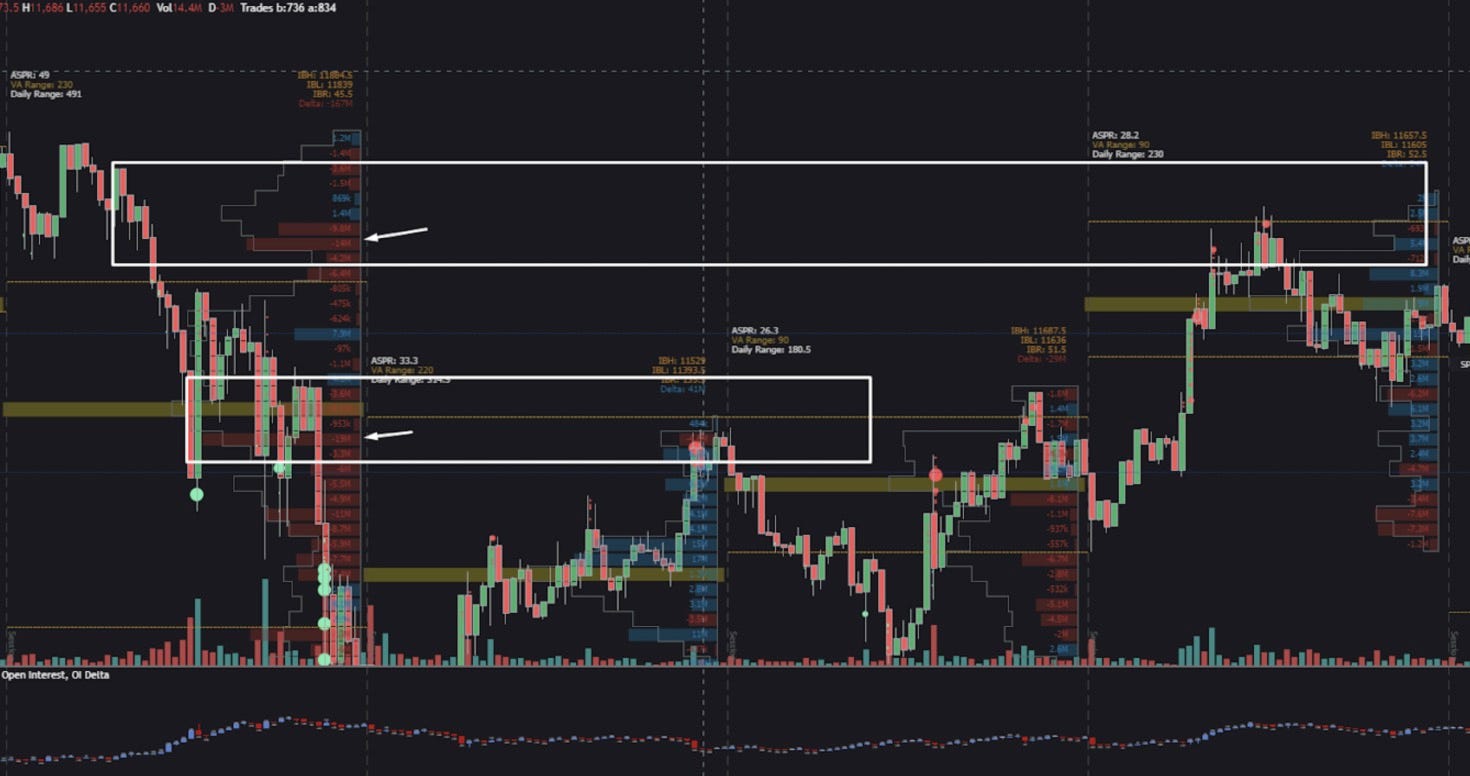
Because there was high selling pressure in the past, there are likely to be stacked orders, which will add more selling pressure on a retest.
A lot of these are different visualizations of the same thing. The example I have shown you before with absorption above the resistance highlighting the market order bubbles will show the spike in CVD as market orders are heavily buying and will highlight the same buying delta on the volume profile. You obviously don’t need to use all of these at once.
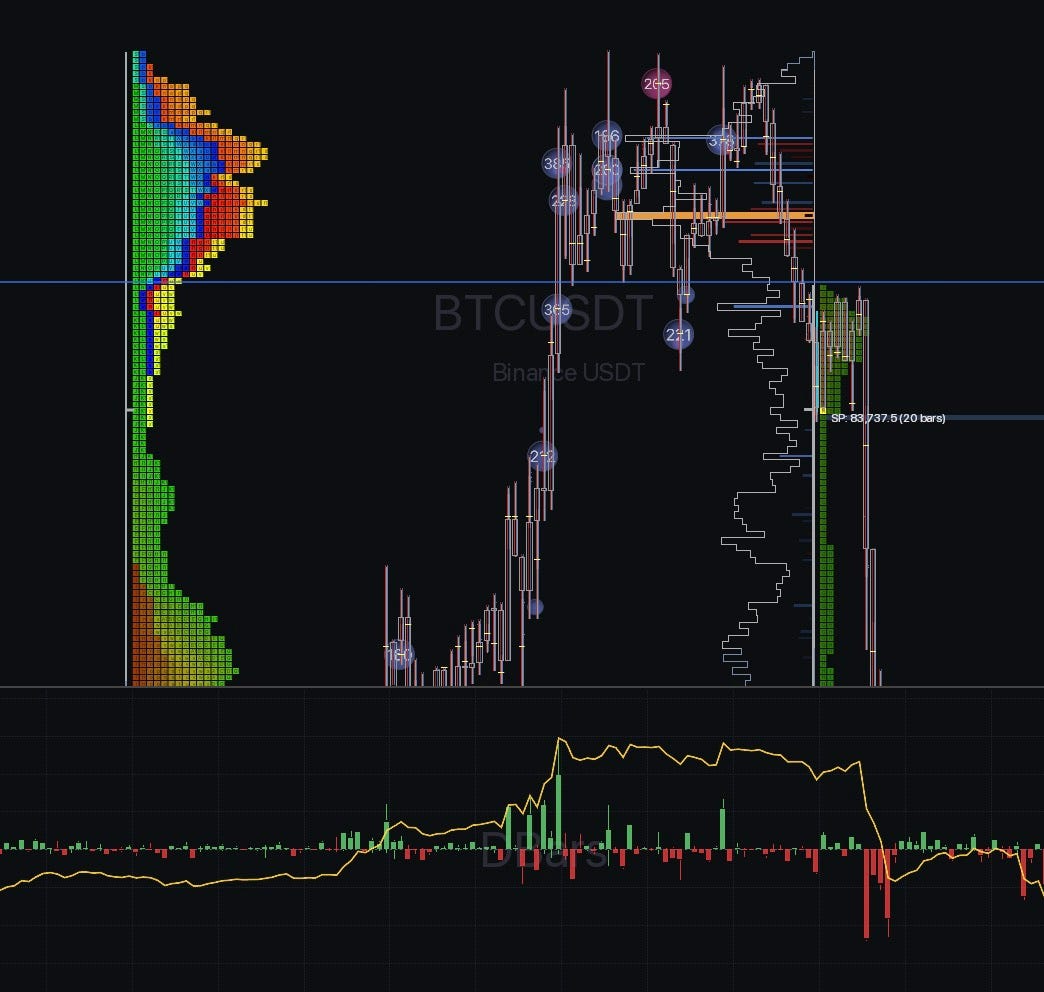
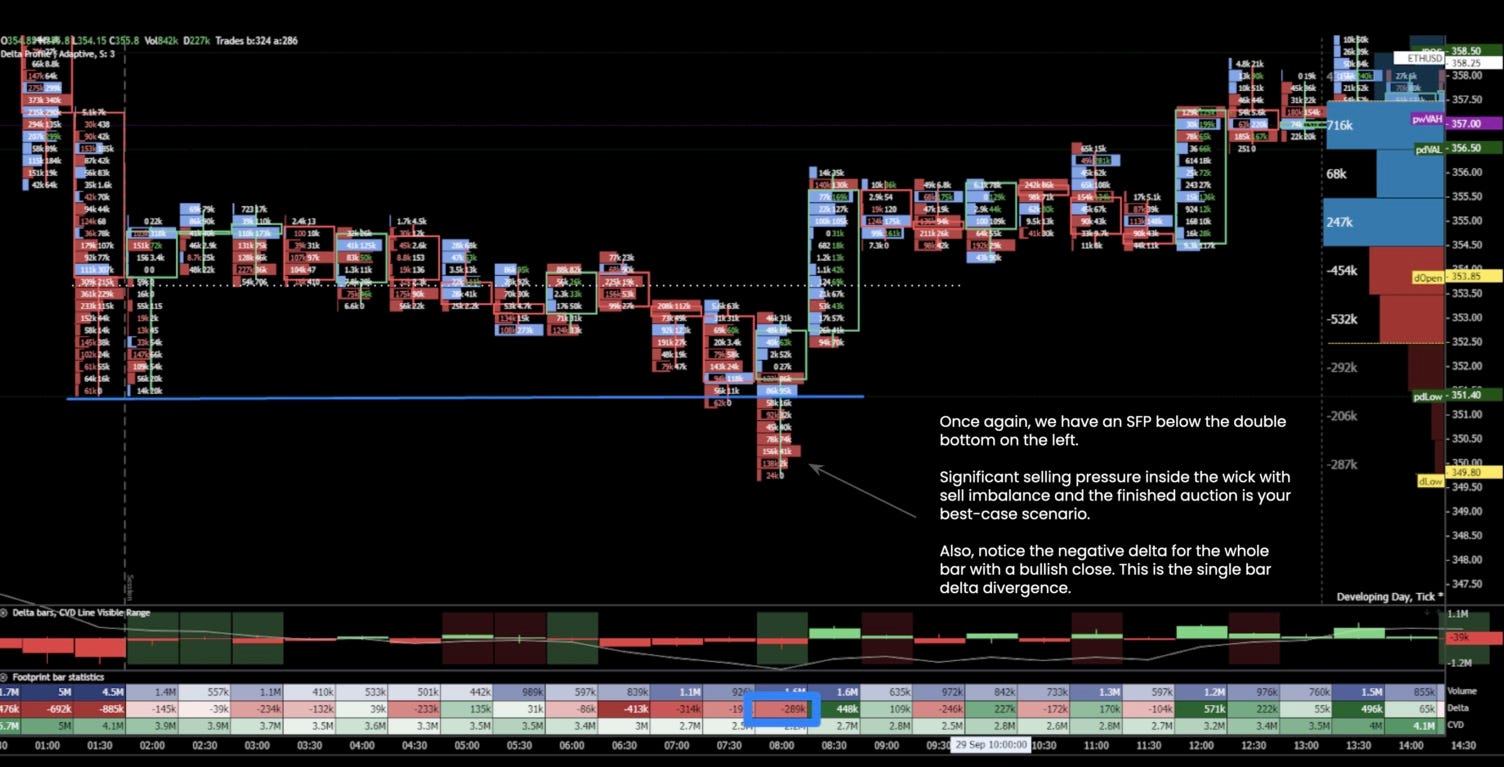
Footprint charts
The footprint chart offers us a look inside the candle with volume traded at exact prices. You can watch a footprint chart on the monthly chart down to the tick chart, but I would not recommend going higher than something like 30- to 60-minute charts; thereafter, that many details can get lost, especially if you are looking at delta instead of volume.
Thanks to the footprint chart, we can see where sellers and buyers are interested and where they are trapped. You can see sellers hitting the bid on the left side and buyers lifting the offer on the right side on a footprint chart.
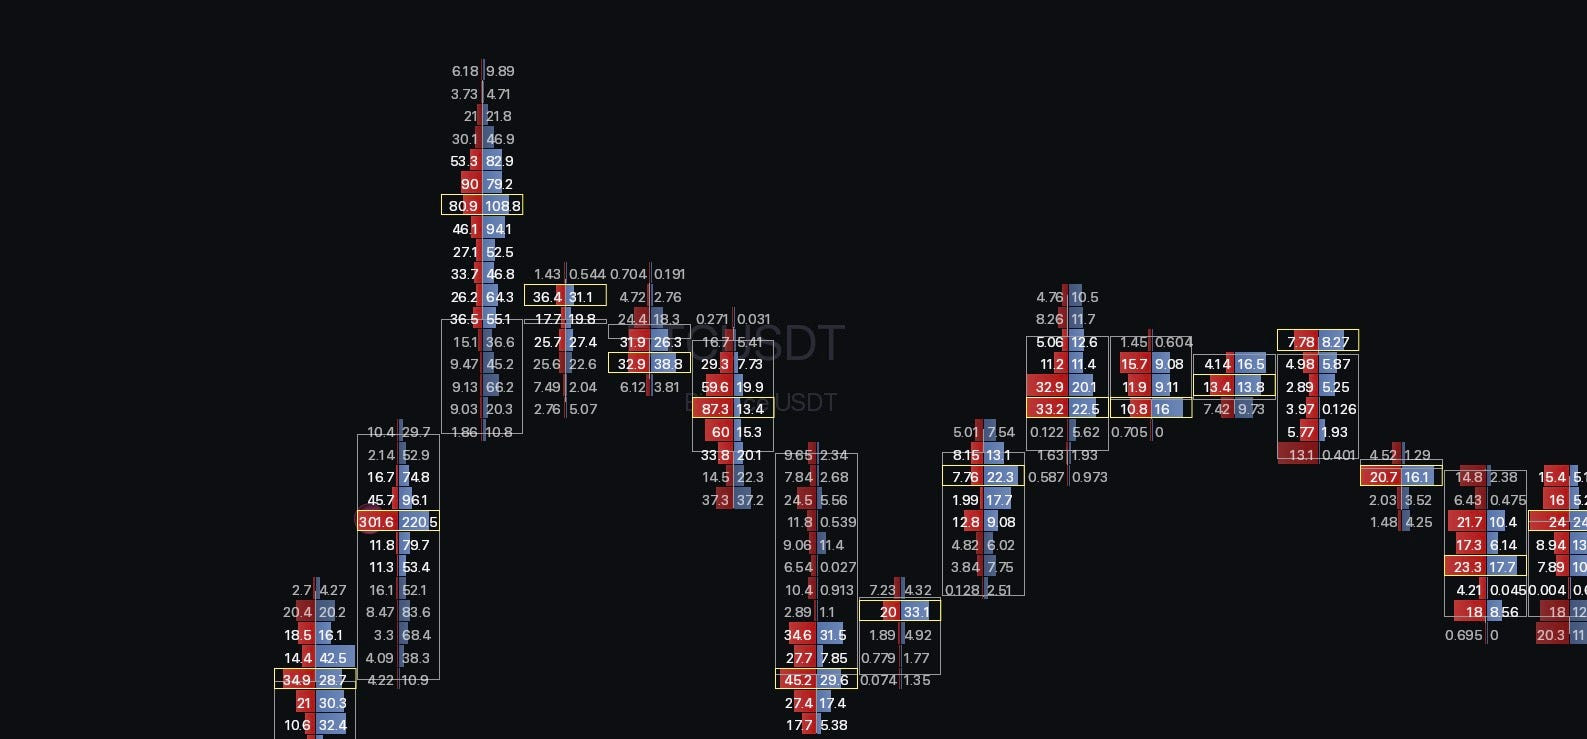
Besides, footprint charts look pretty cool, which is probably the main reason everyone tries to use them; they can often do more harm than good, as you can get easily overfixated on every print you see.
While there are some strategies like stacked imbalances and finished/unfinished auctions, from my experience the main use case is to confirm absorptions, when you want to fade the moves.
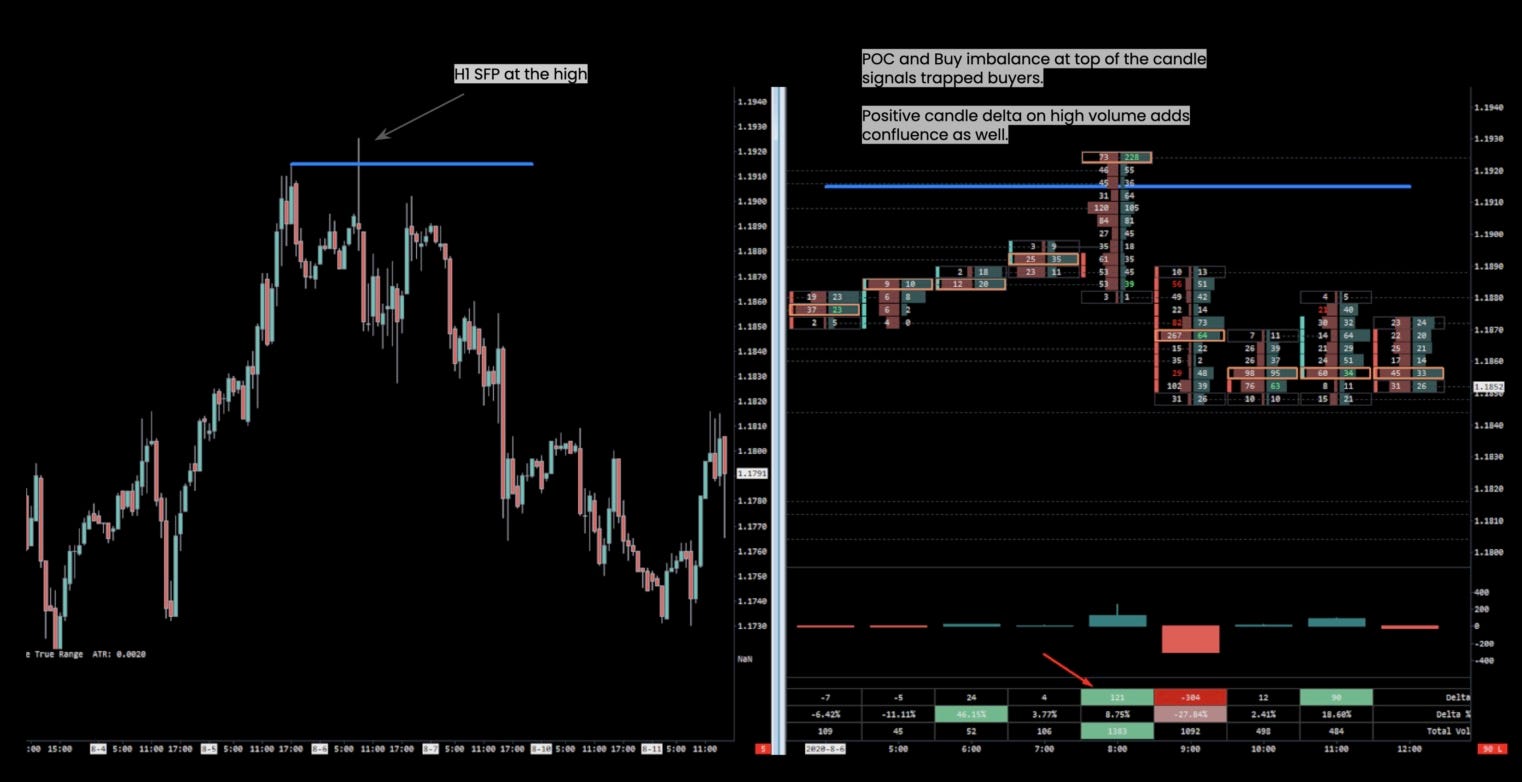
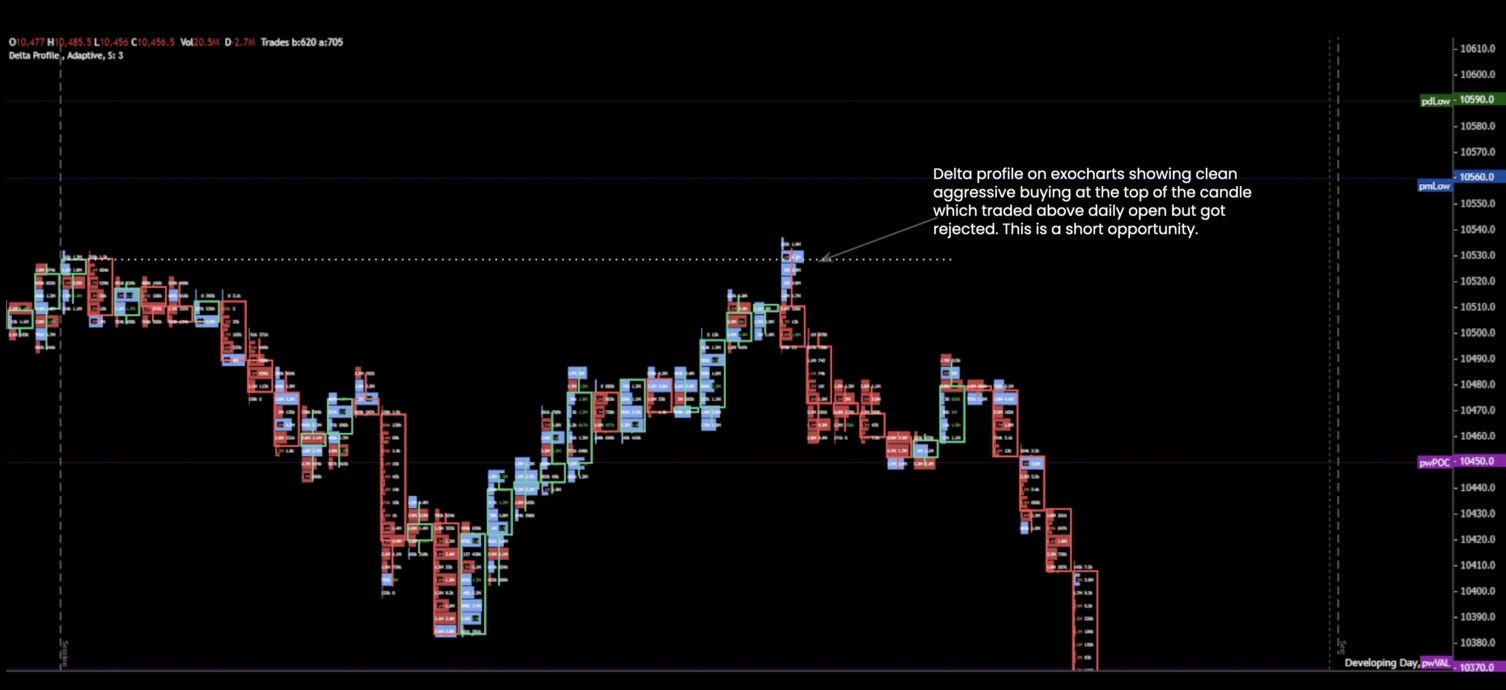
Putting things together
This was quite a lot; if you are really new, you should take things step by step, starting with price action and building slowly upon that.
Since over the years I have traded many markets and many trading styles, here is a breakdown of how I would approach things and what tools I would use for different trading styles.
Swing/Positional Trading
If you have time to trade intraday and want to only focus on holding positions for days, weeks, and occasionally a month, you can confidently skip the whole orderflow and auction market theory section.
For all swing traders, I would recommend visiting tradingriot.com, where you can follow my systematic portfolio and also trade several low-frequency strategies in futures and options that won’t require much time and will help you build a portfolio of non-correlated returns.
If you would rather not do that, just use price action concepts I have covered. Use monthly and weekly timeframes to mark out key levels on your chart and daily timeframes for trade execution and management.
It will be a slow process to build confidence and a track record of only trading price action setups, so be sure to commit to that.
Intra-week trading
Those of you that don’t necessarily want to go into trading 1-minute charts can structure your trades around finding levels on the weekly and daily timeframes with execution on H1, which provides an ideal amount of granularity.
While for swing and positional trading you will have to track loads of markets to find trade opportunities, this is not as drastic for intraweek trading, although you should still look at more than one market to be moderately active.
Use price action and some composite profiling methods or monthly/quarterly/yearly VWAPs to analyze your charts. For execution while H1 is on the edge of “orderflow-usefulness”, you can still gain additional confluence from footprint absorptions and looking at how the market behaves once large orders go through. In this timeframe I would probably not use CVD, as that is most useful in intraday moves.
Day-trading/Scalping
When it comes to active day trading, here you want to experiment with all the tools I went through in this article.
While not everything might stick, they are worth testing out to see if they can improve your trading.
For timeframe selection there isn’t much of a reason to look above the daily chart, as you shorter timeframe looking at the 30-minute chart is beneficial as it lines up with the market profile that gets constructed from 30-minute periods.
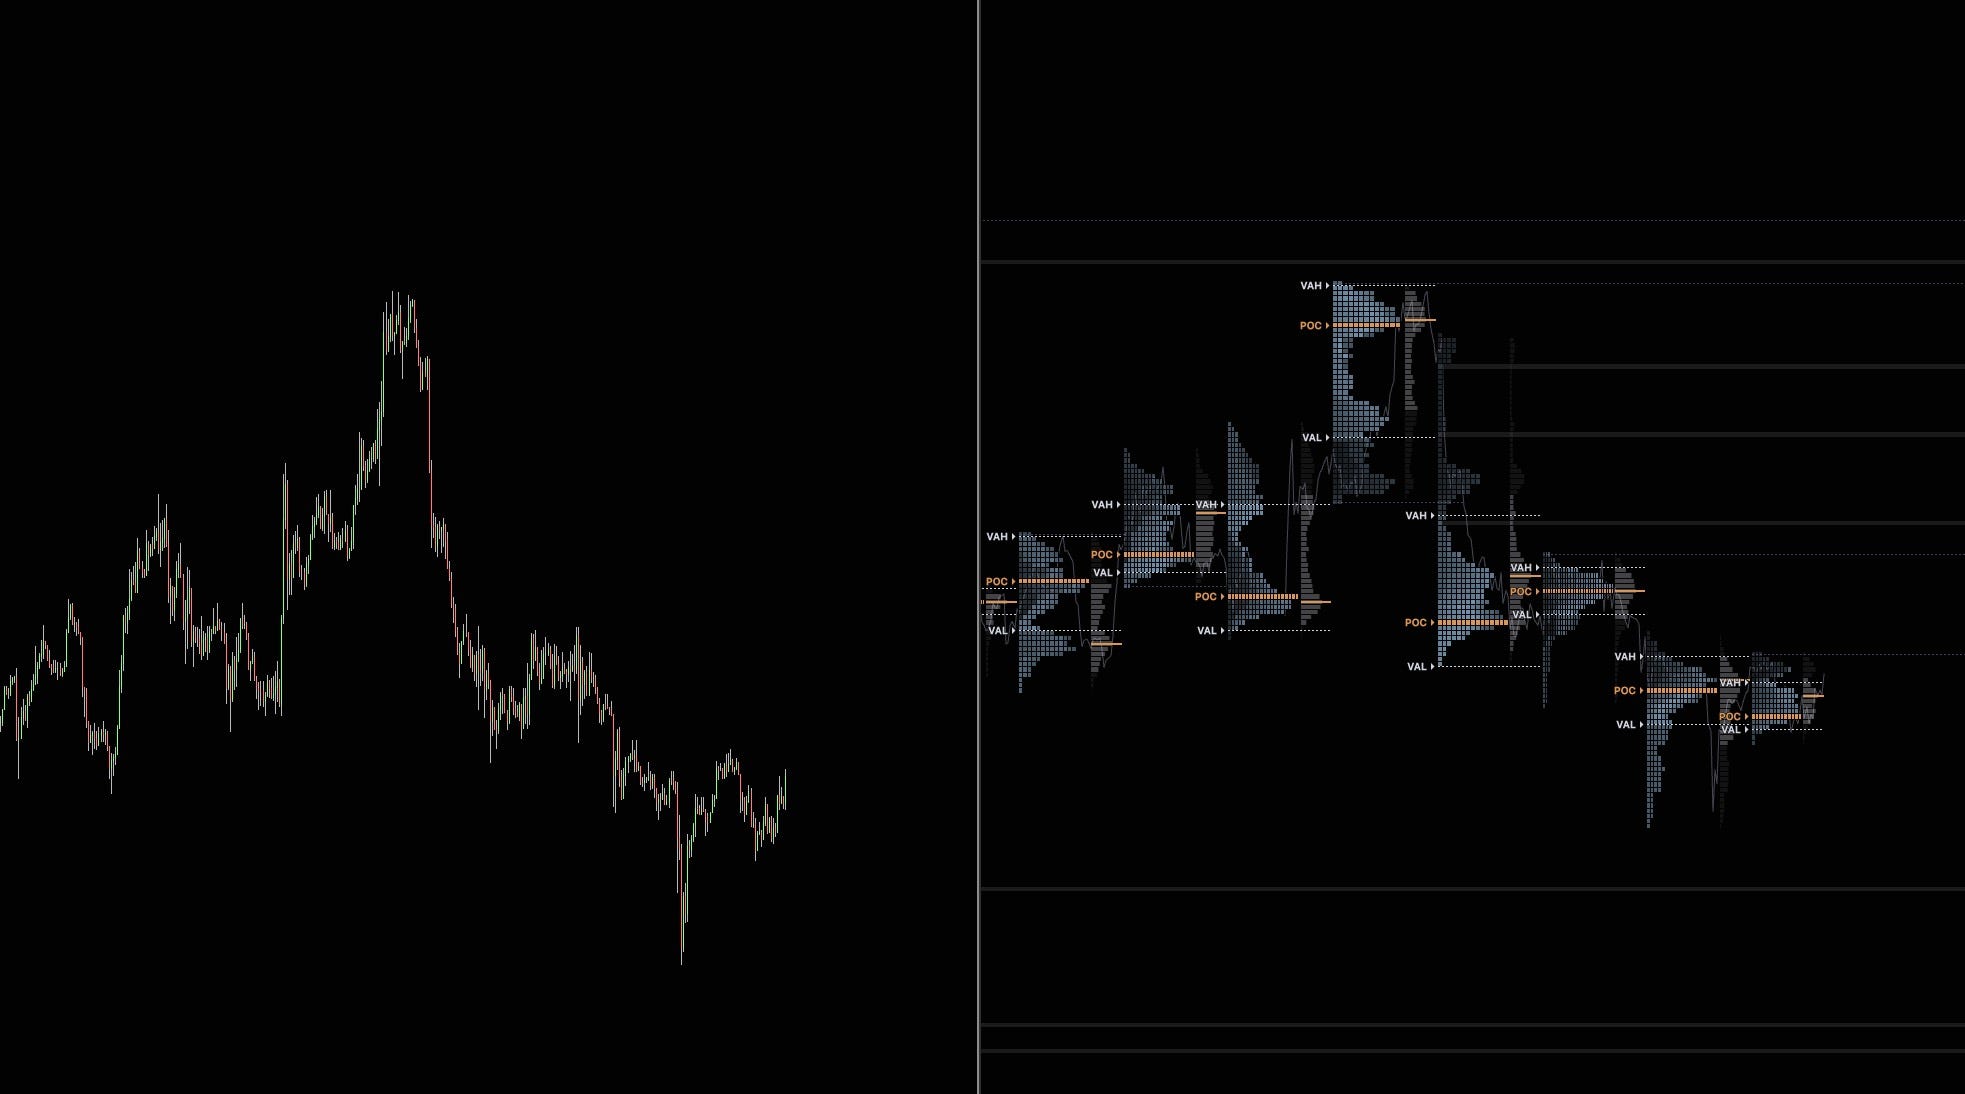
For trading execution you will end up anywhere between 1-5 minute charts; you can also experiment with non-time-based charts, which I was highly fond of when I used to day trade and was using exclusively tick charts. You won’t really have time to trade more markets than one, so choose wisely, and think about not only your competition but also trading hours, capital requirements, and so on.
Conclusion
There’s no right or wrong way to make money in the markets. You can find traders who only use indicators, trade price action, or trade fully algorithmically and be successful.
Discretionary trading is definitely sometimes on the edge of being astrology for men, but I believe you can make it work if you put the time in, find a repeatable process, have proper risk management, and have the discipline to keep showing up through the boring and painful parts.
Losers are -1R, and winners pay W R. A true EV of e per trade then means a win rate of (1 + e) / (1 + W). The number of trades needed is n = (1.96 × sd / e)², where sd is the spread of results per trade. That’s the point where the average of n trades is far enough from zero to be about 95% sure the edge is real.